Abstract
This study aimed to examine whether the ratio of vessel-specific coronary arterial lumen volume to the fraction of myocardial mass (VR/MR) affects myocardial ischemia. We proposed a calculation method for VR/MR, and compared the ratio of total epicardial coronary arterial lumen volume to left ventricular myocardial mass (V/M) with VR/MR in predicting myocardial ischemia. VR/MR and V/M were computed using data from 205 patients with 241 stenosis vessel who underwent coronary computed tomography angiography (CTA), quantitative coronary angiography, and fractional flow reserve. The vessel-specific coronary arterial lumen volume (VR) was obtained from CTA by segmenting the coronary arterial lumen volume, while the vessel-specific fraction of myocardial mass (MR) was obtained by allometric scaling. The VR/MR was then calculated. The cut-off values of V/M (23.55 mm3/g) and VR/MR (12.98 mm3/g) were used to define equal groups of ischemic and non-ischemic patients, respectively. Using these cut-off values, the accuracy, specificity, sensitivity, positive predictive value, and negative predictive value of V/M were 60%, 76%, 45%, 57%, and 66%, and of VR/MR were 87%, 92%, 77%, 89%, and 83%, respectively. Patients have different VR/MR values in different stenotic coronary arteries. Clinically, VR/MR is a quantitative indicator of the risk of myocardial ischemia.
Keywords: Coronary artery disease, fractional flow reserve, fractional myocardial mass, volume to mass ratio
Impact statement
In this study, we proposed a method to calculate the vessel-specific coronary arterial lumen volume to the fraction of myocardial mass (VR/MR). We found that patients have different VR/MR values in different coronary artery stenosis areas. This may be caused by the imbalance between the supply and demand of stenosis vessels. We have also shown that VR/MR is a reliable quantitative indicator for predicting the risk of myocardial ischemia.
Introduction
Cardiovascular diseases remain the leading cause of death and morbidity globally. 1 Occlusion of coronary arteries leads to a mismatch between myocardial demand and supply for oxygen and nutrients, causing myocardial ischemia. 2 However, inconsistencies between the severity and functional significance of coronary angiographic stenosis were reported in the DEFER and FAME clinical trials, 3 where coronary angiography alone was not accurate in determining myocardial ischemia. Currently, fractional flow reserve (FFR) is considered the “gold standard” for clinical diagnosis of functional myocardial ischemia.4–7 It is defined as the ratio of the maximum blood flow to the myocardium in the area supplied by the narrow coronary artery to the maximum blood flow to the myocardium in the absence of stenosis in the same coronary artery. FFR could be calculated as , where Pa and Pd are the mean pressure of aortic root during maximum hyperemia and the mean pressure of coronary artery distal to the stenosis, respectively. Given the role of FFR in the diagnosis of myocardial ischemia, it is important to explore factors that influence its accuracy in predicting myocardial ischemia. 8
Anatomical stenosis, myocardial mass, and microvascular resistance are significant constituents of FFR value. 9 However, in clinical practice, the relationship between FFR and regional myocardial mass and coronary microcirculation resistance cannot be directly measured. So, the influence of the fraction of the myocardial mass (FMM) or microcirculation resistance on FFR is generally studied through the assumption of allometric scaling. We hypothesized that the causes of functional myocardial ischemia in the coronary arteries might be due to changes in the FMM and microcirculation resistance supplied downstream of the coronary arteries.
The study of Hyung Yoon Kim Etl et al. 10 showed that the FMM determined by the length of coronary arteries could explain the mismatch between coronary artery anatomy and function. The FMM and minimum stenosis diameter (MLD) can be used to assess the severity of physiological coronary artery stenosis. Although FMM and MLD were correlated with FFR, the accuracy of predicting myocardial ischemia by the optimal truncation value of FMM/MLD was only 77%. Possibly this is because FMM simply reflects myocardial demand.
The ratio of coronary artery volume to myocardial mass (V/M) is a new predictor of myocardial ischemia, 11 reflecting the supply–demand relationship between the patient's entire coronary arteries and myocardial mass. Studies have shown patients with low V/M, defined as values lower than the median value of 18.57 mm3/g, were found to have lower FFR values than those with high V/M with or without focal coronary stenoses >50%.
V/M mainly reflects the relationship between the total coronary artery volume and the total demand for myocardial perfusion. It is based on the overall cardiac blood supply and demand. The amount of myocardial mass subtended by vessel, which is getting attention, is highly associated with the presence of myocardial ischemia and determines the clinical benefit of revascularization.12–19 Therefore, we hypothesized that there might be different V/M values in different coronary artery perfusion territories.
This study proposes a calculation method for the ratio of vessel-specific coronary artery lumen volume to the FMM (VR/MR). Also, we compared the ratio of total epicardial coronary arterial lumen volume to left ventricular myocardial mass (V/M) vs VR/MR as predictors of the risk of myocardial ischemia.
Materials and methods
Clinical patients were enrolled
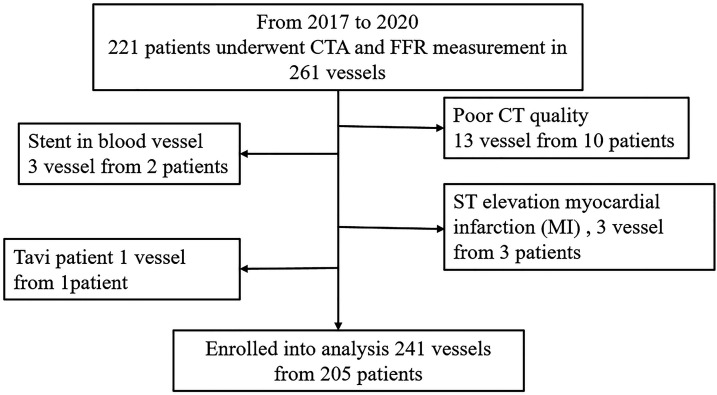
This retrospective registry-based multi-center study was conducted at three university teaching hospitals in China (Peking University People's Hospital, Friendship Hospital of Capital Medical University, The Second Affiliated Hospital of Zhejiang University School of Medicine). Between January 2017 and July 2020, a total of 221 patients who underwent clinically indicated coronary computed tomography angiography (CTA) and invasive FFR measurement were enrolled. The exclusion criteria of this study included low CTA image quality, coronary artery occlusion, patients undergoing thoracotomy with transcatheter aortic valve implantation and ST-elevation myocardial infarction, as shown in Figure 1.
Figure 1.
Patients enrolled in this study.
CT: computed tomography; CTA: computed tomography angiography; FFR: fractional flow reserve; MI: myocardial infarction.
The clinical characteristics of the study population are shown in Table 1. Among the 221 patients, 16 had at least one totally occluded vessel and were excluded from further analysis.
Table 1.
Basic characteristic form of enrolled patients.
| Characteristic | Data |
|---|---|
| Number of patientsa | 205 |
| Number of vesselsa | 241 |
| Ages (years)b | 62±(10) |
| Malea | 138 |
| Femalea | 67 |
| Systolic and diastolic blood pressureb | 133.18±(16.11)/76.98±(11.0) |
| Heart rateb | 70 (11) n/min |
| Cardiac outputb | 4.55 L/min |
| Myocardial massb | 140.20 (41.64) g |
| Stenosis locationa | |
| LAD | 160 |
| LCX | 41 |
| RCA | 40 |
| Stenosis extenta | |
| 30%–50% | 62 |
| 50%–70% | 116 |
| 70%–90% | 63 |
aNumbers of characteristics.
bThe mean ± the standard deviation of characteristic.
LAD: left artery descending; LCX: left circumflex artery; RCA: right coronary artery.
Volume to mass and vessel-specific volume to fraction of the myocardial mass calculation
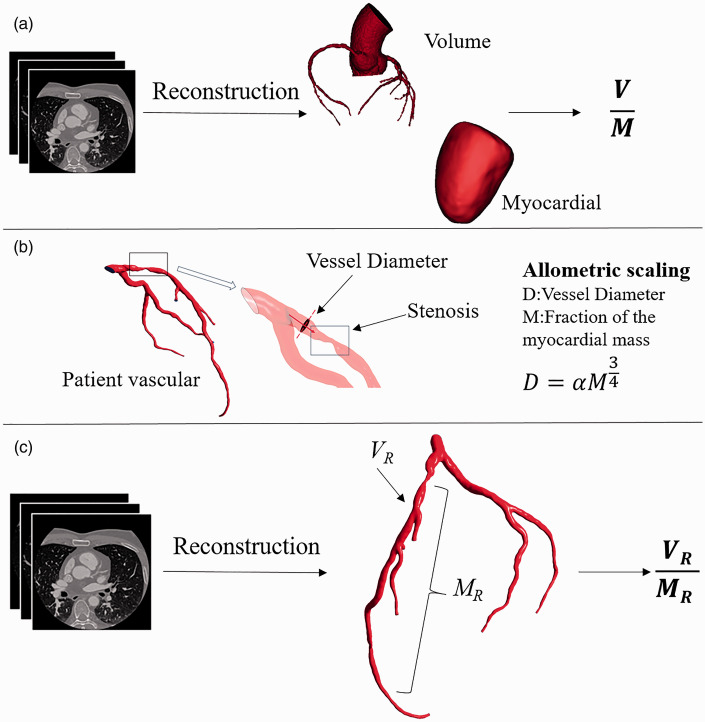
The coronary artery lumen volume to left ventricle myocardial mass ratio was computed as shown in Figure 2(a). 11 The resolution of the coronary artery CTA images of the enrolled patients was 512*512. The interval between adjacent CTA image slices was 1 mm, and the pixel quality of each slice was 0.5 mm*0.5 mm. Nitroglycerin was administered before CT and FFR acquisition. We used a 3D model reconstruction software to reconstruct the epicardial coronary artery model and the myocardium model. According to the coronary artery lumen segmentation, 20 the segmented coronary arteries’ minimum diameter was 1 mm, and coronary arteries greater than 1 mm in diameter were included. The volume of the coronary artery lumen and the volume of the left ventricle were automatically measured. The left ventricle myocardial mass was calculated by the volume of the myocardium multiplied by an average value of myocardial tissue density. The ratio of the total arterial lumen volume to the left ventricle myocardial mass (V/M) was then computed.
Figure 2.
Methodology for computing V/M and VR/MR. (a) The epicardial coronary arteries were segmented from coronary CTA data, and a three-dimensional volumetric model was created. The left ventricle myocardial volume was extracted from the CTA data and multiplied by a constant density value to obtain the myocardial mass. V/M is the ratio of epicardial coronary arterial lumen volume to left ventricle myocardial mass. 11 (b) Determination of the fraction of the myocardial mass by allometric scaling. 22 (c) Stenosis in the epicardial coronary arteries was segmented from coronary CTA data and the three-dimensional volumetric model. The fraction of the myocardial mass subtended by the vessel territory was calculated by allometric scaling. VR/MR is the ratio of regional coronary artery stenosis lumen volume to the fraction of the myocardial mass subtended by the vessel territory ratio. (A color version of this figure is available in the online journal.)
The vessel-specific coronary artery lumen volume to the FMM was computed as shown in Figure 2(b) and (c). First, the three-dimensional patient vessel-specific anatomic model of the coronary arteries was segmented from imaging data. We calculated the vessel-specific coronary arterial lumen volume (VR). Second, the vessel-specific fraction of myocardial mass FMM was computed as shown in Figure 2(b). Each coronary artery perfuses a certain myocardial tissue mass, and coronary artery diameters and perfused myocardial mass are correlated according to the allotropic. That is to say, there is a correlation between the diameter of coronary arteries and myocardial mass according to the allotropic scale 21
where D is the diameter of the coronary arteries, A is the coefficient, and M is the vessel-specific fraction of myocardial mass (MR) of the coronary artery area. Third, the ratio of vessel-specific coronary arterial lumen volume to the fraction of myocardial mass (VR/MR) was computed.
In this study, we found that the main lesion areas of the patients were located in the right coronary artery (RCA), the left descending artery (LAD), and the left circumflex artery (LCX). Therefore, we mainly calculated the VR/MR values of the vessels in the three main areas of the patients.
Statistical analysis
We used Mimics 20.0, an interactive medical image control system, for image reconstruction. The diameter of the vessels with coronary artery stenosis was automatically measured by the software. Categorical variables are shown with frequencies with percentages. Continuous variables are shown with mean ± standard deviation. Spearman's rank correlation coefficient among scores was assessed. Single-factor linear regression analysis was performed on VR/MR. Receiver operating characteristic (ROC) curve analysis was carried out for VR/MR, with the optimal intercept calculated by Youden index. The prediction of FFR < 0.80 was made based on V/M, VR/MR cut-off value. Accuracy, specificity, sensitivity, positive predictive value (PPV), and negative predictive value (NPV) were presented with proportions, and 95% confidence intervals (CI). A two-tailed p < 0.05 was considered statistically significant. All statistical analyses were conducted using SPSS.
Results
A representative patient with different VR/MR in different stenosis
A 68-year-old patient with coronary heart disease was taken as an example to calculate the VR/MR values of different vascular regions with coronary artery stenosis. The physiological parameters of the representative patient were as follows: the heart rate was 84/min, the blood pressure was 135/85 mmHg, the cardiac output was 3.8 L/min. According to CTA and coronary angiography of patient A, the blood supply mode of the coronary artery was the right-dominant type, and the blood vessels at the left and right coronary artery openings were normal. There were lamellar calcified areas in the left coronary artery, 60%–75% diffuse stenosis in the distal and middle parts of the LAD, with TIMI3 grade of forward blood flow. Diffuse stenosis in the middle section of LCX (70%–90%) with TIMI3 level of forward flow was also observed. Besides, there was a 60%–70% segmental stenosis in the middle section of the RCA with TIMI3 level of forward flow. The cardiologist performed FFR catheter operation on the RCA, LCX, and LAD lesions.
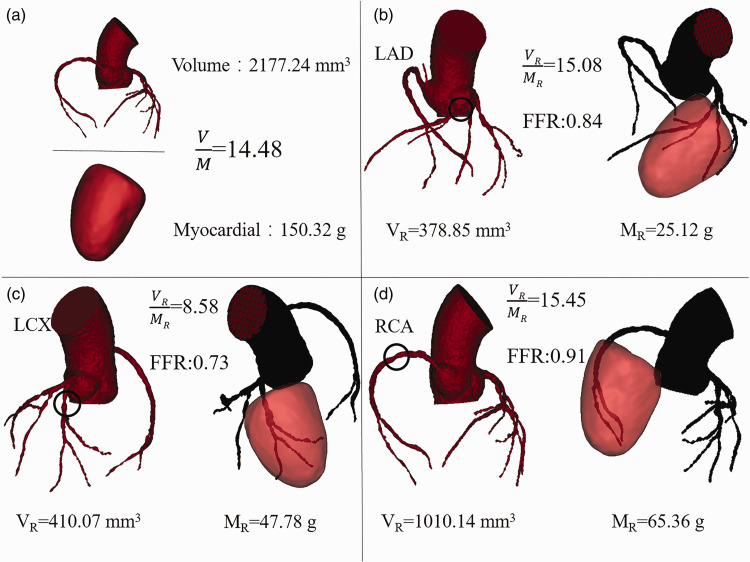
The RCA, LAD, and LCX of patient A were all moderately narrow. According to the VR/MR calculation method of the coronary artery region, the VR/MR values of the coronary artery stenosis region of patient A are shown in Figure 3.
Figure 3.
The V/M and VR/MR of patient A. (a) The patient's total V/M. (b) to (d) The vessel-specific VR/MR of patient A. (A color version of this figure is available in the online journal.)
FFR: fractional flow reserve; LAD: left artery descending; LCX: left circumflex artery; RCA: right coronary artery.
The relationship among V/M, VR/MR, and FFR
We calculated the V/M of 205 patients and the vessel-specific VR/MR of 241 narrow blood vessels. Single-factor linear regression analysis was carried out for V/M, VR/MR, and FFR, as shown in Figure 4(a) and (b). As shown in the figure, with moderate coronary stenosis, FFR and V/M show a weak positive correlation (R= 0.06, p < 0.0001). The lower VR/MR corresponds to the vessel FFR < 0.8 of coronary stenosis. FFR and VR/MR showed a positive correlation (R = 0.44, p < 0.0001). In a single-factor regression analysis, V/M and VR/MR were independent predictors of FFR < 0.8.
Figure 4.
(a) The relationship between FFR and V/M. (b) The relationship between FFR and VR/MR.
FFR: fractional flow reserve.
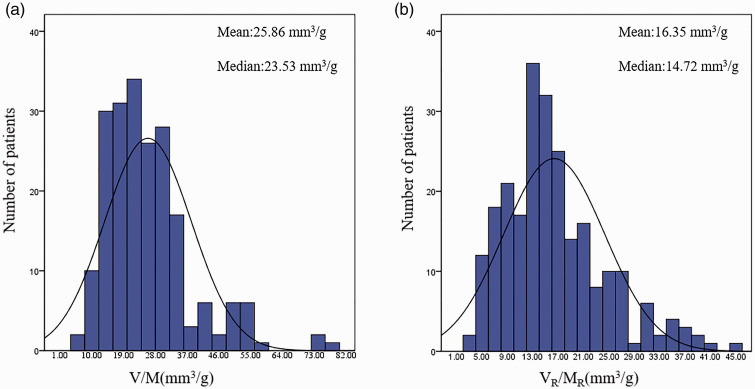
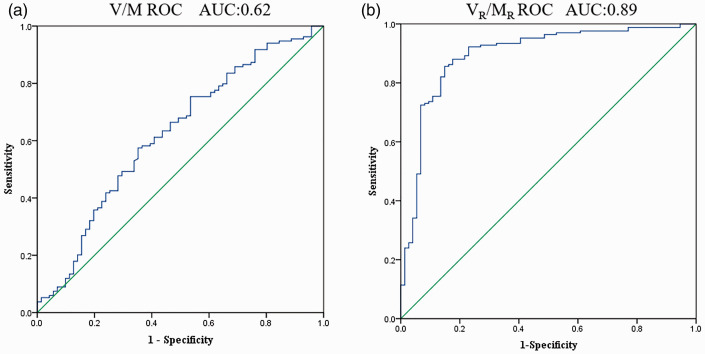
Figure 5(a) and (b) shows the frequency distribution of VR/MR, and histogram analysis of V/M, VR/MR data. As shown in Figure 6, VR/MR showed a normal distribution. The median of V/M was 25.86 mm3/g, and the average value was 23.53 mm3/g. The median of VR/MR was 16.35 mm3/g, and the average value was 14.72 mm3/g.
Figure 5.
(a) Histogram of V/M. (b) Histogram of VR/MR. (A color version of this figure is available in the online journal.)
Figure 6.
(a) V/M receiver operating curve graph. (b) VR/MR receiver operating curve graph. (A color version of this figure is available in the online journal.)
AUC: area under curve; ROC: receiver operating characteristic.
We examined the correlation between V/M and VR/MR for FFR ≤0.80 (Table 2). There were significant correlations between V/M, VR/MR, and FFR (p < 0.05 for all).
Table 2.
Bivariate analysis for FFR ≤0.80: overall and per vessel.
|
Overall (N = 205 patients) |
Vessels (2–1) (N = 241 vessels) |
|||
|---|---|---|---|---|
| Correlation coefficient | P-value | Correlation coefficient | P-value | |
| V | 0.086 | 0.222 | – | – |
| M | –0.97 | 0.167 | – | – |
| V/M | 0.14 | 0.036 | – | – |
| VR | – | – | 0.201 | 0.02 |
| MR | – | – | –0.276 | <0.01 |
| VR/MR | – | – | 0.55 | <0.01 |
P < 0.05 is significant.
M: myocardial; MR: fraction of the myocardial mass; V: coronary artery volume, VR: regional vessel volume.
VR/MR as a quantitative predictor of myocardial ischemia
Figure 6 shows the ROC graphs of V/M and VR/MR. The area under curve (AUC) and 95% CI of V/M was 0.62 [0.540,0.704], with a Youden index of 0.223, and best diagnostic threshold of 23.55 mm3/g. On the other hand, AUC (95% CI) of VR/MR was 0.89 [0.848,0.843], with a Youden index of 0.722, and best diagnostic threshold of 12.98 mm3/g. As shown in Figure 6(b), the AUC of VR/MR is close to 1, indicating that VR/MR diagnostic performance of myocardial ischemia is excellent. The optimal cut-off value of VR/MR was 12.98 mm3/g determined by the ROC curve and calculated Youden index.
The optimal threshold V/M = 23.55 mm3/g and VR/MR=12.98 mm3/g divided the patients into an ischemic group and a non-ischemic group (p < 0.0001), respectively.
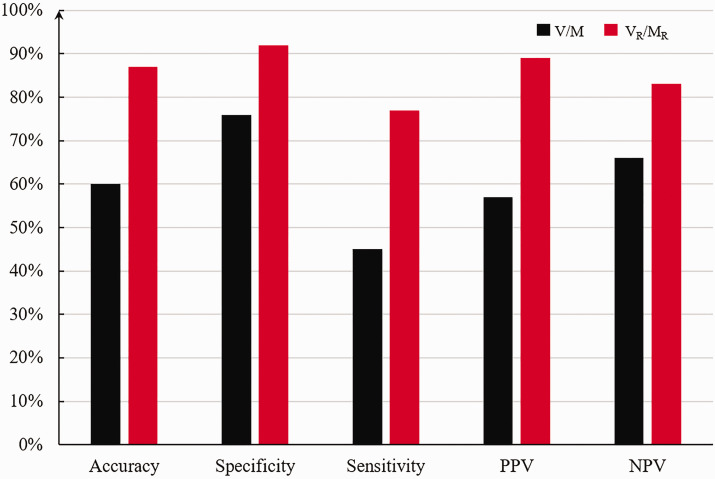
The V/M showed 60% myocardial ischemia diagnostic accuracy, specificity 76%, sensitivity 45%, PPV 57%, and NPV 66%. On the other hand, VR/MR showed 87% diagnostic accuracy, specificity 92%, sensitivity 77%, PPV 89%, and NPV 83% (Figure 7).
Figure 7.
Diagnostic performance of V/M, VR/MR. (A color version of this figure is available in the online journal.)
NPV: negative predictive value; PPV: positive predictive value.
Discussion
This study quantified the supply–demand relationship between the overall V/M and vessel-specific VR/MR and evaluated a vessel-specific VR/MR method. By calculating the VR/MR of different stenotic vessels, we confirmed different VR/MR values in different coronary artery regions. Also, we separately studied the relationship among V/M and VR/MR and FFR. We showed that VR/MR and FFR have a strong correlation. The accuracy of predicting myocardial ischemia by the optimal threshold of V/M is not high. In contrast, the accuracy of predicting myocardial ischemia by the optimal threshold of VR/MR is relatively high. Therefore, compared with the V/M value, the vessel-specific VR/MR could serve as a new clinical quantitative index for predicting myocardial ischemia. VR/MR reflects the relationship between the blood supply to coronary arteries and the demand, explaining the mismatch between myocardial demand and blood supply.
Fraction of the myocardial mass determined by the allometric scale
This fractional myocardial mass could be computed by several previously described methods, but these approaches require several assumptions to assign a portion of the myocardium to each vessel.11,22 Specifically, is the basic formula of the allometric scaling law, where M refers to the myocardial mass, b is the scaling coefficient, and Yo is the normalized constant.23,24 Choy et al. 21 studied the relationship between coronary artery flow and myocardial mass in the pig model. They determined the relationship between coronary volume and myocardial mass, and verified that the correlation between the two was significant. However, in patients with coronary heart disease, presence of plaque and atherosclerosis may impact the relationship between volume and myocardial mass. In Hyung Yoon Kim Etl’s study, linking the length of coronary vessels with the cardiomyocytes was also a method to determine the regional myocardial mass.12,13,25 However, when segmenting the coronary arteries, sometimes the coronary vessels less than 1 mm diameter are excluded, resulting in a certain calculation error for the determined regional myocardial mass.
In this study, we determined the fractional myocardial mass of the coronary artery perfusion through the diameter of the coronary arteries. We established the relationship between the diameter of the coronary arteries and the mass of the regional myocardium. 21
The physical significance of VR/MR
The concept of VR/MR is the ratio of the vessel-specific coronary artery lumen volume to the FMM. Studies have shown that the scientific basis of the volume-to-mass ratio is derived from the allometric scale rate, which theoretically relates anatomical and physiological variables to the size of the organism. Taylor et al. first proposed V/M to predict myocardial ischemia 11 and proved that V/M is an independent predictor of FFR < 0.8. V/M reflects the overall blood supply and demand of the patient’s coronary artery. However, FFR is aimed at the ischemia of each coronary artery stenosis, and many patients have multiple coronary artery stenosis lesions, V/M and FFR cannot establish a corresponding relationship. The physical meaning of VR/MR is to reflect the blood supply and myocardial demand of each coronary artery stenosis and to refine the patient’s overall coronary supply and demand relationship to reflect each coronary artery.
Limitations of V/M and strengths of VR/MR
The patient's overall V/M reflects the demand relationship between the patient's total coronary lumen and the quality of the myocardium. In contrast, vessel-specific VR/MR reflects the relationship between blood supply and demand on each narrowed vessel. Clinically, FFR measures the ischemia of each coronary artery stenosis. The advantage of vessel-specific VR/MR is that it can reasonably predict each coronary artery's myocardial ischemia. Changes in the V/M may be due to the fact that when multiple stenoses occur, the area of myocardial perfusion is controlled by different coronary arteries, which causes variations in the V/M in different regions.
Representative patient A had stenosis in the three main coronary arteries, corresponding to different areas. This patient revealed that the VR/MR values of different regions are different in the same patient. Under the same stenosis rate, high VR/MR values were less prone to ischemia, while low VR/MR values were prone to ischemia. The difference in VR/MR may be one of the reasons for the mismatch of coronary physiology and anatomy.
Coronary artery stenosis can trigger adaptive development of coronary collateral vessels, which supply arterial blood from adjacent perfusion territories of more patent coronary arteries. 26 According to the degree of development of collateral vessels, collateral vessels can still prevent myocardial ischemia in many patients despite complete occlusion of a conduit coronary artery. 27 Patients with collateral circulation are a potential influencing factor, which is a limitation of this study. We can analyze the changes in VR/MR after coronary stenosis has collateral circulation. When coronary collateral circulation is present in the perfusion territory of a stenotic vessel, the volume of perfused tissue distal to the lesion will increase to at least partially meet the metabolic demand of the affected myocardium and, thereby, reduce myocardial ischemia. After the occurrence of collateral circulation, the VR of the coronary vascular lumen increases, while the MR remains unchanged, which will increase the VR/MR index.
VR/MR is that the CTA scan can permit preliminary diagnosis of myocardial ischemia without requiring more invasive FFR catheter, thereby reducing the time and cost of treatment and examination. Because patients undergo CTA examination in the resting state, this method is an indicator of the resting state. In some patients with partially occluded but not fully occluded coronary arteries, the blood flow at rest may meet the needs of the myocardium, so there is no ischemia. However, during exercise, coronary delivery of oxygen and energy substrates fails to meet myocardial demands, causing ischemia. We suspect that the VR/MR of resting state calculation may miss some patients. Although VR/MR is a resting index, the FFR of hyperemia is used as the standard when evaluating myocardial ischemia. VR/MR indirectly characterizes myocardial ischemia under congestive state through resting state. However, it is undeniable that VR/MR may also change under hyperemia, which will have a certain impact on the diagnosis result, which is another limitation of this study.
VR/MR as a clinical index for qualitative prediction of myocardial ischemia
We postulated that the VR/MR ratio value is a measure of the vessel-specific ability of the epicardial coronary arteries to supply blood in relation to fractional myocardial demand. There is a good correlation between VR/MR and FFR, and it has high accuracy in predicting myocardial ischemia. Therefore, VR/MR is a reliable predictor of myocardial ischemia. When the balance between supply and demand of coronary vessels is broken, ischemia occurs. Our study proposed a cut-off value for the regional VR/MR, reflecting a balance between the supply and demand of coronary circulation. The balance between supply and demand of coronary blood flow is a continuum, and there is no fixed ischemic threshold. The method described in this report is intended to provide a reference for the clinic. When VR/MR is greater than the ischemia threshold, the patient may not experience myocardial ischemia. When VR/MR falls below this threshold, ischemia may occur. The vessel-specific VR/MR links the supply and demand of coronary circulation and can reasonably reflect the ischemia due to coronary stenosis.
The results of our study should be read in the context of certain limitations. We used FFR as the gold standard to calculate VR/MR accuracy in predicting myocardial ischemia. Although FFR is the gold standard for clinical diagnosis of myocardial ischemia, it has been reported that FFR could be inconclusive, and FFR < 0.8 cannot be simply used as a predictor of myocardial ischemia. 28 This might have led to misclassification of myocardial ischemia cases and, subsequently, impacting VR/MR's accuracy in predicting myocardial ischemia. This study is a retrospective study. Therefore, all VR/MR in this study were from patients with coronary heart disease, without any standard VR/M. This might have affected our estimated cut-off value for VR/MR. Our method of calculating the regional myocardial mass was based on the diameter of the blood vessel using the allometric law. However, we cannot rule out other methods that could be more accurate in calculating the regional myocardial mass, improving VR/MR accuracy in predicting myocardial ischemia.
Conclusions
Different coronary artery stenosis areas in the same patient have different VR/MR values. VR/MR has a higher accuracy rate in predicting myocardial ischemia. VR/MR is an indicator that reflects the relationship between the blood supply of coronary artery stenosis and its corresponding myocardial demand. Nevertheless, in partial, not total, coronary artery occlusion, blood flow at rest might meet the myocardial oxygen demand, which may not be the case during exercise. Consequently, our conclusions may only be valid at resting myocardial demand.
Footnotes
AUTHORS’ CONTRIBUTIONS: All authors were fully involved in the study. LJC designed the research approach, carried out the clinical statistics, analyzed results, and wrote the article. LB, MJL, and WX collected clinical data. ZLY and MBY revised the manuscript. LYJ was responsible for supervision.
The author(s) declared no potential conflicts of interest with respect to the research, authorship, and/or publication of this article.
ETHICAL APPROVAL: The research content in the manuscript passed the review of the ethics committee, Institutional review boards of each center approved the study protocol, and each patient signed informed consent. Biomechanics Laboratory of Beijing University of Technology analyzed anonymized data independently.
FUNDING: The author(s) disclosed receipt of the following financial support for the research, authorship, and/or publication of this article: This study was supported by National Natural Science Foundation of China (11832003, 11772016, 11702008) and National Key R&D Program of China (2020YFC2004400) are greatly acknowledged.
ORCID iD: Youjun Liu https://orcid.org/0000-0002-1307-4696
References
- 1.Öztürk S, Ertong-Attar G, Başar D. Risk factors associated with cardiovascular diseases in Turkey: evidence from national health survey. Health Policy Technol 2019; 8:61–6 [Google Scholar]
- 2.Lo EWC, Menezes LJ, Torii R. On outflow boundary conditions for CT-based computation of FFR: examination using PET images. Med Eng Phys 2020; 76:79–87 [DOI] [PubMed] [Google Scholar]
- 3.Pijls NHJ, DeBruyne B, Peels K, VanderVoort PH, Bonnier H, Bartunek J, Koolen JJ. Measurement of fractional flow reserve to assess the functional severity of coronary-artery stenoses. N Engl J Med 1996; 334:1703–8 [DOI] [PubMed] [Google Scholar]
- 4.Kakouros N, Rybicki FJ, Mitsouras D, Miller JM. Coronary pressure-derived fractional flow reserve in the assessment of coronary artery stenoses. Eur Radiol 2013; 23:958–67 [DOI] [PubMed] [Google Scholar]
- 5.Van De Hoef TP, Nolte F, Bax M, Damman P, Chamuleau SAJ, Voskuil M, Siebes M, Spaan JAE, Piek JJ, Meuwissen M. Diagnostic accuracy of combined intracoronary pressure and flow velocity information during baseline conditions: adenosine-free assessment of functional coronary lesion severity. Eur Heart J 2012; 33:499. [DOI] [PubMed] [Google Scholar]
- 6.Pijls NHJ, van Schaardenburgh P, Manoharan G, Boersma E, Bech JW, van't Veer M, Bar F, Hoorntje J, Koolen J, Wijns W, de Bruyne B. Percutaneous coronary intervention of functionally nonsignificant stenosis - 5-year follow-up of the DEFER study. J Am Coll Cardiol 2007; 49:2105–11 [DOI] [PubMed] [Google Scholar]
- 7.Tonino PAL, Fearon WF, De Bruyne B, Oldroyd KG, Leesar MA, Lee PNV, MacCarthy PA, van't Veer M, Pijls NHJ. Angiographic versus functional severity of coronary artery stenoses in the FAME study fractional flow reserve versus angiography in multivessel evaluation. J Am Coll Cardiol 2010; 55:2816–21 [DOI] [PubMed] [Google Scholar]
- 8.Kwasiborski PJ, Czerwinski W, Kowalczyk P, Buksinska-Lisik M, Horszczaruk G, Aboodi MS, Derbisz K, Hochul M, Janas A, Cwetsch A, Wasek W, Buszman PP, Bartunek J, Buszman PE, Serruys PW, Milewski K. Influence of heart rate on FFR measurements: an experimental and clinical validation study. Int J Cardiol 2020; 317:13–7 [DOI] [PubMed] [Google Scholar]
- 9.Gould KL, Johnson NP, Bateman TM, Beanlands RS, Bengel FM, Bober R, Camici PG, Cerqueira MD, Chow BJW, Di Carli MF, Dorbala S, Gewirtz H, Gropler RJ, Kaufmann PA, Knaapen P, Knuuti J, Merhige ME, Rentrop KP, Ruddy TD, Schelbert HR, Schindler TH, Schwaiger M, Sdringola S, Vitarello J, Williams KA, Gordon D, Dilsizian V, Narula J. Anatomic versus physiologic assessment of coronary artery disease. J Am Coll Cardiol 2013; 62:1639–53 [DOI] [PubMed] [Google Scholar]
- 10.Kim HY, Lim HS, Doh JH, Nam CW, Shin ES, Koo BK, Yoon MH, Tahk SJ, Kang DK, Song YB, Hahn JY, Choi SH, Gwon HC, Lee SH, Kim EK, Kim SM, Choe Y, Choi JH. Physiological severity of coronary artery stenosis depends on the amount of myocardial mass subtended by the coronary artery. JACC-Cardiovasc Interv 2016; 9:1548–60 [DOI] [PubMed] [Google Scholar]
- 11.Taylor CA, Gaur S, Leipsic J, Achenbach S, Berman DS, Jensen JM, Dey D, Botker HE, Kim HJ, Khem S, Wilk A, Zarins CK, Bezerra H, Lesser J, Ko B, Narula J, Ahmadi A, Ovrehus KA, St Goar F, De Bruyne B, Norgaard BL. Effect of the ratio of coronary arterial lumen volume to left ventricle myocardial mass derived from coronary CT angiography on fractional flow reserve. J Cardiovasc Comput Tomogr 2017; 11:429–36 [DOI] [PubMed] [Google Scholar]
- 12.Han H, Bae YG, Hwang ST, Kim HY, Park I, Kim SM, Choe Y, Moon YJ, Choi JH. Computationally simulated fractional flow reserve from coronary computed tomography angiography based on fractional myocardial mass. Int J Cardiovasc Imaging 2019; 35:185–93 [DOI] [PubMed] [Google Scholar]
- 13.Bae YG, Hwang ST, Han H, Kim SM, Kim HY, Park I, Lee JM, Moon YJ, Choi JH. Non-invasive coronary physiology based on computational analysis of intracoronary transluminal attenuation gradient. Sci Rep 2018; 8:4692. [DOI] [PMC free article] [PubMed] [Google Scholar]
- 14.Van Horssen P, van den Wijngaard J, Brandt MJ, Hoefer IE, Spaan JAE, Siebes M. Perfusion territories subtended by penetrating coronary arteries increase in size and decrease in number toward the subendocardium. Am J Physiol Heart Circ Physiol 2014; 306:H496–H504 [DOI] [PubMed] [Google Scholar]
- 15.Kang SJ, Kim YH, Lee JG, Kang DY, Lee PH, Ahn JM, Park DW, Lee SW, Lee CW, Park SW, Park SJ, Koo HJ, Yun SC, Jung J, Kim N, Kweon J, Kang JW, Lim TH, Yang DH. Impact of subtended myocardial mass assessed by coronary computed tomographic angiography-based myocardial segmentation. Am J Cardiol 2019; 123:757–63 [DOI] [PubMed] [Google Scholar]
- 16.Zakkaroff C, Biglands JD, Greenwood JP, Plein S, Boyle RD, Radjenovic A, Magee DR. Patient-specific coronary blood supply territories for quantitative perfusion analysis. Comput Methods Biomech Biomed Eng Imaging Vis 2018; 6:137–54 [DOI] [PMC free article] [PubMed] [Google Scholar]
- 17.Kobayashi K, Wakasa S, Sato K, Kanai S, Date H, Kimura S, Oyama-Manabe N, Matsui Y. Quantitative analysis of regional endocardial geometry dynamics from 4D cardiac CT images: endocardial tracking based on the iterative closest point with an integrated scale estimation. Phys Med Biol 2019; 64:055009. [DOI] [PubMed] [Google Scholar]
- 18.Kang SJ, Kweon J, Yang DH, Lee JG, Jung J, Kim N, Mintz GS, Kang JW, Lim TH, Park SW, Kim YH. Mathematically derived criteria for detecting functionally significant stenoses using coronary computed tomographic angiography-based myocardial segmentation and intravascular ultrasound-measured minimal lumen area. Am J Cardiol 2016; 118:170–6 [DOI] [PubMed] [Google Scholar]
- 19.Yang DH, Kang SL, Koo HJ, Kweon J, Kang JW, Lim TH, Jung J, Kim N, Lee JG, Han S, Ahn JM, Park DW, Lee SW, Lee CW, Park SW, Park SJ, Mintz GS, Kim YH. Incremental value of subtended myocardial mass for identifying FFR-verified ischemia using quantitative CT angiography comparison with quantitative coronary angiography and CT-FFR. JACC-Cardiovasc Imag 2019; 12:707–17 [DOI] [PubMed] [Google Scholar]
- 20.Sankaran S, Kim HJ, Choi G, Taylor CA. Uncertainty quantification in coronary blood flow simulations: impact of geometry, boundary conditions and blood viscosity. J Biomech 2016; 49:2540–7 [DOI] [PubMed] [Google Scholar]
- 21.Choy JS, Kassab GS. Scaling of myocardial mass to flow and morphometry of coronary arteries. J Appl Physiol (1985) 2008; 104:1281–6 [DOI] [PMC free article] [PubMed] [Google Scholar]
- 22.Graham MM, Faris PD, Ghali WA, Galbraith PD, Norris CM, Badry JT, Mitchell LB, Curtis MJ, Knudtson ML, APPROACH Investigators. Validation of three myocardial jeopardy scores in a population-based cardiac catheterization cohort. Am Heart J 2001; 142:254–61 [DOI] [PubMed] [Google Scholar]
- 23.West GB, Brown JH, Enquist BJ. A general model for the origin of allometric scaling laws in biology. Science 1997; 276:122–6 [DOI] [PubMed] [Google Scholar]
- 24.Upton RN. Organ weights and blood flows of sheep and pig for physiological pharmacokinetic modelling. J Pharmacol Toxicol Methods 2008; 58:198–205 [DOI] [PubMed] [Google Scholar]
- 25.Kim HY, Doh JH, Lim HS, Nam CW, Shin ES, Koo BK, Lee JM, Park TK, Yang JH, Bin Song Y, Hahn JY, Choi SH, Gwon HC, Lee SH, Kim SM, Choe Y, Choi JH. Identification of coronary artery side branch supplying myocardial mass that may benefit from revascularization. JACC-Cardiovasc Interv 2017; 10:571–81 [DOI] [PubMed] [Google Scholar]
- 26.Seiler C. The human coronary collateral circulation. Eur J Clin Invest 2010; 40:465–76 [DOI] [PubMed] [Google Scholar]
- 27.Fujita M, Tambara K. Recent insights into human coronary collateral development. Heart 2004; 90:246–50 [DOI] [PMC free article] [PubMed] [Google Scholar]
- 28.Ahn JM, Park DW, Shin ES, Koo BK, Nam CW, Doh JH, Kim JH, Chae IH, Yoon JH, Her SH, Seung KB, Chung WY, Yoo SY, Lee JB, Choi SW, Park K, Hong TJ, Lee SY, Han M, Lee PH, Kang SJ, Lee SW, Kim YH, Lee CW, Park SW, Park SJ, IRIS-FFR Investigators. Fractional flow reserve and cardiac events in coronary artery disease data from a prospective IRIS-FFR registry (Interventional Cardiology Research Incooperation Society Fractional Flow Reserve). Circulation 2017; 135:2241. [DOI] [PubMed] [Google Scholar]


