

Abstract
Oncogenic reprogramming of cellular metabolism is a hallmark of many cancers, but our mechanistic understanding of how such dysregulation is linked to tumor behavior remains poor. In this study, we have identified dihydroceramide desaturase (DES1)—which catalyzes the last step in de novo sphingolipid synthesis—as necessary for the acquisition of anchorage-independent survival (AIS), a key cancer enabling biology, and establish DES1 as a downstream effector of HER2-driven glucose uptake and metabolism. We further show that DES1 is sufficient to drive AIS and in vitro tumorigenicity and that increased DES1 levels—found in a third of HER2+ breast cancers—are associated with worse survival outcomes. Taken together, our findings reveal a novel pro-tumor role for DES1 as a transducer of HER2-driven glucose metabolic signals and provide evidence that targeting DES1 is an effective approach for overcoming AIS. Results further suggest that DES1 may have utility as a biomarker of aggressive and metastasis-prone HER2+ breast cancer.
Keywords: breast cancer, cell survival, metastasis, oncogene, sphingolipid
1 |. INTRODUCTION
The deregulation of cellular metabolic pathways in cancer is well-established and is now appreciated as a hallmark of cancer but there remains considerable uncertainty as to how dysregulated metabolism impacts cancer-associated phenotypes. Anchorage-independent survival (AIS)—the ability of cells to evade death following detachment from the extracellular matrix (ECM)—is key for tumorigenesis and is essential for metastasis as it allows cancer cells to survive outside their normal tissue environments. ECM detachment activates many types of cell death including anoikis,1,2 autophagy,3,4 and mitophagy5 among others. ECM detachment also leads to alterations in cell metabolism reflected in decreased glucose uptake, lower flux through glycolysis and the pentose phosphate pathway, increased reactive oxygen species, and a reduction in ATP production.6,7 Thus, in addition to negating multiple cell death pathways, oncogenic driving of glucose uptake and reprogramming of metabolic pathways is also necessary for full AIS. Given its central role in cancer development and progression, targeting AIS has emerged as an approach of interest. Consequently, a better understanding of the interplay between oncogenes, metabolic pathways, and AIS could define new avenues for therapeutic intervention.
Sphingolipids (SLs), including ceramide (Cer) and dihydroceramide (dhCer), are a family of lipids, controlled by an interlinked metabolic network of enzymes. Deregulation of SL metabolism has been observed in multiple cancers,8–14 leading to speculation that an altered balance of SLs contributes to tumorigenesis and increasing interest in modulating SL levels for cancer therapeutics. Many SLs are bioactive and, although linked to various cellular processes (reviewed in Ref. [15,16]), they have classically been implicated as mediators of cell death and survival.17 Accumulation of Cer and other pro-apoptotic SLs occurs in response to diverse stress stimuli including cytokines,18–20 nutrient stress,21,22 ionizing radiation,23 and chemotherapies24–28 while addition of exogenous Cer and other SLs induces cell death.17,23,28–31 Functionally, the neutralization of pro-apoptotic SLs through altered production or breakdown leads to defective cell death responses and represents a metabolic mechanism of treatment resistance for numerous chemotherapies.32–36 Despite this, the possible deregulation of SL metabolism as a metabolism mechanism of AIS has not been investigated.
Here, we have investigated connections between oncogenic HER2, glucose metabolism, and the SL network in promoting AIS in BC. We identify dihydroceramide desaturase (DES1)—the last enzyme in de novo SL synthesis—as a key node that translates oncogene-induced glucose uptake and metabolism into the acquisition of AIS. These findings provide key insight into how dysregulation of metabolic pathways promotes acquisition of a key oncogenic phenotype and establishes DES1 as a novel target of interest for overcoming AIS in the treatment of metastatic BC.
2 |. MATERIALS AND METHODS
2.1 |. Cell lines
MCF10A (CRL-10317), SKBR3 (HTB-30), HCC1954 (CRL-2338), and HCC1419 (CRL-2326) cells were obtained from ATCC (Manassas, Virginia, USA) and authenticated by STR profiling. Primary HMEC cells (#830–5A) were purchased from Millipore Sigma (St Louis, Missouri). SKBR3 cells were cultured in F12/DMEM (#10–090-CV) from Corning (Corning, NY) supplemented with 10% heat-inactivated fetal bovine serum (FBS). HCC1954 and HCC1419 were cultured in RPMI with 10% FBS. MCF10A cells were cultured in F12/DMEM supplemented with 5% horse serum, hydrocortisone (0.5 μg/ml), insulin (10 μg/ml), cholera toxin (100 ng/ml), and epidermal growth factor (EGF) (20 ng/ml) as described previously.2,6 Primary mammary epithelial cells (#830–5A) were obtained from Millipore Sigma and cultured using the MEGM Bulletkit (#CC-3150) from Lonza (Morristown, NJ). HCC1954 and HCC1419 cells were cultured in RPMI (#10–040-CV, Corning) supplemented with 10% FBS. Cells were incubated in a humidified atmosphere at 37C, 5% CO2 and were confirmed to be mycoplasma free every other month using the MycoAlert Kit from Lonza. FBS (#SH30396) was from Cytivia (formerly Hyclone; Marlborough, MA) and heat inactivated at 56C for 30 min. Horse serum (#16050–122) was from Life Technologies (Carlsbad, CA). Hydrocortisone (#H-0888), cholera toxin (#C-8052), and insulin (I-1882) were all from Millipore Sigma. EGF (#AF-100–015) was from Peprotech (Rocky Hill, NJ).
2.2 |. Reagents
Standard laboratory reagents were from Millipore Sigma or Fisher Scientific. Drugs used were: SKi-II, 4HPR, MG132, Bortezomib, Lapatinib, LY294002, Wortmannin, PD98059, U0126, WZB117, BAY876, 2-DG, 3-BP. Antibodies for EGFR, p-ERK (T202/Y204), ERK, Bim-EL, p-Akt (S473), Akt, HER2, Cleaved PARP, and GAPDH were from Cell Signaling; DES1/MLD was from Abcam; V5 was from Life Technologies; Actin and Laminin were from Millipore Sigma.
2.3 |. Plasmids
pCMV-VSV-G (Addgene #8454) and pCMV-dR8.2 dvpr (Addgene #8455) were gifts from Bob Weinberg. pENTR4-V5 (Addgene #17425), pLenti CMV/TO Puro Empty (Addgene #17482), pLenti CMV/TO Puro DEST (Addgene #17293), and pLenti CMV Blast DEST (Addgene #17451) were gifts from Eric Campeau. The LentiCRISPR v2 plasmid was a gift from Feng Zhang (Addgene #52961). pBabe puro-ErbB2 (Addgene #40978) was a gift from Matthew Meyerson. The pLenti6.3-V5-lacZ plasmid was from Life Technologies. To generate constitutively active HER2 (NeuT), the HER2 cDNA was first subcloned into pENTR-V5 with Sal1 and Xho1 and a point mutation of V659E was introduced using the QuikChange site-directed mutagenesis Kit (#200519–5) from Agilent (Santa Clara, CA). The NeuT cDNA was introduced into pLenti CMV/TO Puro DEST by a recombinase reaction with LR Clonase II (Life Technologies) according to manufacturer instructions. For Crispr-mediated knockout, guide RNAs targeting human DES1 gene (termed DEGS1) were designed with ChopChop (http://chopchop.cbu.uib.no/). Sequences were chosen that would effectively knockout all three reported DES1 transcripts (NM_003676, NM_001321541, NM_001321542). Designed gRNAs were cloned into the Lenticrispr v2.0 plasmid using the methods of Sanjana and colleagues as described previously.37,38 To generate plasmids for DES1 and DES2 overexpression, cDNA ORF clones for human DES1 (#OHu27921) and DES2 (#OHu03058) in pCDNA3.1+/C-(K)DYK were purchased from Genscript (Piscatawny, NJ) and cloned into pENTR-V5 using R1 and Xho1. As above, cDNAs were introduced into pLenti-CMV-Blast DEST using a recombinase reaction with LR Clonase II. All plasmids generated were sequenced prior to use.
2.4 |. Cell culture, siRNA transfection, and harvesting
SKBR3 cells were cultured in F12/DMEM (#10–090-CV) supplemented with 10% heat inactivated FBS and were passaged at 1:8 every 5–6 days. MCF10A cells were cultured in F12/DMEM supplemented with 5% horse serum, hydrocortisone (0.5 μg/ml), insulin (10 μg/ml), cholera toxin (100 ng/ml), and EGF (20 ng/ml) as described previously2 and were passaged at 1:10 every 3–4 days. Primary HMEC cells were cultured using the MEGM Bulletkit (#CC-3150) from Lonza and were passaged up to 3 times. HCC1954 and HCC1419 were cultured in RPMI with 10% FBS and were passaged at 1:8 every 5–6 days. For experiments comparing cells in ECM attached and -detached conditions, cells were cultured in standard tissue culture dishes/trays for attached (Att) and in ultra-low attachment dishes/trays (Corning) for detached conditions (Susp). When inhibitors were used, cells were plated directly into media containing either inhibitor or vehicle (0.1% DMSO). For siRNA treatment, cells were reverse transfected in 60 mm dishes (300 K) and 100 mm dishes (800 K) with 20 nM target siRNA or AllStars negative control siRNA (#1027281) from Qiagen (Hilden, Germany) using Lipofectamine RNAiMAx (#13778–150; Life Technologies) according to manufacturer’s protocol. Information on the siRNA used is shown above. For siRNA experiments requiring culture in suspension, cells were siRNA treated in the monolayer for 48 h before plating in suspension. For harvesting, monolayer cells were washed in cold 1x PBS and scraped directly in PBS or lysis buffer (radioimmunoprecipitation [RIPA] for protein, RNA lysis buffer for RNA, extraction solvent for lipids). Suspension cultures were pelleted by centrifugation (3000 rpm, 5 m, 4C), washed in 1 ml cold PBS, and centrifuged again. Pellets were resuspended in lysis buffer according to the analysis being performed.
2.5 |. Generation of stable cell lines using lentivirus
To generate lentiviral particles, 1.5 μg of target plasmids were co-transfected with 1.5 μg of VSV-G and 1.5 μg of dVPR into 293 T cells (2500 K per 100 mm dish) using Xtremegene 9 (#636578701) from Roche (Basel, Switzerland) in opti-MEM (GIBCO, Life Technologies) according to manufacturer’s protocol. After 24 h, the medium was changed and, 24 h later, an additional 2–3 ml of media was added. At 72 h after transfection, virus-containing media were harvested, filtered (Millipore 0.45 mM PVDF), and divided into 1-ml aliquots for storage at −80C. For infection of MCF10A cells (100 K, 6-well trays), 1 ml of viral supernatant was added to 1 ml growth media containing polybrene (#TR-1003-G; Millipore Sigma) at 8 μg/ml. After 24 h, media was changed and after an additional 24 h, cells were split into 100 mm dishes in media containing puromycin (1–2 μg/ml) or blasticidin (10–20 μg/ml) as appropriate. Antibiotics were purchased from InVivogen (San Diego, CA). After 7 days, selection pressure was removed, and cells were cultured in normal growth medium. For generation of cells with double expression of NeuT and DES1, isogenic 10A-NeuT and empty vector controls (selected using puromycin) were infected with V5-LacZ or V5-DES1 as above and further selected using blasticidin. In all cases, uninfected cells were cultured in parallel and treated with the appropriate drug for selection to confirm efficacy of antibiotic and viral infection. Typically, all uninfected cells were dead within 48–72 h after initiation of selection.
2.6 |. Analysis of cell death by trypan blue exclusion
Cells in monolayer (Attached) were harvested by trypsinization, reactions stopped by addition of equal volume of culture media, and pelleted by centrifugation (1000 rpm, 5 min). Cells cultured in ECM-detached conditions (Suspension) were harvested from trays and pelleted by centrifugation (1000 rpm, 5 min). Cell pellets were vigorously resuspended in 2 ml trypsin–EDTA and left at room temperature for 1–2 min to dissociate cell clumps and produce a single cell suspension. Reactions were stopped with 2 ml of complete media, and dissociated cells were pelleted by centrifugation. At this point, cell pellets from monolayer and suspension were vigorously resuspended in 1 ml of growth media. 20 μl of cell suspension was combined with 20 μl 0.4% trypan blue solution (#15250–061, GIBCO, Life Technologies) for 30–45 s and 10 μl of the mix was used for cell counting by hemocytometer. Cells that showed no presence of dye (trypan blue negative) were counted as living. Cells with showing presence of dye in the interior (trypan blue positive) were counted as dead. Data are expressed as % trypan blue positive cells of total cells counted.
2.7 |. Western blot analysis
To prepare protein lysates, harvested cells were resuspended in 150 μl RIPA buffer (50 mM Tris, 150 mM NaCl, 1% Triton X-100, 0.5%, 0.1% sodium dodecyl sul-fate) supplemented with protease inhibitor cocktail (#P-8340, Millipore Sigma) and phosphatase inhibitor cocktails 2 and 3 (#P5726 and #P0044, Millipore Sigma). Following tip sonication on ice for 2 × 10 s bursts, protein concentration was determined by Bradford assay with Biorad reagent (#50000006) from Biorad (Hercules, CA) and samples were combined with 2x Laemelli buffer (#1610737, Biorad) containing 5% β-mercaptoethanol (#M6250, Millipore Sigma). Equal protein amounts (10–20 μg) were separated by 4%–20% SDS-PAGE and transferred to nitrocellulose membrane by wet transfer using standard immunoblotting protocols. Membranes were blocked (5% milk in 0.1% tween PBS) and probed with antibodies (various concentrations in 2% bovine serum albumin in 0.1% tween PBS) overnight at 4C. For developing, membranes were washed (3 × 10 min, 0.1% Tween PBS), incubated at room temperature for 1 h in HRP-Conjugated Secondary antibody (1:5000, 2% bovine serum albumin in 0.1% tween PBS; Jackson Laboratories), washed (3 × 10 min, 0.1% Tween PBS), and developed by enhanced chemiluminescence (#32109) from ThermoFisher Scientific (Waltham, MA). Information on the primary antibodies used is shown above.
2.8 |. Analysis of cellular sphingolipids
Lipids were extracted by the addition of 2 ml 2:3 70% Isopropanol: Ethyl Acetate. Samples were processed and analyzed by tandem liquid chromatography/mass spectrometry (LC/MS) at the Stony Brook Lipidomics Core as described previously.39 Cellular SL levels were normalized to total lipid phosphate levels, analyzed as described previously.39
2.9 |. d17-dhSph flux assay
Analysis of flux through DES using d17-dhSph labelling was carried out as described previously.40,41 Briefly, cells were cultured in Att or Susp conditions for 23 h as shown. Within the last hour of culture, 500 nM of d17-dhSph (from a 10 mM stock in ethanol) was added for the time points shown (0, 20, 30, 45, 60 min) in a reverse time course. At the end of labelling (24 h of total culture time), cells were harvested and lipids extracted. Analysis of d17-Cer levels was by tandem LC/MS at the Stony Brook Lipidomics Core and levels were normalized to total lipid phosphate levels.
2.10 |. In situ assay to measure DES activity
Measurement of situ DES activity was performed as described previously.42,43 Briefly, cells were cultured as desired and 1 h prior to harvesting, 500 nM of C12-dhCCPS substrate was added. Lipids were extracted from harvested cells by addition of 2 ml 70% isopropanol: ethyl acetate. For analysis, lipids were further extracted as above using 10 μl of C12-dihydroceramide (#860635) from Avanti (Alabaster, AL) as internal standard. Levels of C12-dhCCPS and its product (C12-CPPS) were determined by LC/MS. DES activity was calculated as the ratio of detected product to detected substrate.
2.11 |. Quantitative reverse transcriptase PCR
Total RNA was extracted using the Purelink RNA kit (#12183–020, Life Technologies) according to manufacturer’s protocol. RNA concentration was verified by nanodrop and 0.5–1 μg of RNA was transformed into cDNA using the Superscript III supermix kit for real-time PCR (#11752–250; Life Technologies) according to manufacturer’s protocol. Converted cDNA was diluted 15-fold in molecular biology water. For qRT-PCR, reactions were run in triplicate in 96 well plates (VWR #93001–100) with each reaction containing 10 μl of 2X iTAQ universal probes mastermix (#172–5134, Biorad), 5 μl of cDNA, 1 μl of Taqman primer-probe (Life Technologies) and 4 μl of molecular biology water. Information on the probes used is shown above.
2.12 |. Colony formation in soft agar
This was performed as described previously6 with minor modifications. Briefly, a lower layer of 0.8% agar was created by mixing 2× media and supplements with an equal volume of sterile 1.6% agar in dH2O. Once lower layers had solidified, cells were plated in an upper layer of 0.4% agar (30 K for SKBR3; 10 K for 10A-NeuT). For this, appropriate cell numbers were added to 2× media and mixed with an equal volume of 0.8% agar. Once solidified, trays were incubated for 2–3 weeks at 37°C as detailed. 200 ml of normal growth media was added to the top of each well every 3–4 days to ensure they did not dry out. Once experiments had been completed, cells were stained overnight with nitrotetrazolium blue chloride (#N6876, Millipore Sigma). Images of 5–6 fields per condition were taken at 4× and 10× magnification with an EVOS microscope for each replicate, and number of visible colonies were counted. For inhibitor experiments, the appropriate 2× volume of inhibitor was added to cells and 2× media prior to mixing with 0.8% agar.
2.13 |. 3D culture assay and immunofluorescence
Formation of mammary acini by 3D culture was performed as described previously.2,6 Briefly, 8-well glass chamber slides were coated with 50 μl of growth factor reduced matrigel (#354230, Corning), which was allowed to solidify for 30 m at 37C. Cells were resuspended in assay media (F12/DMEM containing additives above minus EGF) at a concentration of 25 K/ml and combined with an equal volume of assay media with 4% matrigel and 10 ng/ml EGF. 4–500 μl of the mix (final concentration of 12.5 K cells/ml, 2% matrigel, 5 ng/ml EGF) was plated in each well. Cultures were fed every 4d with assay media containing 5 ng/ml EGF and 2% matrigel. At the desired time point, cultures were fixed with 2% formalin for 20 min at room temperature and permeablized with 0.5% Triton X-100 for 10 min at 4C. Following 3 × washes (PBS-Glycine, 10 min, room temp), acini were blocked with 10% goat serum for 1 h at room temp. Acini were stained with anti-laminin antibody (1:200) overnight at 4C. The next day, culture were washed (3 times, 20 min, room temp), stained with fluorescent secondary antibody (1 h, room temp, in the dark), and washed again (3 times, 20 min, room temp). Nuclei were stained with DAPI solution (1 mg/ml in PBS) for 20 min and washed twice with PBS. Images were captured on a Leica DMI6000 microscope.
2.14 |. Measurement of caspase 3/7 activity
Analysis of caspase 3/7 activity was performed using the fluorimetric kit (K105) from Biovision Inc according to manufacturer instructions. 25–50 μg protein from harvested cell lysates was used in assays and, following measurement of fluorescence, values were normalized to mg protein.
2.15 |. Statistical analysis
Data were graphed using Graphpad Prism (v9.01) and are displayed as mean ± standard error of the mean unless otherwise noted. Analysis of two means was conducted with Student’s t-test, analysis of more than two means was performed by one-way ANOVA with appropriate post-test, and comparison of two variables was performed by two-way ANOVA with appropriate post-test. For all statistical tests, a p-value of less than .05 was considered sufficient to reject the null hypothesis.
3 |. RESULTS
3.1 |. Extracellular matrix detachment induces accumulation of pro-death sphingolipids in breast epithelial cells but not in HER2+ BC cells, in part through differential DES activity
To understand how SLs might impact AIS, it was first important to define key SL changes in non-tumorigenic breast epithelial cells (MCF10A) undergoing detachment-induced cell death compared with a HER2+ BC cell line (SKBR3) that exhibits AIS. Trypan blue exclusion confirmed loss of MCF10A cell viability following ECM -detachment while SKBR3 cells were protected (Figure 1A). This was associated with loss of EGF receptor (EGFR), decreased p-ERK, and induction of the BH3-only protein Bim-EL in MCF10A cells but not SKBR3 cells (Figure 1B) as has been shown previously.44 While Bim-EL levels in SKBR3 cells were basally high, this is likely due to high levels of anti-apoptotic Mcl-1.45 Lipidomic analysis at 24 h, prior to significant loss of cell viability (data not shown), revealed accumulation of Cer, dhCer, sphingosine (Sph), and dihydroSph (dhSph) in ECM-detached MCF10A cells (Figure 1C). Strikingly, in ECM-detached SKBR3 cells, there was a comparable accumulation of Cer, the classic pro-apoptotic SL, but dhCer, Sph and dhSph levels remained low. In both cell lines, ECM detachment had no effect on levels of S1P, the classic pro-survival lipid (Figure S1A). Analysis of complex SLs revealed that ECM detachment increased hexosylCer in MCF10A cells but not SKBR3 cells (Figure S1B) and increased lactosylCer in both cells (Figure S1C). In contrast, SM levels appeared to be unchanged in both cell lines (Figure S1D). It should be noted, however, that given the considerably larger mass of SM, while observed differences were not statistically different, it is possible that the slighter changes observed could nonetheless have some metabolic effects on levels of other lipids species. Importantly, analysis of primary mammary epithelial cells (HMEC) revealed similar lipid changes to MCF10A as well as loss of EGFR, loss of p-ERK, and Bim-EL induction (Figure S2).
FIGURE 1.
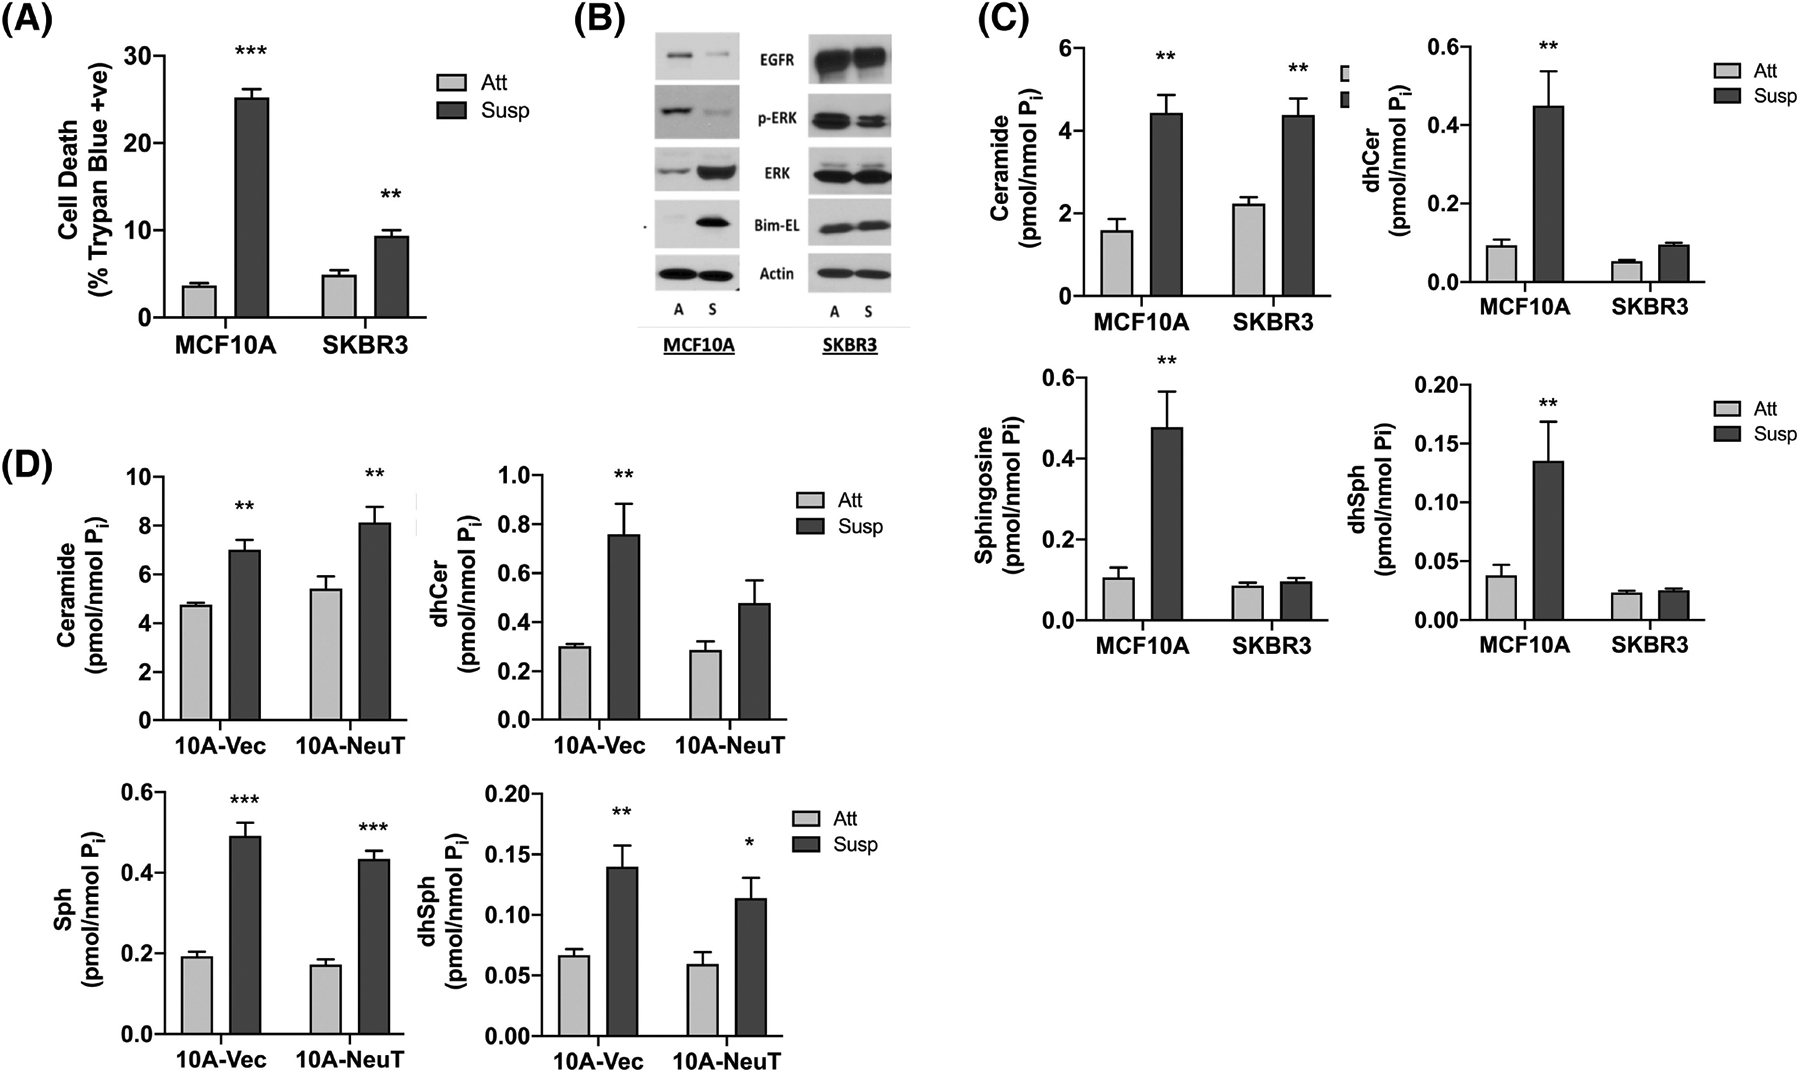
ECM detachment induces SL accumulation in breast epithelial cells but not in HER2+ BC cells, in part through differential DES activity. (A) MCF10A and SKBR3 cells were cultured in monolayer or suspension for 48 h. Cell death was determined by trypan blue exclusion assay. (B) MCF10A and SKBR3 cells were cultured in monolayer (A) or suspension (S) for 24 h. Whole cell lysates were analyzed by SDS-PAGE and western blot for the proteins shown with β-Actin as the loading control. (C) MCF10A and SKBR3 cells were cultured as in (B). Extracted lipids were analyzed by tandem LC/MS mass spectrometry and normalized to total lipid phosphate. (D) Isogenic 10A-Vec and 10A-NeuT cells were cultured as in (B) and analyzed as in (C). All data are representative of at least three independent experiments and reported as mean ± SEM (*p < .05, **p < .02, ***p < .01).
Although these results suggest that AIS is associated with SL dysregulation, as SKBR3 cells harbor other alterations beyond HER2 amplification, for example, mutant p53, it was unclear which specific changes are directly linked with oncogenic HER2. To address this in a cleaner HER2-driven system, lentivirus was used to generate MCF10A cells stably overexpressing V5-tagged NeuT—a constitutively active HER2 variant (HER2-V659E). Immunoblot analysis confirmed V5-NeuT expression (Figure S3A), which promoted colony formation in soft agar (Figure S3B) and epidermal growth factor (EGF)-independent growth (Figure S3C) compared with isogenic vector controls. Lipid analysis showed that ECM detachment of 10A-Vec cells led to increased Cer, dhCer, Sph, and dhSph as in WT MCF10A cells (Figure 1D). Similarly, ECM detachment of 10A-NeuT cells led to increased Cer as was seen in SKBR3 cells. However, ECM detachment of 10A-NeuT cells also caused accumulation of Sph and dhSph, whereas dhCer levels were not significantly increased. Indeed, this was the only SL of those analyzed that did not accumulate which suggests that HER2-driven AIS is associated with suppression of dhCer levels.
De novo SL synthesis (Figure 2A) typically begins with condensation of palmitate and serine to produce 3-ketosphinganine, which is sequentially metabolized to dhSph, dhCer, and Cer. The suppression of dhCer but not Cer in ECM-detached SKBR3 and 10A-NeuT cells focused our attention on dhCer desaturase (DES) as it can affect levels of both lipids.46 From our results, we hypothesized that flux through DES was higher in ECM-detached SKBR3 cells compared with MCF10A cells and assessed this by flux analysis with d17-dhSph labelling as described,40,41 focusing on the relevant labelling times for the DES ‘phase’ (20–60 min) and using d17-Cer levels as readout. Results revealed that ECM detachment led to a striking inhibition (approx. 60%) of d17-Cer production in MCF10A cells (Slope: 0.0246 nmol/min Att vs. 0.0098 nmol/min Susp) (Figure 2B, left panel). In contrast, d17-Cer production in SKBR3 cells was comparable in both ECM-attached and -detached conditions (Slope: 0.0502 nmol/min Att vs 0.0530 nmol/min Susp) (Figure 2B, right panel) suggesting a drop in de novo SL flux through DES in ECM-detached MCF10A but not SKBR3 cells. To consolidate this, DES activity was assessed by a previously developed in situ assay using a cell permeable substrate (C12-dhCPPS).42,43 Consistent with flux results, DES activity significantly decreased in ECM-detached MCF10A cells compared with monolayer (Figure 2C, left) with similar effects seen in primary HMEC cells (Figure S4A). In contrast, DES activity was maintained in ECM-detached SKBR3 cells compared with monolayer (Figure 2C, right). Analysis of other HER2+ breast cancer cells (HCC1419, HCC1954) confirmed higher DES activity in ECM-detached conditions compared with MCF10A (Figure S4B) although there was significant variability across the cell lines tested. Nonetheless, this suggests that the suppression of dhCer in ECM-detached HER2+ BC cells is a direct consequence of higher DES activity.
FIGURE 2.
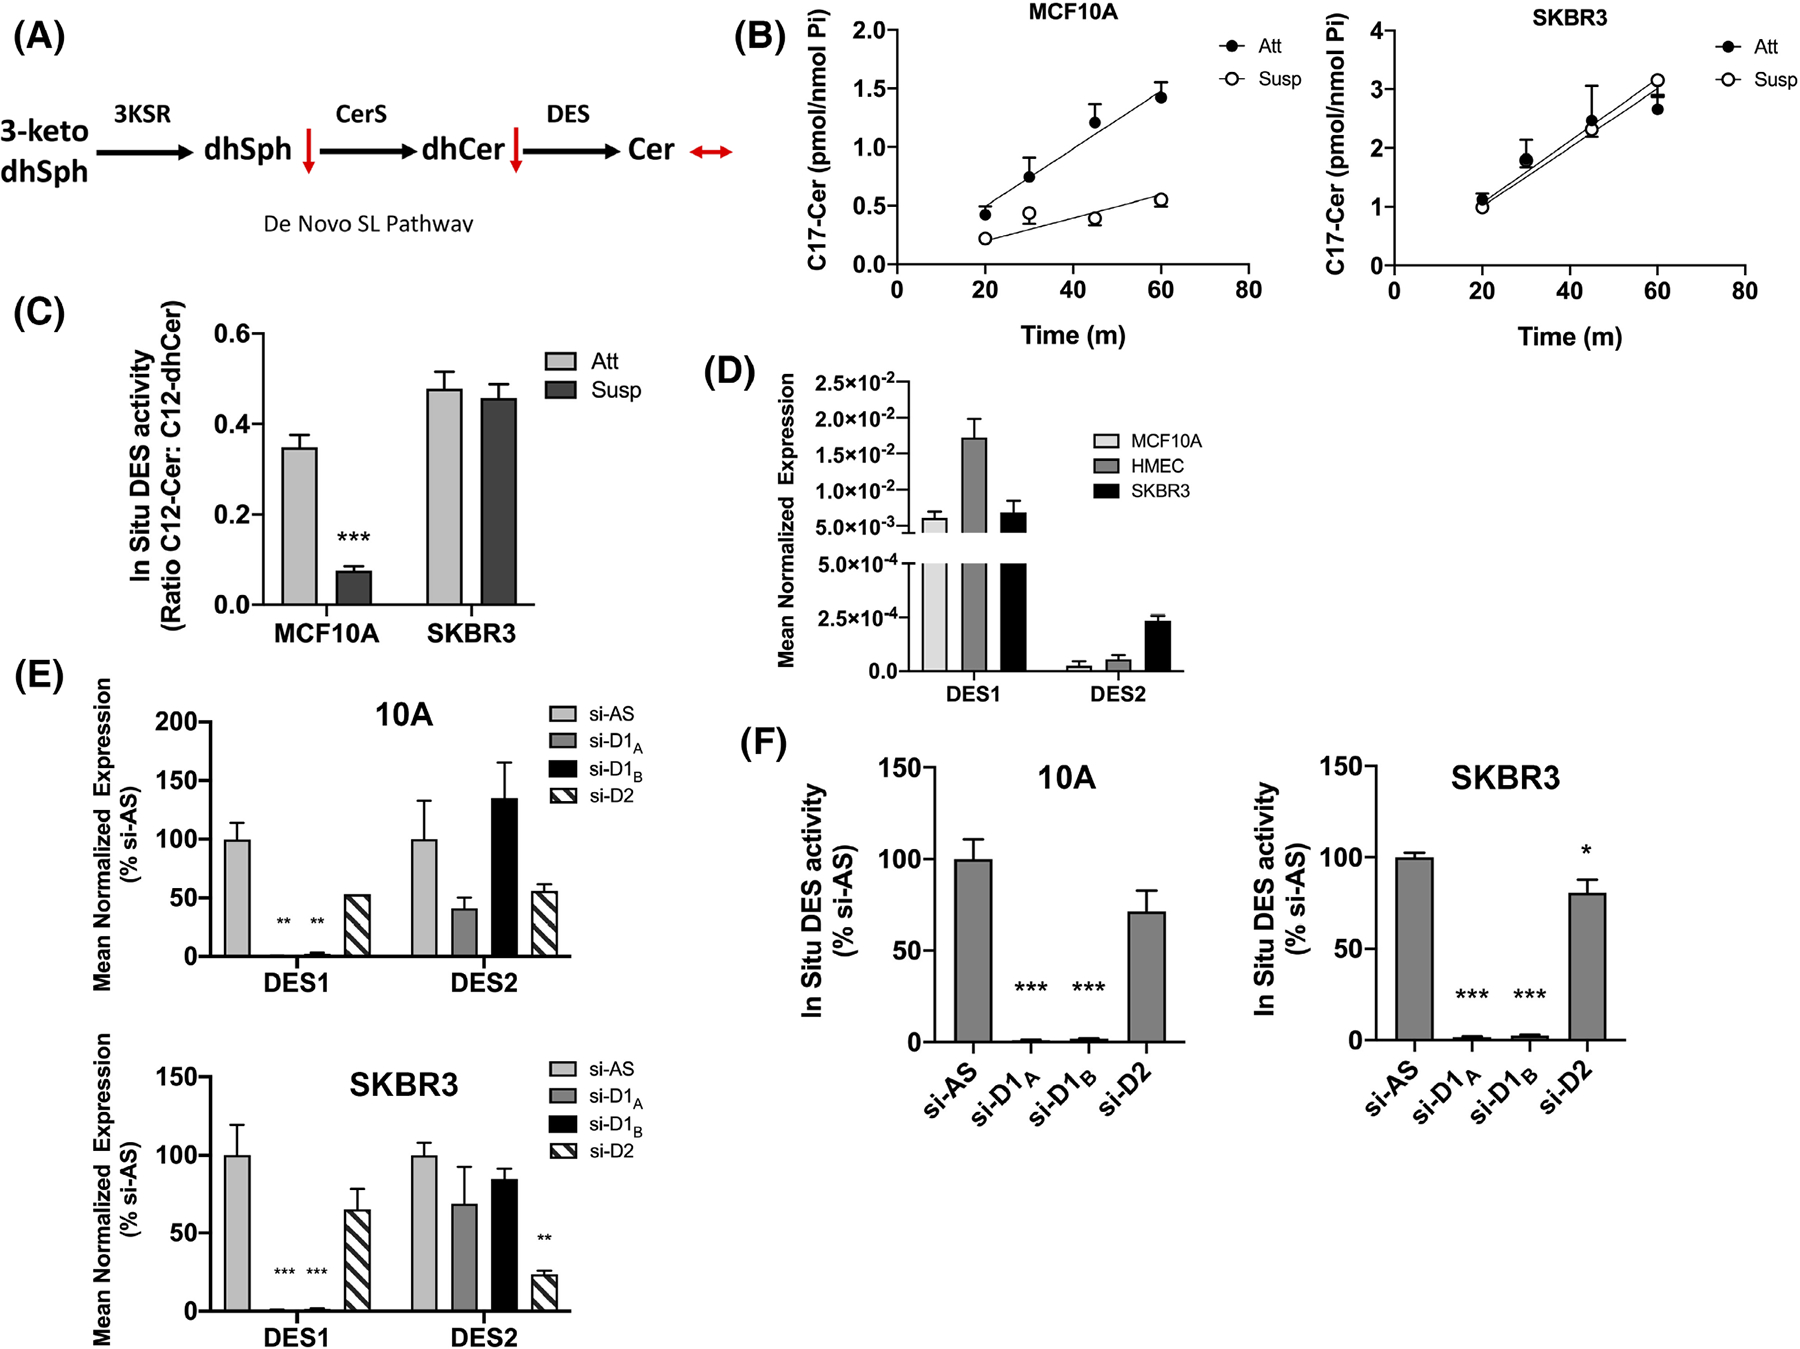
Deregulation of SL levels in ECM-detached HER2+ BC cells is in part through differential DES1 activity. (A) Schematic of the de novo SL pathway. (B) MCF10A (left) and SKBR3 (right) cells were cultured as in (B) and labeled with C17-dhSph for the indicated times. C17-Cer was extracted and analyzed as in (C). (C) MCF10A and SKBR3 cells were cultured as in (B). In situ DES activity was measured by addition of C12-dhPPS for 1 h. Extracted lipids were analyzed by tandem LC/MS. (D) MCF10A, HMEC, and SKBR3 were cultured for 48 h. DES1 and DES2 expression was measured by qRT-PCR using actin as a reference gene. (E) MCF10A and SKBR3 cells were treated with negative control (si-AS), DES1 (si-D1A, si-D1B) or DES2 (si-D2) for 48 h. DES1 and DES2 expression was measured as in (D). (F) MCF10A and SKBR3 cells were treated as in (E). In situ DES activity was analyzed as in (C). All data are representative of at least three independent experiments and reported as mean ± SEM (*p < .05, **p < .02, ***p < .01).
Currently, two known DES isoforms—DES1 and DES2—have been cloned. DES1 has ubiquitous expression while DES2 is more restricted, being highest in skin.47,48 From this, we speculated that DES1 is the primary isoform in breast epithelial and BC cells and supporting this, qRT-PCR revealed that DES1 had higher expression than DES2 in MCF10A (approx. 251-fold), HMEC (322-fold), and SKBR3 cells (29-fold) (Figure 2D). Nonetheless, as DES2 was elevated in SKBR3 cells over 10A and HMEC cells, it was important to determine the isoform primarily responsible for the observed in situ DES activity. DES1 knockdown with two distinct siRNA sequences robustly decreased DES1 expression in both MCF10A and SKBR3 cells with minimal effects on DES2 mRNA (Figure 2E). Similarly, DES2 knockdown led to robust downregulation of DES2 expression although with some effects on DES1 mRNA, albeit not to a statistically significant degree (Figure 2E). Analysis of DES activity showed that DES1knockdown led to almost complete loss of detectable in situ DES activity in both MCF10A and SKBR3 cells. In contrast, DES2 siRNA had minor effects (Figure 2F) although this could be due to the minor effects of DES2 siRNA on DES1 expression noted above. Nonetheless, taken together, these results confirm that DES1 is the primary DES isoform in breast epithelial and BC cells, and show that elevation of DES1 activity is associated with AIS in BC cells.
3.2 |. DES1 is required for anchorage-independent survival and colony formation but DES1 loss does not induce anoikis
The higher DES1 activity in SKBR3 cells prompted us to assess if DES1 was necessary for the AIS phenotype. For a pharmacological approach, 4HPR was used as it directly inhibits DES1 at lower concentrations (5 μM and less) than typically used.43 Indeed, 5 μM 4HPR almost completely inhibited in situ DES activity of SKBR3 cells (Figure 3A), increasing dhCer and decreasing Cer levels (Figure 3B). In SKBR3 cells, 4HPR had modest effects on cell viability in monolayer (11.4% 4HPR vs 4.8% Veh) but a robust effect in suspension (32.7% 4HPR vs 8.9% Veh; Figure 3C) with similar effects observed in two other HER2+ BC cell lines (HCC1954, HCC1419) (Figure S5A). Similar results in suspension were also observed with SKi-II (Figure S5B) which, although developed as an SK inhibitor, was found to inhibit DES1 activity49 and it was concluded that many effects attributed to SKi-II were due to inhibitory effects on DES1 rather than SK. Indeed, SKi-II treatment of SKBR3 cells inhibited DES activity (Figure S5C) and induced dhCer accumulation (Figure S5D). To confirm inhibitor data with more specific means, an siRNA approach was used. Knockdown of DES1 (Figure 3D) but not DES2 led to altered balance of dhCer and Cer (Figure 3E) confirming DES1 as the metabolically relevant isoform in these cells. Importantly, DES1 knockdown increased cell death in suspension (13.3% si-AS, 27.1% siD1A, 30.8% D1B) (Figure 3F) with minimal effects in monolayer (6.5% si-AS, 7.7% siD1A, 9.5% siD1B), while DES2 knockdown had no effect in either condition (7.9% siD2 Att, 15.5% siD2 Susp). To further substantiate siRNA results, Crispr/Cas9 technology was used to knockout DES1 in SKBR3 cells. Successful DES1 knockout was achieved with two distinct gRNAs (ΔD1A, ΔD1B) resulting in decreased in situ DES activity (Figure 3G, immunoblot inset), and altered balance in dhCer and Cer levels compared with control cells (Figure 3H). As with siRNA, DES1 knockout increased cell death in ECM-detached conditions (14.3% Vec, 27.3% ΔD1A, 28.4% ΔD1B) but with no effect in monolayer (5.1% Vec, 4.8% ΔD1A, 5.5% ΔD1B) (Figure 3I). Finally, to assess the biological consequences of overcoming AIS by DES1 inhibition, the effects of 4HPR and DES1 knockout on colony formation in soft agar were assessed. Results with both 4HPR (Figure 3J) and DES1 knockout (Figure 3K) showed that the effect of DES1 inhibition at overcoming AIS directly led to a reduction in colony forming ability of SKBR3 cells. Importantly, as colony forming ability is a widely used measure of in vitro tumorigenicity, this suggests that targeting DES1 might be effective at reducing cancer aggressiveness.
FIGURE 3.
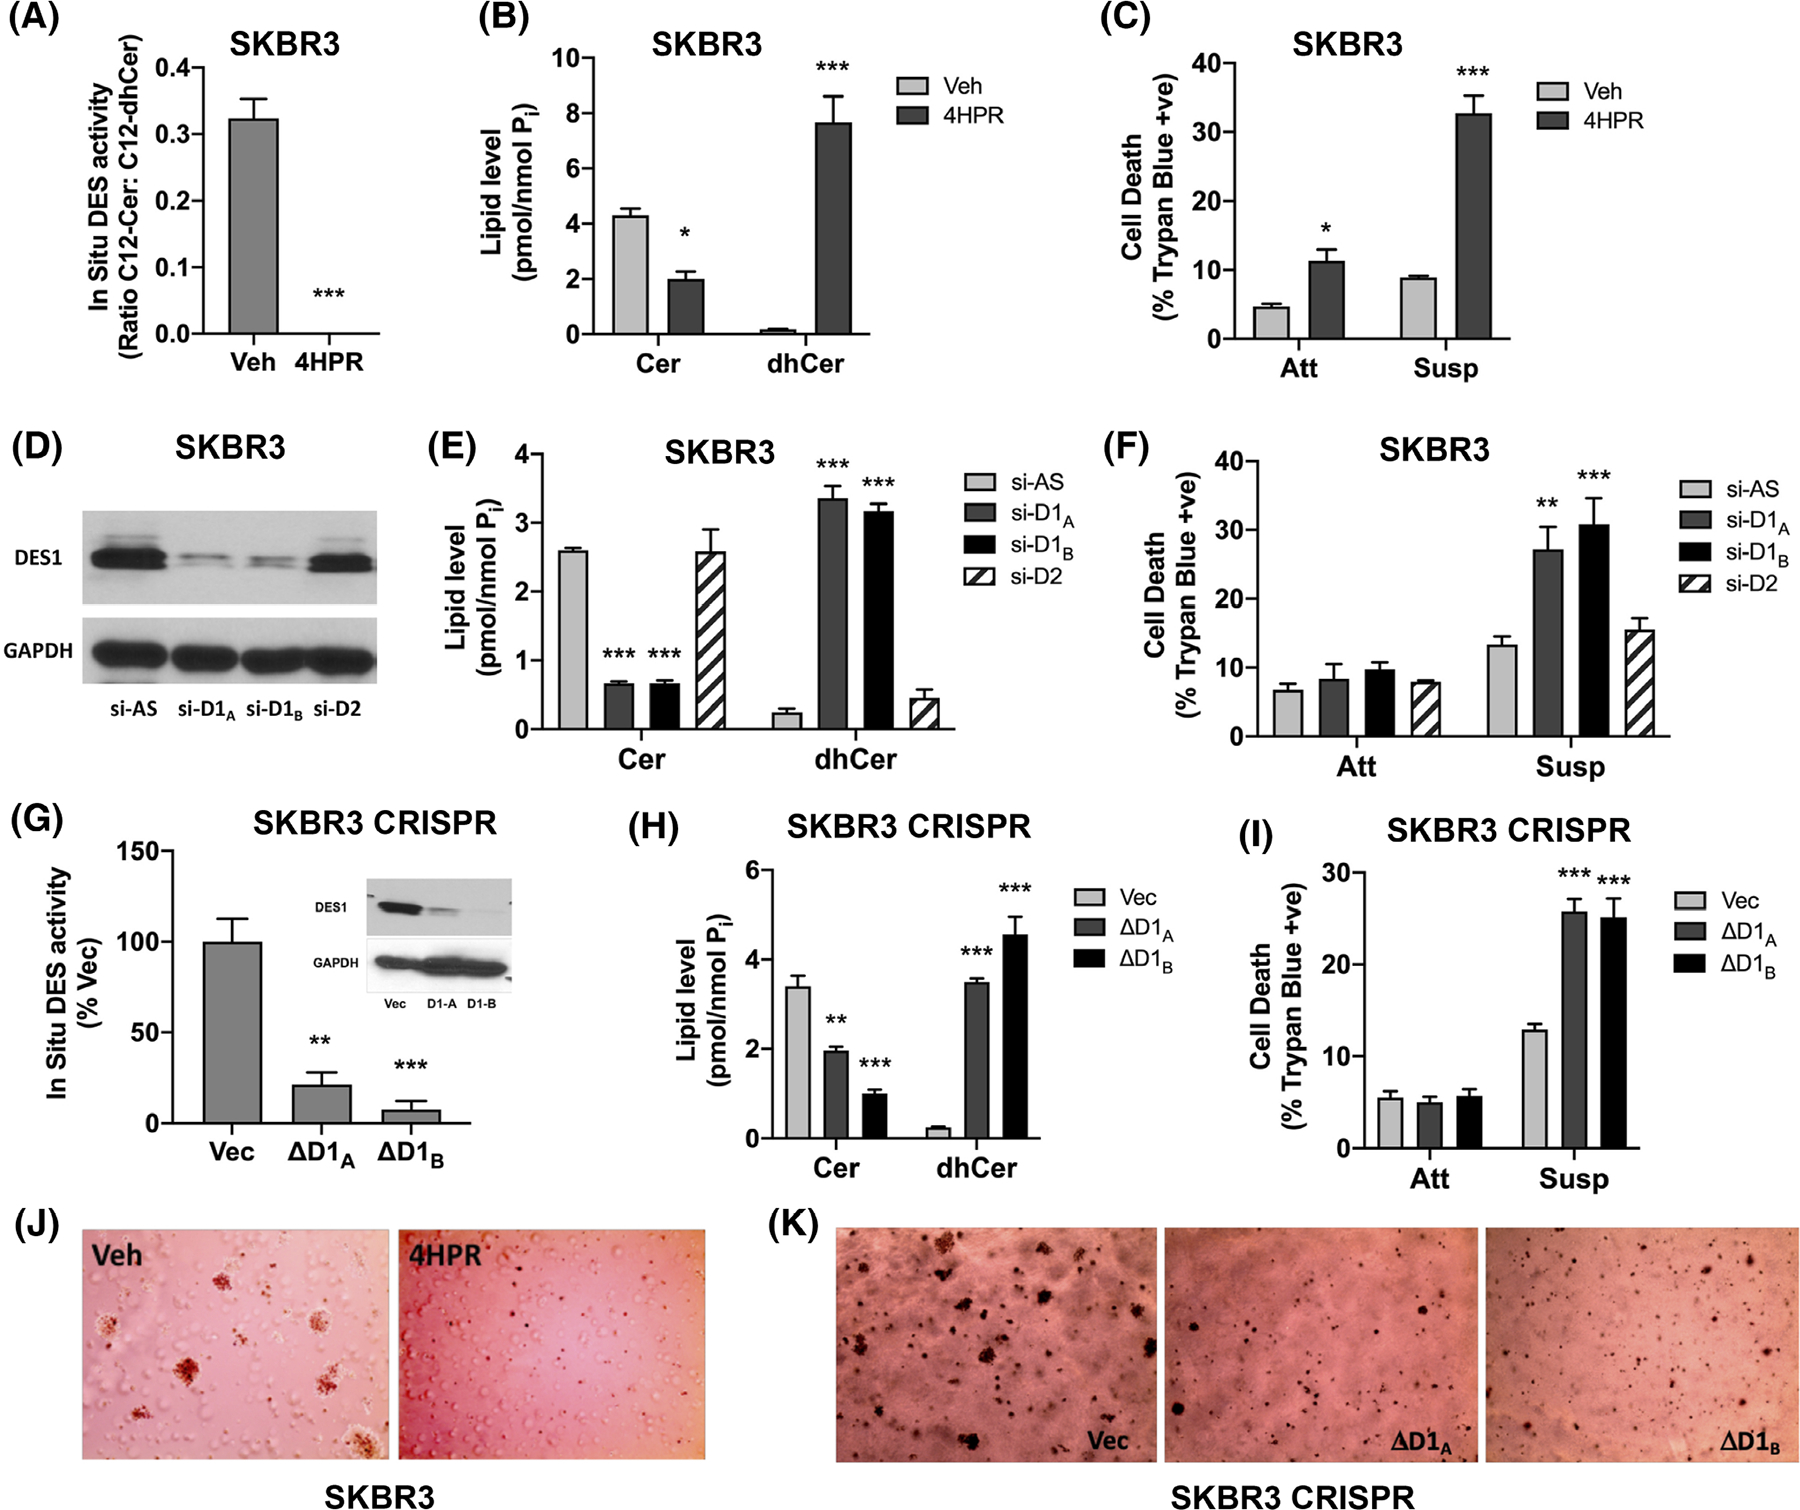
DES1 is required for in vitro AIS and colony formation. (A) SKBR3 cells were cultured in monolayer for 48 h with DMSO or 4HPR (5 μM). In situ DES activity was assessed using C12-dhPPS. (B) SKBR3 cells were cultured as in (A). Extracted lipids were analyzed by tandem LC/MS mass spectrometry and normalized to total lipid phosphate. (C) SKBR3 cells were cultured in monolayer (Att) and suspension (Susp) for 48 h with DMSO or 4HPR (5 μM). Cell death was determined by trypan blue exclusion assay. (D) SKBR3 cells were treated with negative control (si-AS), DES1 (si-D1A, si-D1B) or DES2 (si-D2) prior to culture in suspension for 48 h. DES1 levels were analyzed by SDS-PAGE and western blot with GAPDH as the loading control. (E) SKBR3 cells were cultured as in (D). Lipid levels were analyzed as in (B). (F) SKBR3 cells were treated with siRNA prior to culture in monolayer (Att) and suspension (Susp) for 48 h. Cell death was analyzed as in (C). (G) SKBR3 control (Vec) or DES1 Crispr cells (ΔD1A, ΔD1B) were plated in monolayer for 24 h and in situ DES activity measured as in (A). Inset—DES1 protein levels were analyzed as in (D). (H) SKBR3 Crispr cells were cultured and analyzed for lipids as in (B). (I) SKBR3 Crispr cells were cultured in monolayer (Att) and suspension (Susp) for 48 h. Cell death was analyzed as in (C). (J) SKBR3 cells were plated in soft agar with DMSO or 4HPR (5 μM) for 12–14d. Colonies were stained and visualized using an EVOS microscope. (K) SKBR3 Crispr cells were plated in soft agar for 12–14 days. Colonies were analyzed as in (J). All data are representative of at least three independent experiments and reported as mean ± SEM (*p < .05, **p < .02, ***p < .01).
ECM detachment of non-transformed cells leads to activation of multiple cell death pathways including classical apoptosis (termed anoikis in this context), autophagy, and mitophagy among others1–5 that must be suppressed by oncogenic pathways to acquire AIS. To begin to understand how DES1 regulates AIS, we assessed cleaved PARP and caspase 3/7 activity as readouts of classical anoikis. Results showed that siRNA of DES1 did not significantly increase either cleaved PARP (Figure 4A) nor caspase 3/7 activity (Figure 4B) in ECM-detached SKBR3 cells in contrast to HER2 siRNA as a positive control. Similarly, DES1 knockout had no significant effects on PARP cleavage (Figure 4C) or caspase 3/7 activity compared with Vec control cells (Figure 4D). This suggests that, while DES1 is a key node in the SL metabolic network that is necessary for AIS in HER2+ BC cells, this does not appear to be through regulation of anoikis pathways.
FIGURE 4.
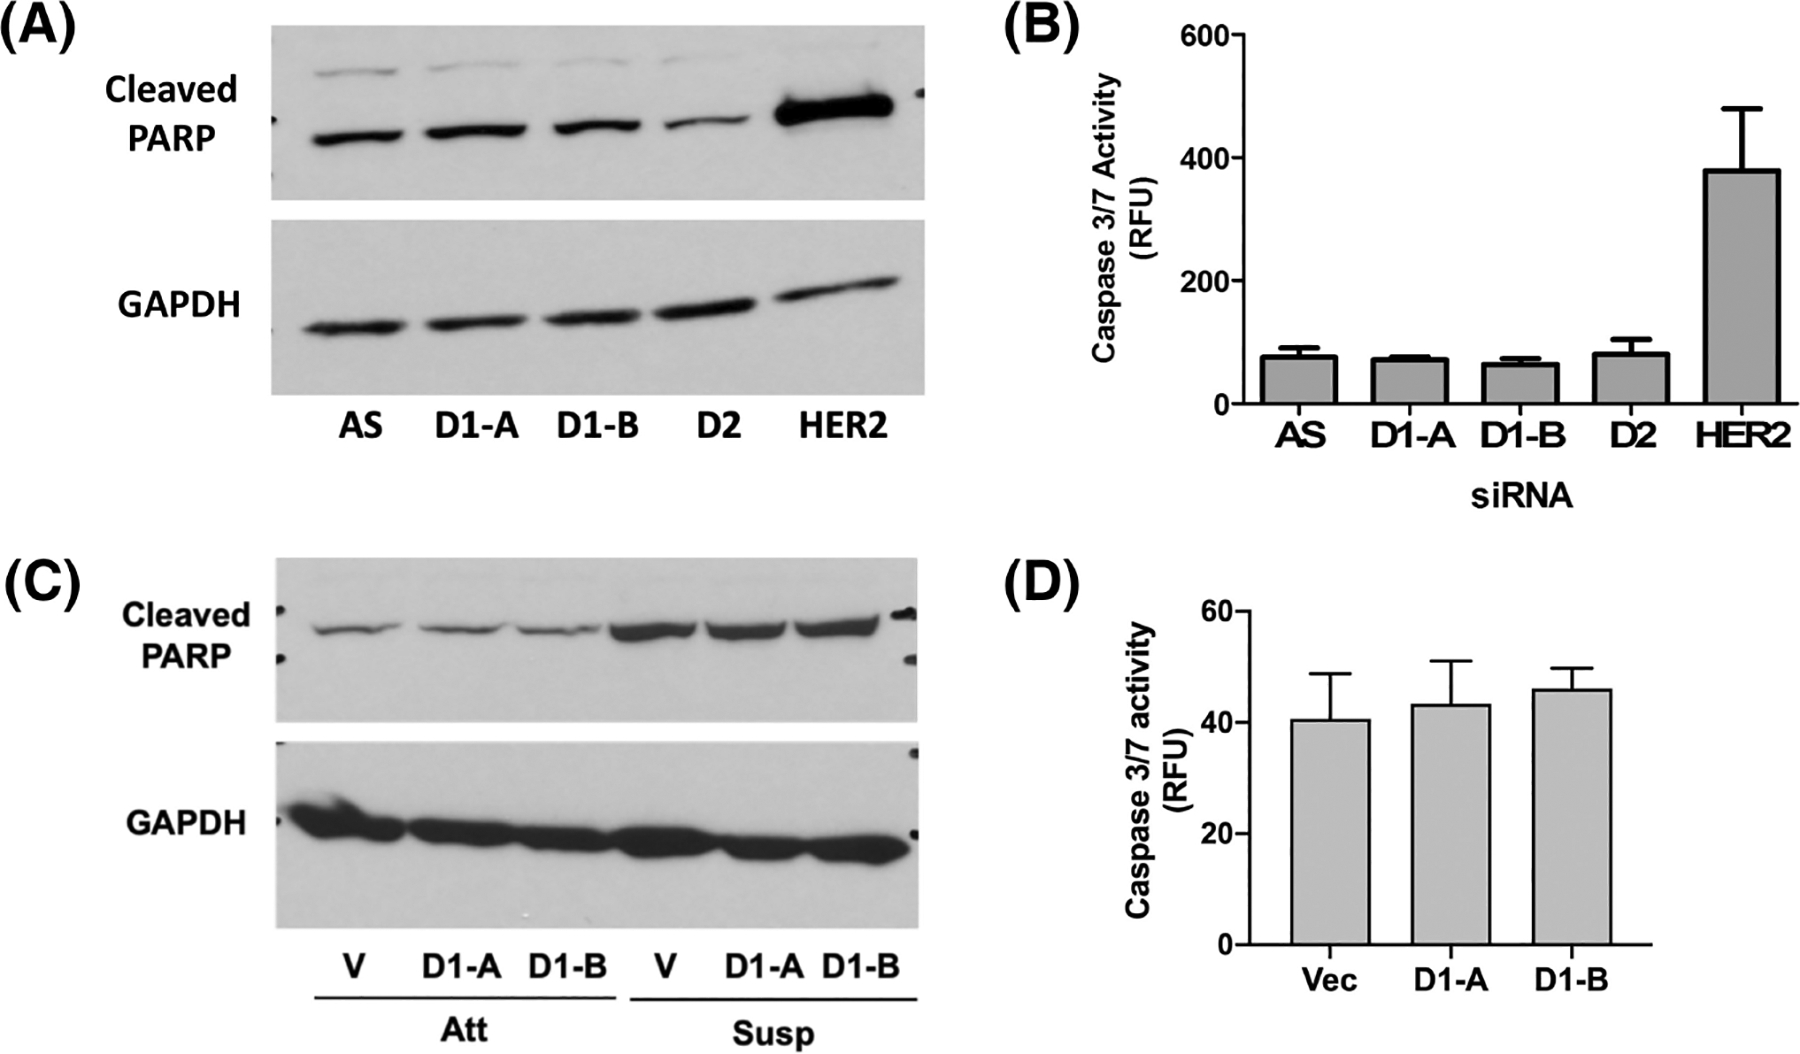
Decreased AIS following DES1 loss is not through activation of apoptotic pathways. (A) SKBR3 cells were treated with negative control (si-AS), DES1 (si-D1A, si-D1B) or DES2 (si-D2) prior to culture in suspension for 48 h. Protein was extracted and analyzed by SDS-PAGE and immunoblot for cleaved PARP using GAPDH as loading control. (B) SKBR3 cells were cultured as in (A). Caspase 3/7 activity was assayed using a commercially available kit and normalized to protein. (C) SKBR3 control (Vec) or DES1 Crispr cells (ΔD1A, ΔD1B) were cultured in monolayer (Att) and suspension (Susp) for 48 h. Cleaved PARP and GAPDH were analyzed by SDS-PAGE as in (A). (D) SKBR3 Crispr cells were cultured as in (A). Caspase 3/7 activity was assayed as in (B).
3.3 |. HER2 maintains post-translational DES1 activity through PI3K signaling in extracellular matrix–detached cells
Despite directly affecting two important bioactive lipids, little is known about the regulation of DES1. The differences in DES1 activity in ECM-detached MCF10A and SKBR3 cells prompted us to explore the underlying mechanisms. There was no change in DES1 protein levels in monolayer or suspension conditions in either MCF10A or SKBR3 cells (Figure 5A), and qRT-PCR analysis showed no significant differences in DES1 expression across MCF10A, SKBR3, and HMEC cells (Figure 5B). The proteasomal inhibitors MG-132 and bortezomib, previously reported to impact DES1,50,51 did not rescue the loss of DES activity in ECM-detached MCF10A cells (Figure 5C) suggesting DES1 is regulated at the post-translational level. We speculated that DES1 is a downstream target of oncogenic HER2 and tested this by treating ECM-detached SKBR3 cells with the dual HER2/EGFR inhibitor lapatinib (Lap, 1 μM). Results revealed a striking reduction in DES activity following Lap treatment with no effect on DES1 levels (Figure 5D) with reduced p-Akt and p-ERK levels confirming Lap efficacy. Supporting this, siRNA knockdown of HER2 reduced DES activity comparably with Lap treatment (Figure 5E) with immunoblot analysis confirming loss of HER2 downregulation, reduced downstream signaling through p-Akt and p-ERK, and no changes in DES1 levels. To assess if HER2 was sufficient to drive DES activity, isogenic 10A-NeuT and 10A-Vec cells were used. Here, while NeuT had a minor effect on DES activity in monolayer conditions, DES activity was significantly increased in ECM-detached 10A-NeuT cells (Figure 5F). This was without significant changes in DES1 protein levels and associated with modestly higher levels of p-ERK and p-Akt (Figure 5F, right) as seen before.52 This establishes DES1 as a key HER2-regulated node in the SL network.
FIGURE 5.
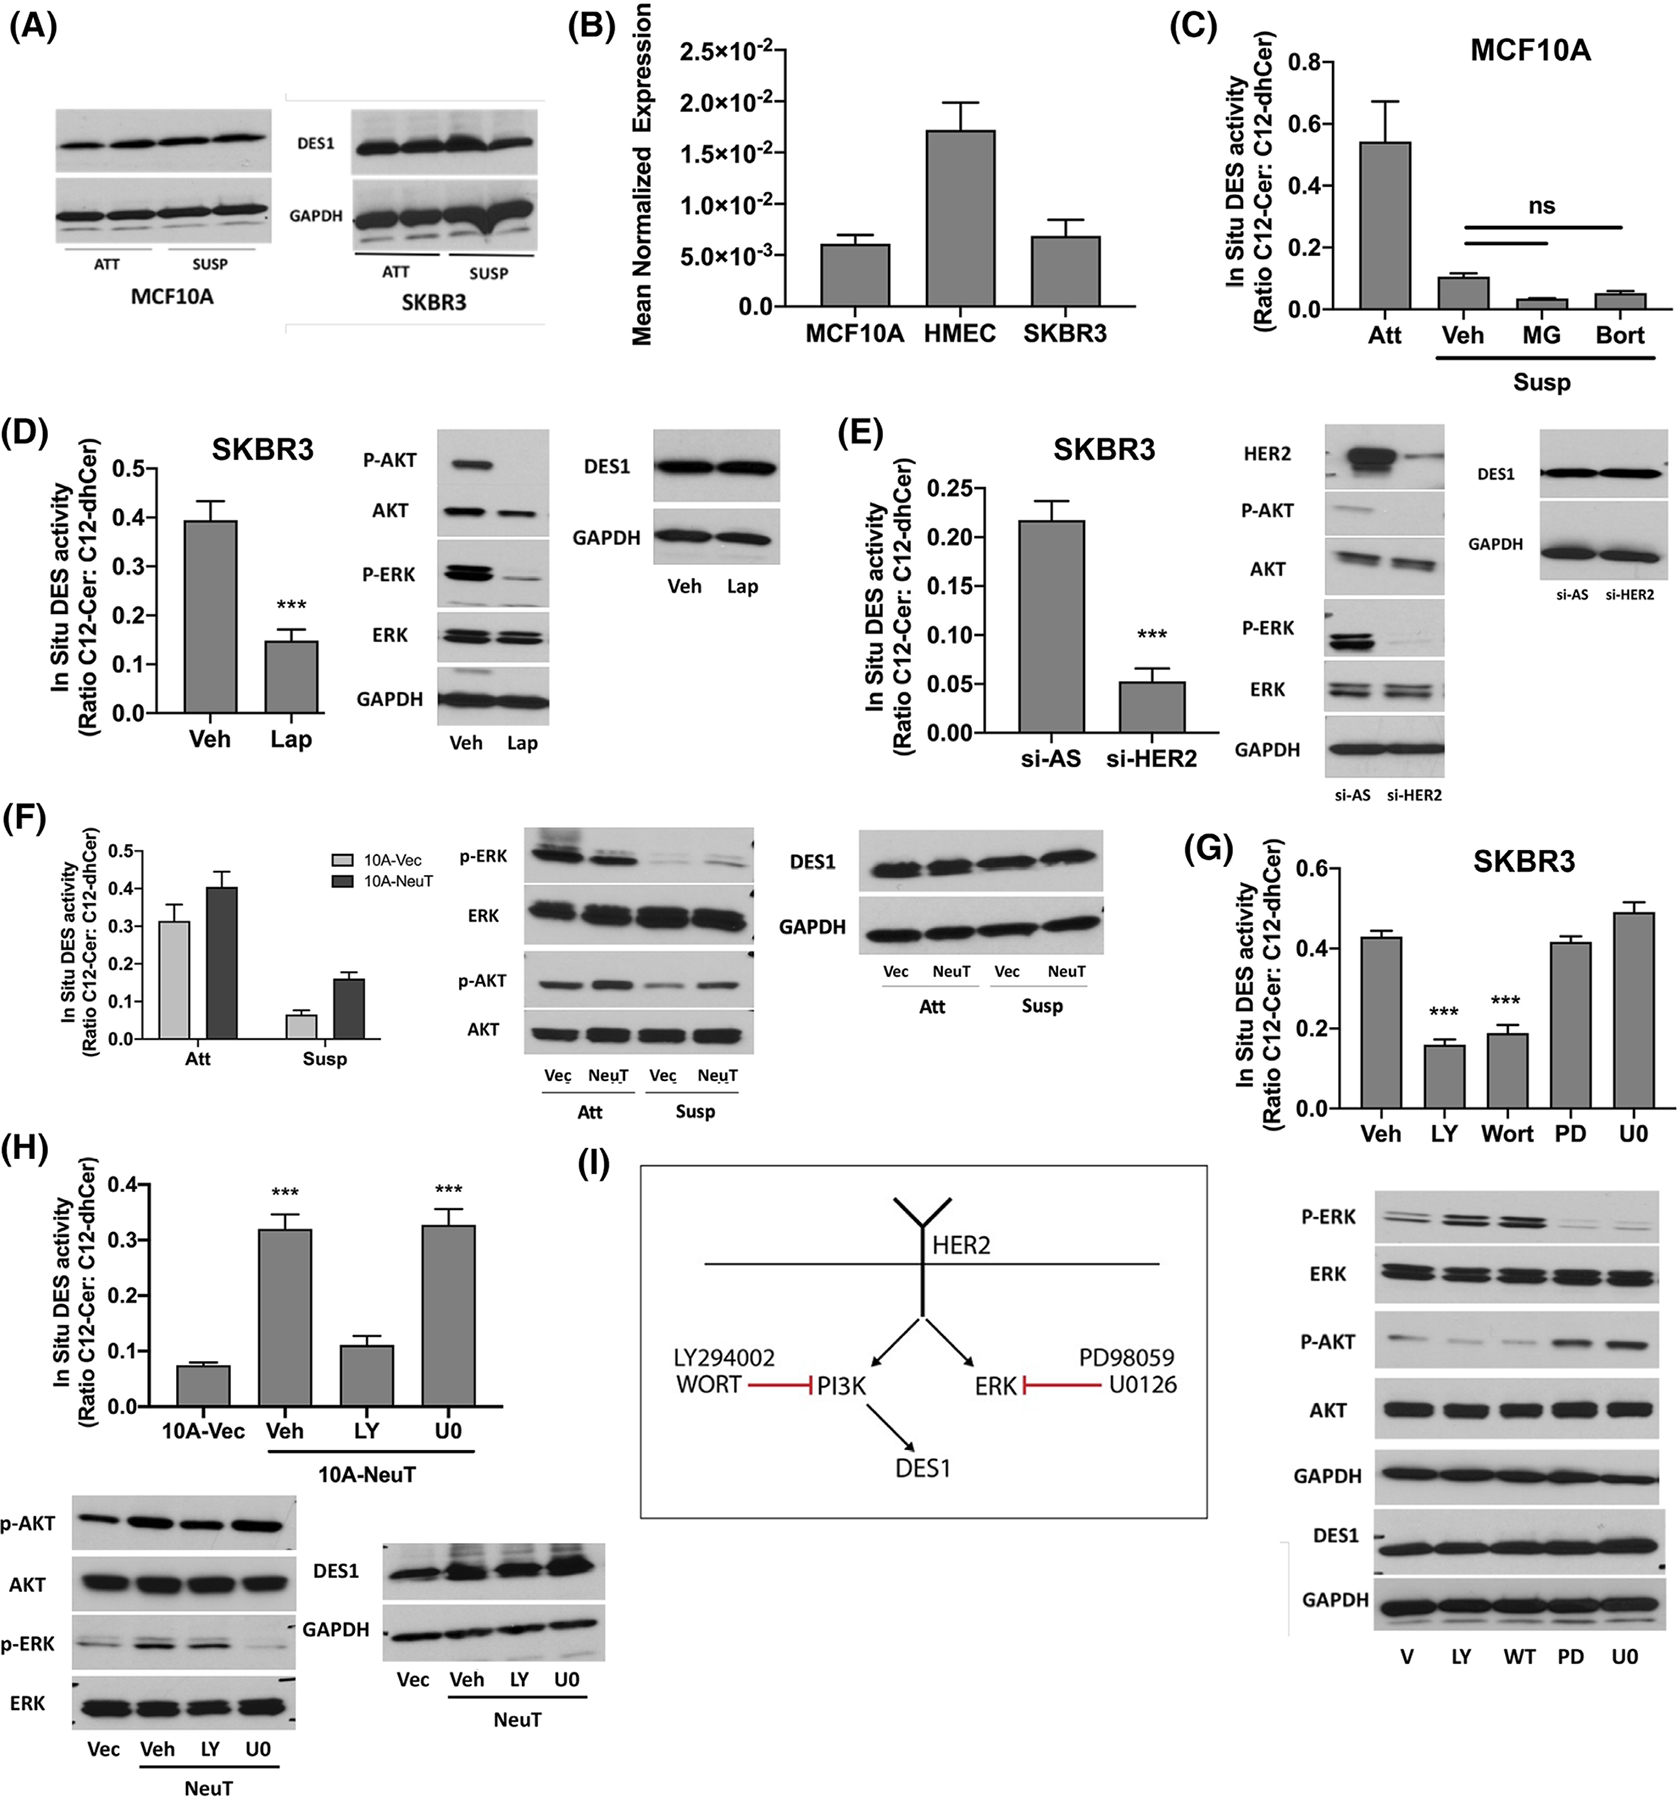
HER2 maintains post-translational DES1 activity through PI3K signaling. (A) MCF10A, HMEC, and SKBR3 cells were cultured in monolayer (Att) or suspension (Susp) for 24 h. DES1 levels were analyzed by SDS-PAGE and western blot with GAPDH as loading control. (B) MCF10A, HMEC, and SKBR3 cells were cultured in suspension for 24 h. DES1 expression was analyzed by qRT-PCR using actin as reference gene. (C) MCF10A cells were culture in monolayer or suspension with Veh (DMSO), MG132 (1 μM) or bortezomib (5 nM) for 24 h. In situ DES activity was probed using C12-dhCCPS with substrate and product levels analyzed by tandem LC/MS. (D) SKBR3 cells were cultured in suspension for 24 h with DMSO or Lap (1 μM). In situ DES activity was assessed as in (C). Whole cell lysates were analyzed for the proteins shown as in (A). (E) SKBR3 cells were treated with negative control (si-AS) or HER2 (si-HER2) siRNA prior to culture in suspension for 24 h. In situ DES activity was assessed as in (C). Whole cell lysates were analyzed for the proteins shown as in (D). (F) Isogenic 10A-Vec and 10A-NeuT cells were cultured as in (B). In situ DES activity was assessed as in (C). Whole cell lysates were analyzed for the proteins shown as in (D). (G) SKBR3 cells were cultured in suspension for 24 h with vehicle (DMSO), LY (10 μM), Wort (2 μM), PD (10 μM) or U0 (2 μM). In situ DES activity was assessed as in (C). Whole cell lysates were analyzed as in (D). (H) Isogenic 10A-Vec and 10A-NeuT were cultured in suspension for 24 h with the inhibitors shown. In situ DES activity was assessed as in (C). Whole cell lysates were analyzed as in (D). (I) Schematic of results linking PI3K but not ERK to HER2-driven DES1 activity. All data are representative of at least three independent experiments and reported as mean ± SEM (**p < .02, ***p < .01).
Both PI3K and ERK have been linked to HER2-driven acquisition of AIS,6,52,53 and as both can be hyperactive across many cancers, it was important to pinpoint which was upstream of DES1 activity. For this, two structurally distinct inhibitors against PI3K (wortmannin, LY294002) and MEK (PD98059, U0126) were used. In SKBR3 cells, both PI3K inhibitors reduced DES activity to a similar extent as Lap, while inhibition of the ERK pathway had no effect (Figure 5G). Similarly, LY treatment completely reduced DES activity in 10A-NeuT cells to Vec control levels whereas U0126 had no effect (Figure 5H). Immunoblot analysis of p-Akt and p-ERK confirmed efficacy and specificity of the inhibitors against their respective pathways in both cell lines while also confirming there was no effect on DES1 levels. Overall, these results demonstrate that DES1 is a downstream effector of HER2-PI3K signaling which occurs through post-translational regulation of activity, as in the schematic shown (Figure 5I).
3.4 |. HER2-driven DES1 activity requires glucose uptake and metabolism
Prior research has linked PI3K regulation of glucose transport and metabolism as important for AIS.6 As glucose-derived NAD(P)H are major co-factors for anabolic reactions, including DES,54,55 we assessed if glucose uptake and metabolism were important for HER2 regulation of DES1. Treatment of SKBR3 cells with the glucose transporter (GLUT) antagonist WZB117 (20 μM), WZB caused a marked inhibition of DES activity (approx 55%) (Figure 6A, left) while in NeuT cells, WZB reduced DES activity close to Vec controls (79% decrease) (Figure 6A, right). Treatment with BAY876 (2 μM), a more specific GLUT1 inhibitor,56 decreased DES activity by approx 31% in SKBR3 cells (Figure 6B, left) and 52.8% in 10A-NeuT cells (Figure 6B, right). Similarly, GLUT1 siRNA decreased GLUT1 expression by approx. 90% with similar effects on DES activity in SKBR3 cells (38%; Figure 6C, left) and 10A-NeuT cells (57%, Figure 6D, left). To block onward metabolism of glucose, the hexokinase inhibitors 2-deoxyglucose (2-DG; 12 mM) (Figure 6E) and 3-bromopyruvate (3-BP; 25 μM) (Figure 6F) were used. Results showed that in both SKBR3 and 10A-NeuT cells, both inhibitors caused strong inhibition of DES activity. Importantly, as above, there was no significant change in DES1 protein levels with either GLUT antagonists, GLUT1 siRNA, or hexokinase inhibitors (data not shown). Taken together, these findings show that glucose uptake, at least in part through GLUT1, and glucose metabolism are required for HER2-driven DES1 activity.
FIGURE 6.
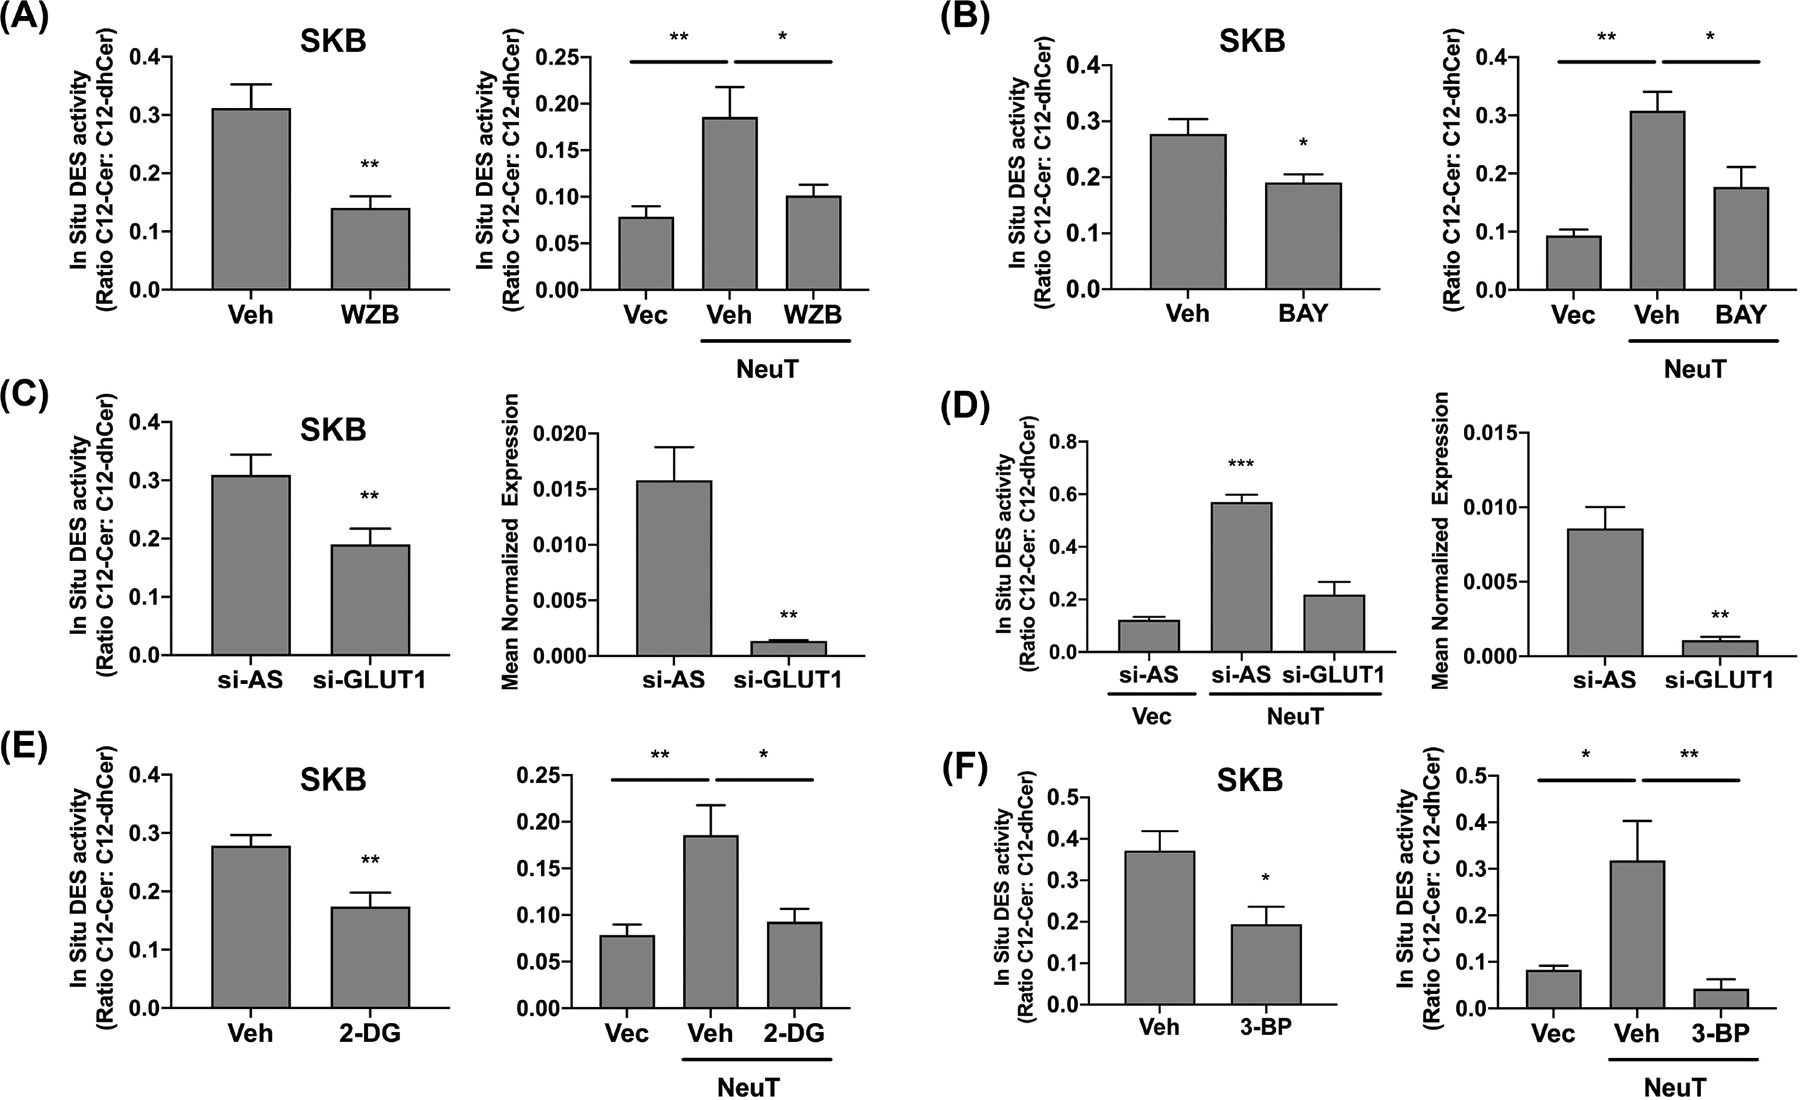
HER2-driven DES1 activity requires glucose uptake and metabolism. (A) SKBR3 (left), 10A-Vec/NeuT (right) cells were cultured in suspension (Susp) with DMSO or WZB117 (20 μM) for 24 h. In situ DES activity was probed using C12-dhCCPS with substrate and product levels analyzed by tandem LC/MS. (B) SKBR3 (left), 10A-Vec/NeuT (right) cells were cultured as in (A) with DMSO or BAY (1 μM). In situ DES activity was analyzed as in (A). (C) SKBR3 cells were treated with negative control (si-AS) or GLUT1 (si-GLUT1) siRNA prior to culture in suspension for 24 h. In situ DES activity was assessed as in (A). GLUT1 mRNA was assessed by qRT-PCR using GAPDH as reference gene. (D) 10A-Vec and 10A-NeuT were cultured and analyzed as in (C). (E) SKBR3 (left), 10A-Vec/NeuT (right) cells were cultured as in (A) with vehicle (dH2O) or 2-DG (20 mM). In situ DES activity was analyzed as in (A). (F) SKBR3 (left), 10A-Vec/NeuT (right) cells were cultured as in (A) with DMSO or 3-BP (25 μM). In situ DES activity was analyzed as in (A). All data are representative of at least three independent experiments and reported as mean ± SEM (*p < .05, **p < .02, ***p < .01).
3.5 |. Increased DES1 expression promotes in vitro HER2-driven tumorigenicity and is associated with worse prognosis in HER2+ BC
Higher AIS can promote cancer aggressiveness57,58 which led us to speculate if there was any association between DES1 expression and clinical outcomes. Although prior results show that HER2 regulation of DES1 is post-translational, we reasoned that a combination of HER2 amplification and high DEGS1 expression could promote a strong AIS phenotype and lead to worse outcomes. Analysis of available TCGA data revealed DES1 amplification or mRNA upregulation in 30% of HER2+ BC tumors (36 of 120; Figure 7A). Analysis of clinical outcome data in HER2+ BC59 linked high DES1 expression with significantly worse relapse-free survival (RFS; Hazard Ratio [HR]: 2.36), overall survival (OS; HR: 2.88), and distant metastasis-free survival (DMFS; HR: 5.13) compared with low DES1 tumors (Figure 7B). Taken together, this suggests that a subset of aggressive HER2+ tumors harbor increased DES1 activity.
FIGURE 7.
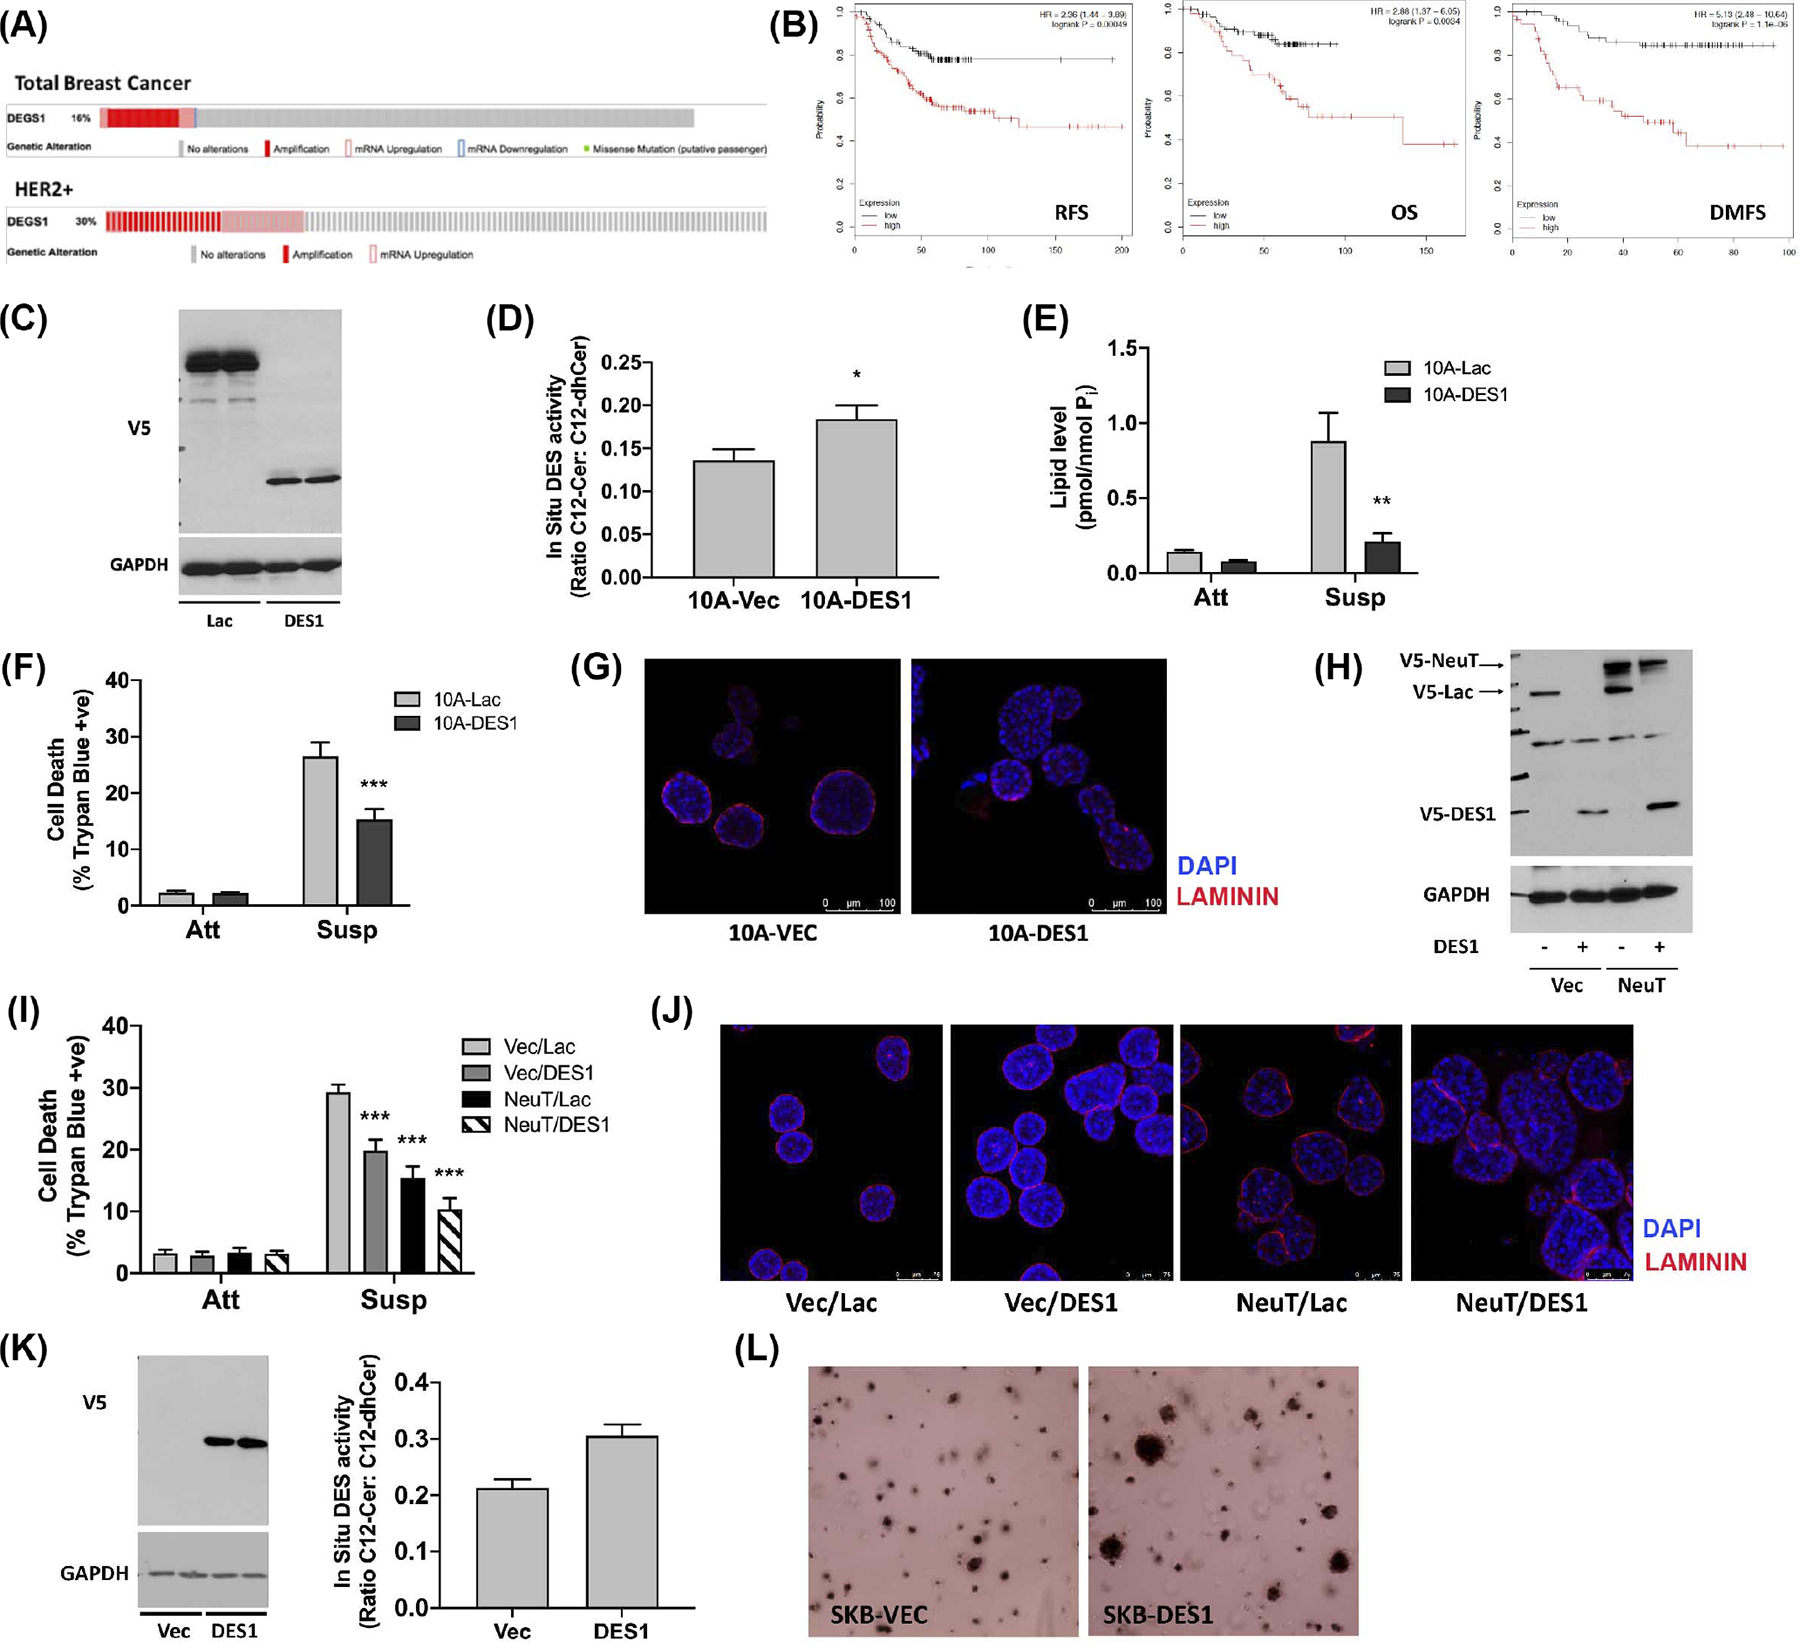
High DES1 levels are associated with worse outcomes and increased tumorigenicity in HER2+ BC. (A) DES1 alterations in total and HER2+ breast cancers of the TCGA dataset. (B) Analysis of RFS, OS, and DMFS in HER2+ breast cancers from www.kmplot.com stratified by high and low DES1 expression. (C) Whole cell lysates of 10A-Vec and 10A-DES1 cells probed as shown with GAPDH as loading control. (D) 10A-Vec and 10A-DES1 cells were cultured in monolayer for 24 h. In situ DES activity was probed with C12-dhCCPS, with substrate and product levels analyzed by tandem LC/MS mass spectrometry. (E) 10A-Vec and 10A-DES1, and -DES2 cells were cultured in monolayer (Att) or suspension (Susp) for 24 h. Levels of dhCer were analyzed by tandem LC/MS mass spectrometry. (F) 10A-Vec and 10A-DES1 cells were cultured in monolayer (Att) or suspension (Susp) for 48 h. Cell death was determined by trypan blue exclusion assay. (G) 10A-Vec and 10A-DES1 cells were cultured in 3D for 8–10d. Cultures were stained with anti-laminin (red) and DAPI (blue) and visualized by confocal microscopy. (H) Whole cell lysates of 10A-Vec/Lac, 10A-Vec/DES1, 10A-NeuT/Lac, and 10A-NeuT/DES1 cells were probed as shown with GAPDH as loading control. (I) 10A-Vec/Lac, 10A-Vec/DES1, 10A-NeuT/Lac, and 10A-NeuT/DES1 were cultured and analyzed as in (F). (J) 10A-Vec/Lac, 10A-Vec/DES1, 10A-NeuT/Lac, and 10A-NeuT/DES1 were cultured for 6–8d and stained as in (G). (K) (left) Whole cell lysates of SKB-Vec and -DES1 cells were probed as shown with GAPDH as loading control; (right) Cells were cultured in monolayer for 24 h and in situ DES activity probed as in (E). (L) SKB-Vec and SKB-DES1 cells were plated in soft agar for 6–8d. Colonies were stained and visualized using an EVOS microscope. All data are representative of at least three independent experiments and reported as mean ± SEM (*p < .05, **p < .02, ***p < .01).
To assess functional consequences of increased DES1 levels, isogenic MCF10A cells expressing V5-tagged DES1 and V5-LacZ control cells were generated as confirmed by immunoblot analysis (Figure 7C). In situ assays confirmed higher DES activity (Figure 7D) which led to suppression of dhCer accumulation in ECM-detached 10A-DES1 cells compared with LacZ controls (Figure 7E). Biologically, DES1 overexpression had no effects on cell viability in monolayer but led to a marked reduction in cell death in suspension (Figure 7F). In a more physiologically relevant 3D culture, 10A-DES1 cells showed a disrupted acinar structure with greater filling of the lumen than seen in LacZ controls (Figure 7G). Thus, increased DES1 is sufficient to drive AIS and disrupt acini structure, although it is not fully transformative as 10A-DES1 cells could not form colonies in soft agar (Figure S6). To determine effects of high DES1 in the context of HER2 amplification, isogenic MCF10A cells combining NeuT and DES1 overexpression were generated (with Vector and LacZ as controls for NeuT and DES1, respectively). Immunoblot analysis confirmed expression of NeuT and DES1 in the four cell lines (Vec/Lac; NeuT/Lac; Vec/DES1; NeuT/DES1) (Figure 7H). As above, NeuT (15.9%) and DES1 (19.5%) alone both reduced trypan blue positivity in suspension compared with Vec/Lac cells (29.2%) (Figures 1F and 7F) while NeuT/DES1 cells showed modestly higher survival (10.9%) than cell lines expressing NeuT or DES1 alone (Figure 7I, hatched bars). Culture in the more physiologically relevant 3D format revealed striking differences among the cell lines (Figure 7J). After 8d, Vec/Lac cells showed typical acini with the beginning of lumen formation while 10A-Vec/DES1 cells formed slightly larger acini with a more filled lumen as above. Expression of NeuT alone (10A-NeuT/Lac) resulted in larger disrupted acini with filled lumen as reported previously.2 However, combined NeuT/DES1 expression showed a striking disruption of acini structure, with cells forming larger, distorted, and filled acini compared with single NeuT and DES1 expression (Figure 7J). To consolidate these data in BC cells, isogenic SKBR3 cells overexpressing LacZ or DES1 were generated and validated by immunoblot analysis (Figure 7K, left) and in situ DES activity assays. (Figure 7K, right). Soft agar assays revealed that DES1 overexpression promoted colony formation with a number of SKB-DES1 cells forming larger colonies after just 7d of growth compared with their LacZ counterparts. Indeed, such colonies were comparable in size with control SKBR3 cells grown for 12–14d (Figure 3J,K). Overall, these results demonstrate that increased DES1 expression drives AIS in breast epithelial cells and increased tumorigenicity in HER2+ BC cells. Taken together with clinical outcome data, these studies suggest that DES1 is a driver of cancer aggressiveness and metastasis in HER2+ BC.
3.6 |. Inhibitors of other sphingolipid enzymes can also overcome anchorage-independent survival in HER2+ BC cells
SL levels are regulated by an interlinked metabolic network of enzymes, and alterations of a specific node in the network such as DES1 could potentially alter levels of multiple bioactive SLs both upstream (dhCer, dhSph) and downstream (Cer, SM, HexosylCer). Although this makes it harder to pinpoint the key lipids of interest induce detachment induced death and/or promote AIS, this suggests that other SL enzymes may also be involved in promotion of AIS. To begin to explore this, the effects of a panel of known SL inhibitors on AIS in SKBR3 cells were performed, using the HER2/EGFR inhibitor Lap as a positive control (Figure S7). Of the inhibitors used, only fumonisin B1 (Cer synthases), Urea-Cer (neutral ceramidase), PDMP (glucosylceramide synthase GCS) and D609 (SM synthase) had effects comparable with Lap and 4HPR/SKi-II seen above (Figure 3). However, both Urea-Cer and PDMP had strong effects on cell viabliliy in monolayer (not shown) suggesting they have general toxicity effects rather than specific effects on AIS. Nonetheless, taken together with our 4HPR data, results with D609 and FB1 further support a role for reprogramming of SLs in AIS of HER2+ BC, and suggest there may be additional targets of interest in the SL network.
4 |. DISCUSSION
Given the classical role of SLs as mediators of cell death, it is surprising that connections between SLs and AIS have not been explored. The major finding of our study establishes a novel pro-tumor role for DES1 in translating oncogene-driven glucose uptake and metabolism into the acquisition of AIS in HER2+ BC. Given the central role for AIS in the metastatic cascade, our study makes a compelling case that targeting DES1 may be a viable approach for treating metastatic BC. Furthermore, the association of high DES1 expression with worse clinical outcomes suggests it may also have value as a biomarker of metastasis-prone HER2+ BC.
Targeting DES1, an enzyme that produces Cer, represents a marked departure from current SL-based approaches to promote cancer cell death which are centered on enhancing Cer levels using exogenous lipids and inhibitors of Cer-metabolic pathways.29,60 Although exogenous Cer was reported to induce anoikis in cancer cells61–63 and has some therapeutic potential, particularly in nanoliposomes, there are potential drawbacks as exogenous Cer also kills non-transformed cells.64,65 In contrast, targeting “tumor-specific” dependencies in the SL network has potential to avoid such issues. Moreover, modulating DES activity is potentially more straightforward than inhibiting multiple routes of Cer metabolism to induce cell death. Although the DES1 inhibitors used here, namely 4HPR and SKi-II, are known to affect other targets, our conclusions are strongly supported by genetic loss of function experiments as well as gain of function approaches showing that DES1 is sufficient to drive AIS and enhance in vitro tumorigenicity. Of note, although effects of DES1 inhibitors on cell death and proliferation have been reported,66–68 biological consequences of increased DES1 activity and/or expression are less well studied. Furthermore, our studies offer important context as to when DES1 inhibitors could be particularly effective, that is, in the metastatic setting where AIS is a key biology. An outstanding question relates to the mechanism by which DES1 promotes AIS and there are a couple of possibilities. Prior studies have shown that loss of DES1 activity can lead to activation of apoptosis,66–68 autophagy,46,67 and ER stress pathways.69 Our studies here suggest that DES1 is not impacting classical anoikis pathways, as DES1 loss did not induce PARP cleavage or increase caspase activity. However, both ER stress and autophagy have been linked to cell death following ECM detachment; thus, DES1 activity may promote AIS through mitigating these responses. It is also possible that DES1 may regulate other relevant pathways such as necroptosis or mitophagy. The specific biologies and downstream effectors regulated by DES1 in this context are currently under further investigation. A related question is the identity of the specific lipids impacted by DES1 that are linked to detachment-induced death or that promote AIS. Inhibitor screens suggest that inhibiting Cer and SM synthases are also effective at overcoming AIS. This could implicate dhSph (accumulated following Cer synthase and DES1 inhibition) as key for inducing detachment-induced death. On the other hand, it is also plausible that full AIS requires a downstream pro-survival lipid, for example, SM that is impacted by blocking SM synthase. These inhibitor screens together with defining key DES1-regulated pathways in the context of ECM detachment will allow us to start ‘triangulating’ the relevant lipids involved. Nonetheless, these inhibitor studies support reprogramming of SL metabolism as a component of AIS in HER2+ BC and suggest additional targets of interest effective at overcoming AIS.
Despite controlling the levels of two bioactive lipids, comparatively little is known about DES1 regulation. A major insight from our study places DES1 downstream of oncogenic HER2 through PI3K signaling which has profound implications. Hyperactivation of the PI3K pathway is a common alteration across many cancers,70,71 occurring through receptor tyrosine kinase activation, oncogenic PI3K mutations, or loss of the PTEN tumor suppressor. It would be interesting to determine if such changes are also able to activate DES1 as this would broaden the potential for targeting DES1 to overcome AIS and could suggest roles for DES1 in other known PI3K-driven biologies, for example, therapeutic resistance.46,69 Of note, the latter would be consistent with studies that connected AIS with drug resistance phenotypes.72,73 A second novel insight from this study is identifying DES1 as a potential point of crosstalk between SL and glucose metabolic pathways through oncogenic stimulation of glucose uptake. Of note, high glucose uptake and increased GLUT1 expression has been associated with worse outcomes in a number of malignancies.74,75 Our findings suggest that such tumors may harbor increased DES1 activity which could contribute to their aggressive nature by promoting AIS. Such cancers may also benefit the most from the targeting of DES1 activity. An outstanding question here is the nature of the mechanism by which glucose uptake and metabolism connects to DES1 activity. As a reductive enzyme, DES1 requires NADH or NADPH as a cofactor for its reaction.54,55 Consequently, one possibility is that HER2-driven DES activity is directly linked to co-factor availability which would raise an intriguing possibility that DES1 senses glucose-derived NADPH/NADH as a mechanism to co-ordinate SL synthesis with extracellular glucose availability and uptake. Given established roles of DES1 in autophagy and growth arrest,42,46,76 a loss of DES1 activity trigged by low extracellular nutrients could be one such mechanism to activate these protective processes. These possibilities as well as the relevant glucose metabolic pathways involved are currently under further investigation. An additional point to note is the difference in the magnitude of effects of some inhibitors/siRNA on DES1 activity between SKBR3 and 10A-NeuT. In these studies, we consider the 10A-NeuT cells as the ‘cleanest’ system for dissecting HER2-driven effects. Nonetheless, we speculate these differences could be due to additional mutations in SKBR3 that impact cellular metabolic pathways, for example, p53 mutations. It is also possible that such mutations/changes may affect DES1 through other post-translational means, for example, PTMs, alterations in interacting partners. This could also account for the variations in DES activity that we observed across different HER2+ BC cells. Studies on possible interactions between other oncogenes and tumor suppressors and DES1, other mechanisms of post-translational regulation and DES1 interactions are also currently underway.
In conclusion, our study has established DES1 as a key oncogene-regulated node in the SL network that drives the acquisition of AIS and gives much needed insight into how dysregulation of cellular metabolic pathways are linked to oncogenic phenotypes. This further identifies DES1 as a novel target of interest for treatment of metastatic disease and suggests that DES1 expression could have utility as a biomarker of metastasis-prone HER2+ BC. Given connections of AIS with cancer aggressiveness, it would be important to explore applicability of our findings to other cancers in terms of oncogene effects on SL metabolism and, most importantly, on druggable alterations in the SL network. Moreover, establishing a broader connection between DES1 and AIS could have implications for those cancers where oncogenic drivers are less clear.
Supplementary Material
ACKNOWLEDGMENTS
The authors wish to acknowledge Izolda Mileva and the Stony Brook Cancer Center Lipidomics for expert assistance with sphingolipid analysis, and Zdzislaw Szulc at the MUSC Lipidomics core for synthesis of C12-dhCPPS. The authors are grateful to Drs. Chiara Luberto, Victoria A. Blaho, and Yusuf A. Hannun for helpful comments on the manuscript, and to Mike Vafeas for assistance with illustrations. This work was supported by the Stony Brook Department of Medicine, the Carol M. Baldwin Foundation, the Ward Melville Heritage Organization Walk for Beauty, the Bahl Center for Imaging and Metabolism at Stony Brook Cancer Center, and National Institutes of Health R01 CA248014 (all to C.J.C.). Additional support came from a URECA summer fellowship from the Sass Foundation (to J.A.).
Funding information
Carol M. Baldwin Breast Cancer Research Fund (Carol M. Baldwin Breast Cancer Research Fund, Inc.); HHS | National Institutes of Health (NIH), Grant/Award Number: R01 CA248014; Sass Foundation; SUNY | Stony Brook University (SBU); Ward Melville Heritage Organization Walk for Beauty
Abbreviations:
- 2-DG
2-deoxyglucose
- 3-BP
3-bromopyruvate
- 4HPR
fenretinide
- AIS
anchorage-independent survival
- AS
allstars negative control siRNA
- Cer
ceramide
- DES
dihydroceramide desaturase activity
- DES1
dihydroceramide desaturase 1
- DES2
dihydroceramide desaturase 2
- dhCer
dihydroceramide
- dhSph
dihydrosphingosine
- ECM
extracellular matrix
- EGF
epidermal growth factor
- EGFR
epidermal growth factor receptor
- FBS
fetal bovine serum
- GLUT
glucose transporter
- HMEC
human mammary epithelial cells
- Lap
lapatinib
- LC/MS
liquid chromatography/mass spectrometry
- NeuT
constitutively active HER2
- PI3K
liquid chromatography/mass spectrometry
- RIPA
radioimmunoprecipitation buffer
- SL
sphingolipid
- SM
sphingomyelin
- Sph
sphingosine
- TCGA
the cancer genome atla
Footnotes
DISCLOSURES
The authors have stated explicitly that there are no conflicts of interest in connection with this article.
SUPPORTING INFORMATION
Additional supporting information can be found online in the Supporting Information section at the end of this article.
DATA AVAILABILITY STATEMENT
Data in Figure 7A were generated from analysis of The Cancer Genome Atlas (TCGA)77 available at www.cbioportal.org. Data in Figure 7B were generated from analysis of breast cancer microarray data at www.kmplot.com.56
REFERENCES
- 1.Frisch SM, Francis H. Disruption of epithelial-matrix interactions induces apoptosis. J Cell Biol. 1994;124(4):619–626. [DOI] [PMC free article] [PubMed] [Google Scholar]
- 2.Debnath J, Mills KR, Collins NL, Reginato MJ, Muthuswamy SK, Brugge JS. The role of apoptosis in creating and maintaining luminal space within normal and oncogene-expressing mammary acini. Cell. 2002;111(1):29–40. [DOI] [PubMed] [Google Scholar]
- 3.Fung C, Lock R, Gao S, Salas E, Debnath J. Induction of autophagy during extracellular matrix detachment promotes cell survival. Mol Biol Cell. 2008;19(3):797–806. [DOI] [PMC free article] [PubMed] [Google Scholar]
- 4.Avivar-Valderas A, Bobrovnikova-Marjon E, Alan Diehl J, Bardeesy N, Debnath J, Aguirre-Ghiso JA. Regulation of autophagy during ECM detachment is linked to a selective inhibition of mTORC1 by PERK. Oncogene. 2013;32(41):4932–4940. [DOI] [PMC free article] [PubMed] [Google Scholar]
- 5.Hawk MA, Gorsuch CL, Fagan P, et al. RIPK1-mediated induction of mitophagy compromises the viability of extracellular-matrix-detached cells. Nat Cell Biol. 2018;20(3): 272–284. [DOI] [PubMed] [Google Scholar]
- 6.Schafer ZT, Grassian AR, Song L, et al. Antioxidant and oncogene rescue of metabolic defects caused by loss of matrix attachment. Nature. 2009;461(7260):109–113. [DOI] [PMC free article] [PubMed] [Google Scholar]
- 7.Mason JA, Cockfield JA, Pape DJ, et al. SGK1 signaling promotes glucose metabolism and survival in extracellular matrix detached cells. Cell Rep. 2021;34(11):108821. [DOI] [PubMed] [Google Scholar]
- 8.Schiffmann S, Sandner J, Birod K, et al. Ceramide synthases and ceramide levels are increased in breast cancer tissue. Carcinogenesis. 2009;30(5):745–752. [DOI] [PubMed] [Google Scholar]
- 9.Nagahashi M, Tsuchida J, Moro K, et al. High levels of sphingolipids in human breast cancer. J Surg Res. 2016;204(2):435–444. [DOI] [PMC free article] [PubMed] [Google Scholar]
- 10.Jiang Y, DiVittore NA, Young MM, et al. Altered sphingolipid metabolism in patients with metastatic pancreatic cancer. Biomolecules. 2013;3(3):435–448. [DOI] [PMC free article] [PubMed] [Google Scholar]
- 11.da Silva G, de Matos LL, Kowalski LP, Kulcsar M, Leopoldino AM. Profile of sphingolipid-related genes and its association with prognosis highlights sphingolipid metabolism in oral cancer. Cancer Biomark. 2021;32(1):49–63. [DOI] [PMC free article] [PubMed] [Google Scholar]
- 12.Ecker J, Benedetti E, Kindt ASD, et al. The colorectal cancer lipidome: identification of a robust tumor-specific lipid species signature. Gastroenterology. 2021;161(3):910–923.e19. [DOI] [PubMed] [Google Scholar]
- 13.Ingram LM, Finnerty MC, Mansoura M, Chou CW, Cummings BS. Identification of lipidomic profiles associated with drug-resistant prostate cancer cells. Lipids Health Dis. 2021;20(1):15. [DOI] [PMC free article] [PubMed] [Google Scholar]
- 14.Snider AJ, Seeds MC, Johnstone L, et al. Identification of plasma glycosphingolipids as potential biomarkers for prostate cancer (PCa) status. Biomolecules. 2021;10(10):1393. [DOI] [PMC free article] [PubMed] [Google Scholar]
- 15.Hannun YA, Obeid LM. Sphingolipids and their metabolism in physiology and disease. Nat Rev Mol Cell Biol. 2017;19(3):175–192. [DOI] [PMC free article] [PubMed] [Google Scholar]
- 16.Ogretmen B Sphingolipid metabolism in cancer signaling and therapy. Nat Rev Cancer. 2018;18(1):33–50. [DOI] [PMC free article] [PubMed] [Google Scholar]
- 17.Obeid LM, Linardic CM, Karolak LA, Hannun YA. Programmed cell death induced by ceramide. Science. 1993;259(5102):1769–1771. [DOI] [PubMed] [Google Scholar]
- 18.Chipuk JE, McStay GP, Bharti A, et al. Sphingolipid metabolism cooperates with BAK and BAX to promote the mitochondrial pathway of apoptosis. Cell. 2012;148(5):988–1000. [DOI] [PMC free article] [PubMed] [Google Scholar]
- 19.Sawada M, Kiyono T, Nakashima S, et al. Molecular mechanisms of TNF-alpha-induced ceramide formation in human glioma cells: p53-mediated oxidant stress-dependent and -independent pathways. Cell Death Diff. 2004;11:997–1008. [DOI] [PubMed] [Google Scholar]
- 20.Luberto C, Hassler DF, Signorelli P, et al. Inhibition of tumor necrosis factor-induced cell death in MCF7 by a novel inhibitor of neutral sphingomyelinase. J Biol Chem. 2002;277(43):41128–41139. [DOI] [PubMed] [Google Scholar]
- 21.Guenther GG, Peralta ER, Rosales KR, Wong SY, Siskind LJ, Edinger AL. Ceramide starves cells to death by downregulating nutrient transporter proteins. Proc Natl Acad Sci U S A. 2008;105(45):17402–17407. [DOI] [PMC free article] [PubMed] [Google Scholar]
- 22.Sundaram K, Mather AR, Marimuthu S, et al. Loss of neutral ceramidase protects cells from nutrient-and energy-deprivation-induced cell death. Biochem J. 2016;473(6):743–755. [DOI] [PMC free article] [PubMed] [Google Scholar]
- 23.Haimovitz-Friedman A, Kan CC, Ehleiter D, et al. Ionizing radiation acts on cellular membranes to generate ceramide and initiate apoptosis. J Exp Med. 1994;180(2):525–535. [DOI] [PMC free article] [PubMed] [Google Scholar]
- 24.Herr I, Wilhelm D, Bohler T, Angel P, Debatin KM. Activation of CD95 (APO-1/Fas) signaling by ceramide mediates cancer therapy-induced apoptosis. EMBO J. 1997;16(20):6200–6208. [DOI] [PMC free article] [PubMed] [Google Scholar]
- 25.Perry DK, Carton J, Shah AK, Meredith F, Uhlinger DJ, Hannun YA. Serine palmitoyltransferase regulates de novo ceramide generation during etoposide-induced apoptosis. J Biol Chem. 2000;275(12):9078–9084. [DOI] [PubMed] [Google Scholar]
- 26.Becker KA, Uerschels AK, Goins L, et al. Role of 1-deoxysphingolipids in docetaxel neurotoxicity. J Neurochem. 2020;154(6):662–672. [DOI] [PMC free article] [PubMed] [Google Scholar]
- 27.Shamseddine AA, Clarke CJ, Carroll B, et al. Neutral sphingomylinase-2 (nSMase2) is the primary sphingomyelinase activated by doxorubicin via a p53-dependent mechanism. Cell Death Dis. 2015;6:e1947. [DOI] [PMC free article] [PubMed] [Google Scholar]
- 28.Hartfield PJ, Mayne GC, Murray AW. Ceramide induces apoptosis in PC12 cells. FEBS Lett. 1997;401:148–152. [DOI] [PubMed] [Google Scholar]
- 29.Stover T, Kester M. Liposomal delivery enhances short-chain ceramide-induced apoptosis of breast cancer cells. J Pharmacol Exp Ther. 2003;307:468–475. [DOI] [PubMed] [Google Scholar]
- 30.Lee W-J, Yoo H-S, Suh P-G, Oh S, Lim J-S, Lee Y-M. Sphingosine mediates FTY720-induced apoptosis in LLC-PK1 cells. Exp Mol Med. 2004;36(5):420–427. [DOI] [PubMed] [Google Scholar]
- 31.Cuvillier O, Nava VE, Murthy SK, et al. Sphingosine generation, cytochrome c release and activation of caspase-7 in doxorubicin-induced apoptosis of MCF7 cells. Cell Death Diff. 2001;8:162–171. [DOI] [PubMed] [Google Scholar]
- 32.Guillermet-Guibert J, Davenne L, Pchejetski D, et al. Targeting the sphingolipid metabolism to defeat pancreatic cancer cell resistance to the chemotherapeutic gemcitabine drug. Mol Cancer Ther. 2009;8(4):809–820. [DOI] [PubMed] [Google Scholar]
- 33.Illuzzi G, Bernacchioni C, Aureli M, et al. Sphingosine kinase mediates resistance to the synthetic retinoid N-(4-hydroxyphenyl)retinamide in human ovarian cancer cells. J Biol Chem. 2010;285(24):18594–18602. [DOI] [PMC free article] [PubMed] [Google Scholar]
- 34.Apraiz A, Idkowiak-Baldys JK, Boyano MD, Pérez-Yarza G, Hannun YA, Asumendi A. Evaluation of bioactive sphingolipids in 4-HPR-resistant leukemia cells. BMC Cancer. 2011;11:477. [DOI] [PMC free article] [PubMed] [Google Scholar]
- 35.Liu YY, Yu JY, Yin D, et al. A role for ceramide in driving cancer cell resistance to doxorubicin. FASEB J. 2008;22(7): 2541–2551. [DOI] [PubMed] [Google Scholar]
- 36.Wang X-Z, Beebe JR, Pwiti L, Bielawska A, Smyth MJ. Aberrant sphingolipid signaling is involved in the resistance of prostate cancer cell lines to chemotherapy. Cancer Res. 1999;59:5842–5848. [PubMed] [Google Scholar]
- 37.Sanjana NE, Shalem O, Zhang F. Improved vectors and genome-wide libraries for CRISPR screening. Nat Methods. 2014;11(8):783–784. [DOI] [PMC free article] [PubMed] [Google Scholar]
- 38.Shalem O, Sanjana NE, Hartenian E, et al. Genome-scale CRISPR-Cas9 knockout screening in human cells. Science. 2014;343(6166):84–87. [DOI] [PMC free article] [PubMed] [Google Scholar]
- 39.Bielawski J, Pierce JS, Snider J, Rembiesa B, Szulc ZM, Bielawska A. Sphingolipid analysis by high performance liquid chromatography-tandem mass spectrometry (HPLC-MS/MS). Adv Exp Med Biol. 2010;688:46–59. [DOI] [PubMed] [Google Scholar]
- 40.Snider JM, Snider AJ, Obeid LM, Luberto C, Hannun YA. Probing de novo sphingolipid metabolism in mammalian cells utilizing mass spectrometry. J Lipid Res. 2018;59(6): 1046–1057. [DOI] [PMC free article] [PubMed] [Google Scholar]
- 41.Snider JM, Trayssac M, Clarke CJ, et al. Multiple actions of doxorubicin on the sphingolipid network revealed by flux analysis. J Lipid Res. 2019;60:819–831. [DOI] [PMC free article] [PubMed] [Google Scholar]
- 42.Kraveka JM, Li L, Szulc ZM, et al. Involvement of dihydroceramide desaturase in cell cycle progression in human neuroblastoma cells. J Biol Chem. 2007;282(23):16718–16728. [DOI] [PMC free article] [PubMed] [Google Scholar]
- 43.Rahmaniyan M, Curley RW Jr, Obeid LM, Hannun YA, Kraveka JM. Identification of dihydroceramide desaturase as a direct in vitro target for fenretinide. J Biol Chem. 2011;286(28):24754–24764. [DOI] [PMC free article] [PubMed] [Google Scholar]
- 44.Reginato MJ, Mills KR, Becker EB, et al. Bim regulation of lumen formation in cultured mammary epithelial acini is targeted by oncogenes. Mol Cell Biol. 2005;25(11):4591–4601. [DOI] [PMC free article] [PubMed] [Google Scholar]
- 45.Campone M, Noël B, Couriaud C, et al. c-Myc dependent expression of pro-apoptotic Bim renders HER2-overexpressing breast cancer cells dependent on anti-apoptotic Mcl-1. Mol Cancer. 2011;10:110. [DOI] [PMC free article] [PubMed] [Google Scholar]
- 46.Hernández-Tiedra S, Fabriàs G, Dávila D, et al. Dihydroceramide accumulation mediates cytotoxic autophagy of cancer cells via autolysosome destabilization. Autophagy. 2016;12(11):2213–2229. [DOI] [PMC free article] [PubMed] [Google Scholar]
- 47.Cadena DL, Kurten RC, Gill GN. The product of the MLD gene is a member of the membrane fatty acid desaturase family: overexpression of MLD inhibits EGF receptor biosynthesis. Biochemistry. 1997;36(23):6960–6967. [DOI] [PubMed] [Google Scholar]
- 48.Mizutani Y, Kihara A, Igarashi Y. Identification of the human sphingolipid C4-hydroxylase, hDES2, and its up-regulation during keratinocyte differentiation. FEBS Lett. 2004;563:93–97. [DOI] [PubMed] [Google Scholar]
- 49.Cingolani F, Casasampere M, Sanllehí P, Casas J, Bujons J, Fabrias G. Inhibition of dihydroceramide desaturase activity by the sphingosine kinase inhibitor SKI II. J Lipid Res. 2014;55:1711–1720. [DOI] [PMC free article] [PubMed] [Google Scholar]
- 50.Alsanafi M, Kelly SL, Jubair K, et al. Native and polyubiquitinated forms of dihydroceramide desaturase are differentially linked to human embryonic kidney cell survival. Mol Cell Biol. 2020;38(23):e00222–18. [DOI] [PMC free article] [PubMed] [Google Scholar]
- 51.Alsanafi M, Brown RDR, Oh J, et al. Dihydroceramide desaturase functions as an inducer and rectifier of apoptosis: effect of retinol derivatives, antioxidants and phenolic compounds. Cell Biochem Biophys. 2021;79(3):461–475. [DOI] [PMC free article] [PubMed] [Google Scholar]
- 52.Schmelzle T, Mailleux AA, Overholtzer M, et al. Functional role and oncogene-regulated expression of the BH3-only factor Bmf in mammary epithelial anoikis and morphogenesis. Proc Natl Acad Sci U S A. 2007;104:3787–3792. [DOI] [PMC free article] [PubMed] [Google Scholar]
- 53.Reginato MJ, Mills KR, Paulus JK, et al. Integrins and EGFR coordinately regulate the pro-apoptotic protein Bim to prevent anoikis. Nat Cell Biol. 2003;5:733–740. [DOI] [PubMed] [Google Scholar]
- 54.Geeraert L, Mannaerts GP, van Veldhoven PP. Conversion of dihydroceramide into ceramide: involvement of a desaturase. Biochem J. 1997;327(Pt 1):125–132. [DOI] [PMC free article] [PubMed] [Google Scholar]
- 55.Michel C, van Echten-Deckert G, Rother J, Sandhoff K, Wang E, Merrill AH Jr. Characterization of ceramide synthesis. A dihydroceramide desaturase introduces the 4,5-trans-double bond of sphingosine at the level of dihydroceramide. J Biol Chem. 1997;272(36):22432–22437. [DOI] [PubMed] [Google Scholar]
- 56.Siebeneicher H, Cleve A, Rehwinkel H, et al. Identification and optimization of the first highly selective GLUT1 inhibitor BAY876. ChemMedChem. 2016;11:2261–2271. [DOI] [PMC free article] [PubMed] [Google Scholar]
- 57.Cai Q, Yan L, Xu Y. Anoikis resistance is a critical feature of highly aggressive ovarian cancer cells. Oncogene. 2015;34:3315–3324. [DOI] [PMC free article] [PubMed] [Google Scholar]
- 58.Derouet M, Wu X, May L, et al. Acquisition of anoikis resistance promotes the emergence of oncogenic K-ras mutations in colorectal cancer cells and stimulates their tumorigenicity in vivo. Neoplasia. 2007;9(7):536–545. [DOI] [PMC free article] [PubMed] [Google Scholar]
- 59.Szász AM, Lánczky A, Nagy Á, et al. Cross-validation of survival associated biomarkers in gastric cancer using transcriptomic data of 1,065 patients. Oncotarget. 2016;7(31):49322–49333. [DOI] [PMC free article] [PubMed] [Google Scholar]
- 60.Ryland LK, Doshi UA, Shanmugavelandy SS, et al. C6-ceramide nanoliposomes target the Warburg effect in chronic lymphocytic leukemia. PLoS One. 2013;8(12):e84648. [DOI] [PMC free article] [PubMed] [Google Scholar]
- 61.Widau RC, Jin Y, Dixon SA, Wadzinski BE, Gallagher PJ. Protein phosphatase 2A (PP2A) holoenzymes regulate death-associated protein kinase (DAPK) in ceramide-induced anoikis. J Biol Chem. 2010;285(18):13827–13838. [DOI] [PMC free article] [PubMed] [Google Scholar]
- 62.Haakenson JK, Khokhlatchev AV, Choi YJ, et al. Lysosomal degradation of CD44 mediates ceramide nanoliposome-induced anoikis and diminished extravasation in metastatic carcinoma cells. J Biol Chem. 2015;290(13):8632–8643. [DOI] [PMC free article] [PubMed] [Google Scholar]
- 63.Hu W, Xu R, Zhang G, et al. Golgi fragmentation is associated with ceramide-induced cellular effects. Mol Biol Cell. 2005;16(3):1555–1567. [DOI] [PMC free article] [PubMed] [Google Scholar]
- 64.Czubowicz K, Strosznajder R. Ceramide in the molecular mechanisms of neuronal cell death. The role of sphingosine-1-phosphate. Mol Neurobiol. 2014;50(1):26–37. [DOI] [PMC free article] [PubMed] [Google Scholar]
- 65.Guenther GG, Liu G, Ramirez MU, et al. Loss of TSC2 confers resistance to ceramide and nutrient deprivation. Oncogene. 2014;33(14):1776–1787. [DOI] [PMC free article] [PubMed] [Google Scholar]
- 66.Boppana NB, Kraveka JM, Rahmaniyan M, et al. Fumonisin B1 inhibits endoplasmic reticulum stress associated-apoptosis after FoscanPDT combined with C6-pyridinium ceramide or fenretinide. Anticancer Res. 2017;37(2):455–463. [DOI] [PMC free article] [PubMed] [Google Scholar]
- 67.Holliday MW Jr, Cox SB, Kang MH, Maurer BJ. C22:0-and C24:0-dihydroceramides confer mixed cytotoxicity in T-cell acute lymphoblastic leukemia cell lines. PLoS One. 2013;8(9):e74768. [DOI] [PMC free article] [PubMed] [Google Scholar]
- 68.Wang H, Maurer BJ, Liu YY, et al. N-(4-Hydroxyphenyl)retinamide increases dihydroceramide and synergizes with dimethylsphingosine to enhance cancer cell killing. Mol Cancer Ther. 2008;7(9):2967–2976. [DOI] [PubMed] [Google Scholar]
- 69.Tam AB, Roberts LS, Chandra V, et al. The UPR activator ATF6 responds to proteotoxic and lipotoxic stress by distinct mechanisms. Dev Cell. 2018;46(3):327–343. [DOI] [PMC free article] [PubMed] [Google Scholar]
- 70.Isakoff SJ, Engelman JA, Irie HY, et al. Breast cancer-associated PIK3CA mutations are oncogenic in mammary epithelial cells. Cancer Res. 2005;65(23):10992–10100. [DOI] [PubMed] [Google Scholar]
- 71.Vitolo MI, Weiss MB, Szmacinski M, et al. Deletion of PTEN promotes tumorigenic signaling, resistance to anoikis, and altered response to chemotherapeutic agents in human mammary epithelial cells. Cancer Res. 2009;69(21):8275–8283. [DOI] [PMC free article] [PubMed] [Google Scholar]
- 72.Berns K, Horlings HM, Hennessey BT, et al. A functional genomic approach identifies the PI3K pathway as a major determinant of trastuzamab resistance in breast cancer. Cancer Cell. 2007;12(4):395–402. [DOI] [PubMed] [Google Scholar]
- 73.Foley JM, Scholten DJ 2nd, Monks NR, et al. Anoikis-resistant subpopulations of human osteosarcoma display significant chemoresistance and are sensitive to targeted epigenetic therapies predicted by expression profiling. J Transl Med. 2015;13:110. [DOI] [PMC free article] [PubMed] [Google Scholar]
- 74.Yu M, Yongzhi H, Chen S, et al. The prognostic value of GLUT1 in cancers: a systematic review and meta analysis. Oncotarget. 2017;8:43356–43367. [DOI] [PMC free article] [PubMed] [Google Scholar]
- 75.Reckzeh ES, Karageorgis G, Schwalfenberg M, et al. Inhibition of glucose transporters and glutaminase synergistically impairs tumor cell growth. Cell Chemical Biology. 2019;26:1214–1228. [DOI] [PubMed] [Google Scholar]
- 76.Spassieva SD, Rahmaniyan M, Bielawski J, Clarke CJ, Kraveka JM, Obeid LM. Cell density-dependent reduction of dihydroceramide desaturase activity in neuroblastoma cells. J Lipid Res. 2012;53(5):918–928. [DOI] [PMC free article] [PubMed] [Google Scholar]
- 77.Ciriello G, Gatza ML, Beck AH, et al. Comprehensive molecular portraits of invasive lobular breast cancer. Cell. 2015;163(2):506–519. [DOI] [PMC free article] [PubMed] [Google Scholar]
Associated Data
This section collects any data citations, data availability statements, or supplementary materials included in this article.
Supplementary Materials
Data Availability Statement
Data in Figure 7A were generated from analysis of The Cancer Genome Atlas (TCGA)77 available at www.cbioportal.org. Data in Figure 7B were generated from analysis of breast cancer microarray data at www.kmplot.com.56