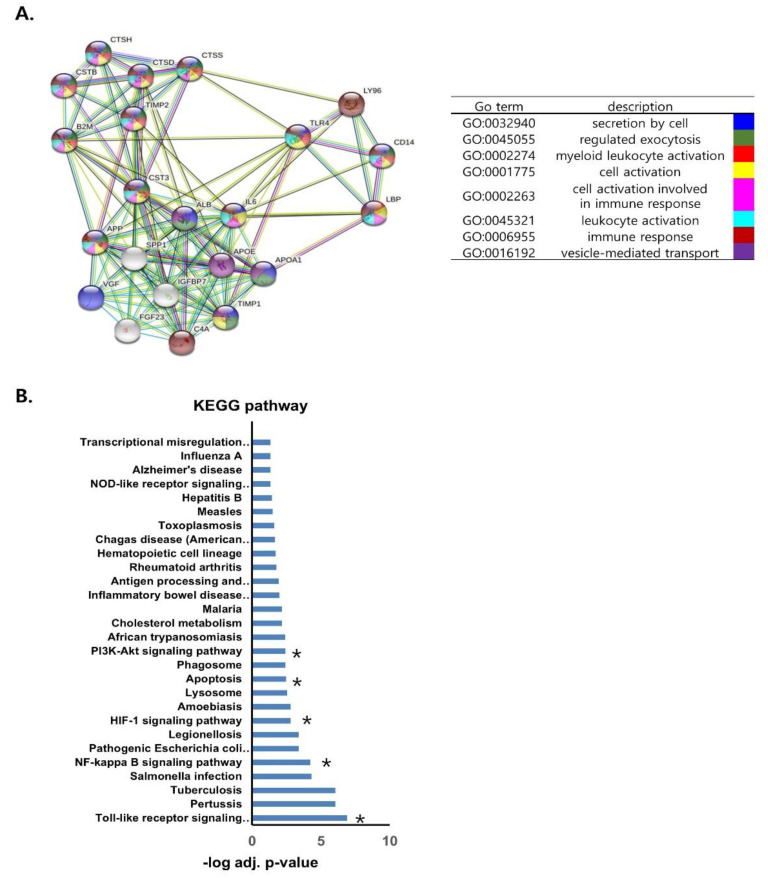
Figure 7.

Protein−protein interaction network and co−expression analysis of LBP and CST3. (A) Protein−protein interaction network of the interactors using the STRING online database. The confidence score was set to 0.4 and the interactors were set to no more than 20 with first shell of interaction for human. Red, green, blue, purple, yellow, light blue, and black lines indicate the presence of fusion evidence, neighborhood evidence, co−occurrence evidence, experimental evidence, text mining evidence, database evidence, and co-expression evidence, respectively. (B) Kyoto Encyclopedia of Genes and Genomes (KEGG) pathway analysis of differentially expressed genes. A total of 28 pathways were significantly enriched. Asterisk indicates that the pathways are associated with allograft rejection according to previous studies. * pathways which are known to be associated with rejection.
