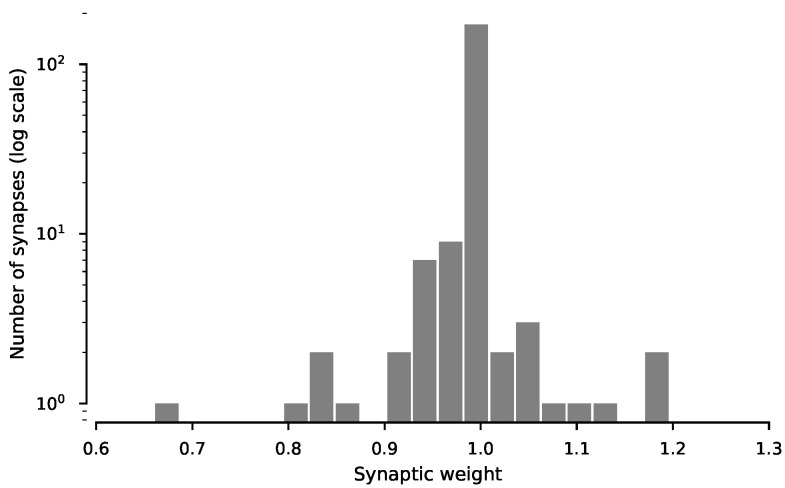
Figure A1.
Distribution of synaptic weights after initial trial. Histogram shows the distribution of synaptic weights for all synapses following a single trial (note log scale of y-axis). All weights were initialized at 1, and post-trial weights greater than 1 are potentiation while weights less than 1 are depression.

