Figure 6.
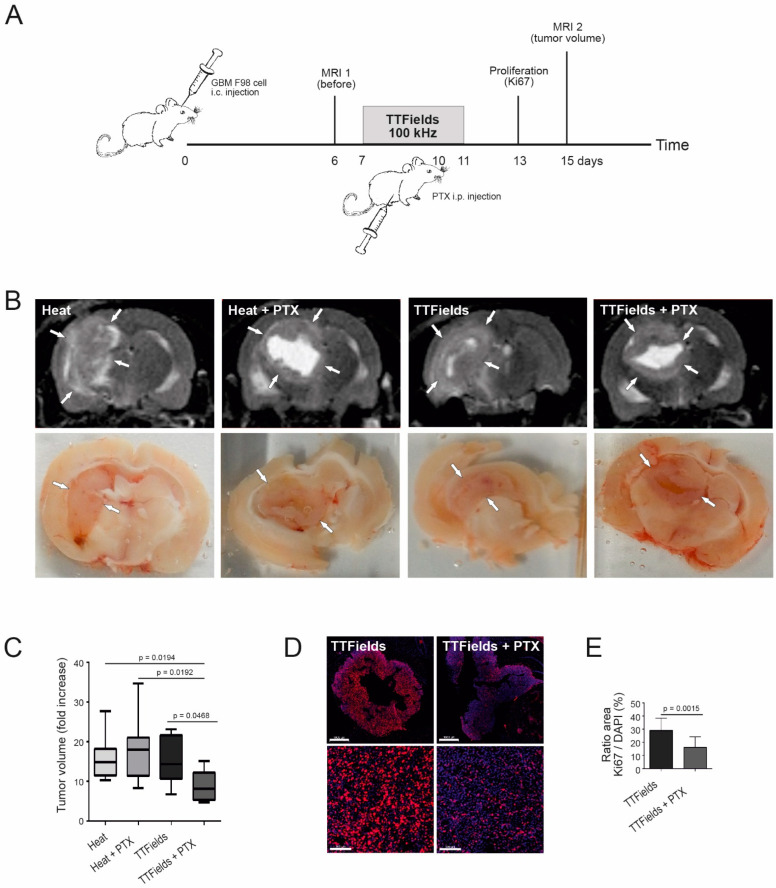
Combined TTFields and PTX treatment of rats. (A) Schematic representation of the time course. Rats (seven to eight animals per group) were injected orthotopically with GBM F98 cells. PTX (15 mg/kg) or vehicle were injected intraperitoneally on day 3 of TTFields at 100 kHz. (B) MRI scans (upper) and postmortem tissue sections (lower) at day 15 after tumor injection. Arrows indicate the tumor boundaries. (C) Quantification of the fold tumor volume increase in the different treatment groups. (D) Ki67 (red) and DAPI (blue) staining of combined TTFields-PTX treatment in the GBM tumor 3 days post-intraperitoneally 25 mg/kg PTX administration (3–4 rats per group). Scale bars = 1000 (upper) and 100 µm (lower), respectively. (E) Quantification of the Ki67/DAPI ratio showing decreased cell proliferation in the GBM tumor with the combined treatment.

