Figure 1.
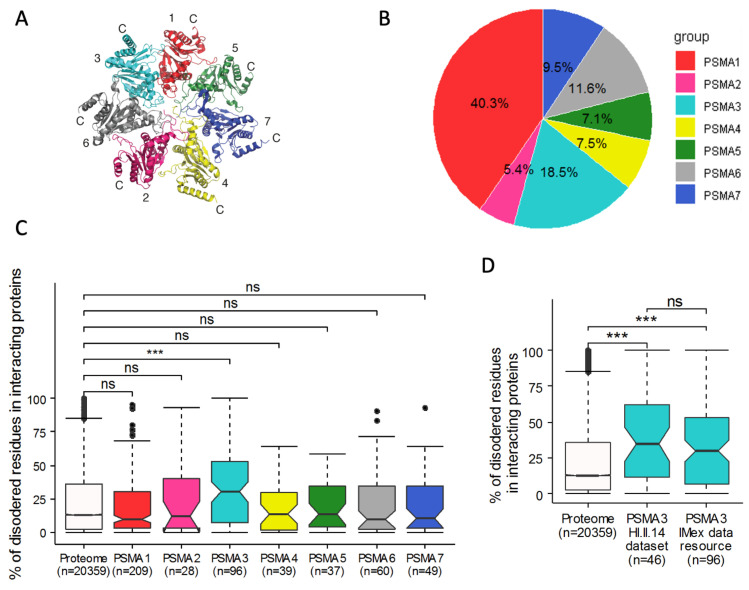
PSMA3 preferentially interacts with IDPs. (A) Crystal structure of PSMA ring [38]. PSMA subunits are identified by numbers. The N termini of the PSMA subunits protrude into the center of the ring, forming a gate restricting access into the 20S proteasome. (B) Pie chart presenting identified protein interactions of each PSMA subunit as a percentage of all identified protein interactions with PSMA subunits. We used the IMEx data resource to assemble an interaction list for the subunits. (C,D) Boxplot presenting the fraction of disordered residues found in the interacting proteins’ sequences. Non-overlapping notches provide a 95% confidence level that medians differ. Disordered residues were predicted with the IUPred algorithm. (C) Comparison of the level of disorder in proteins interacting with different PSMA subunits using IMEx data resource. (D) Distribution of PSMA3-interacting proteins from HI.II.14 dataset and IMEx data resource. The PSMA subunits are color-coded. ns (non-significant). *** p ≤ 0.001.

