Abstract
Immunochromatographic assays (ICAs) are also referred to as rapid tests, since they are simple and the results can be obtained within minutes after manually loading a few drops of a sample into each sample well of the test device. However, whole blood cannot be tested with ICA kits due to the visual hindrance caused by the color of red blood cells (RBCs), unless a cell-removing device such as a filter is mounted on the kits. Thus, when testing with blood, the advantage of the ICA kit is lost because of the additional time and machines required to coagulate and separate whole blood before preparing the serum. To overcome this limitation, whole-blood samples were added to a pretreatment solution to decolor the RBCs; the resulting mixtures were then loaded into the sample wells of the test device. The pretreating solution was composed of hydrogen peroxide (H2O2) to decolor the RBCs, Sag 471 (Osi Specialties) to restrain the mixture from vigorous foaming, sodium azide (NaN3) to inhibit the enzyme, which generates excessive foam at the beginning of decolorization, and EDTA as a chelating agent. As a result of this pretreatment, whole blood could be used with the ICA kit without reducing its simplicity and rapidity.
Immunochromatographic assay (ICA) kits are widely used for the detection of various analytes such as hormones 8, antigens 13, antibodies 19, other proteins 9, and drugs 2. Physicians and medical technicians use these assays for rapid diagnosis and therapeutic monitoring of a variety of conditions and disorders, due to the simplicity of the procedures and the rapidity of the result. ICAs are also increasingly being used by patients themselves for at-home monitoring of certain conditions and disorders. We have already developed an ICA kit for HBsAg 17. However this kit must be used with serum like most of the others, because, so far, the red blood cells (RBCs) in whole blood visually hinder kit applicability. Thus, in order to perform ICA with whole blood, it is necessary to extract the serum from the collected blood, which requires extra equipment, time, and laboratory expense.
Koenhen 7 adapted a blood separation filter in order to apply whole blood to an ICA kit. This sieve prevents the passage of the cells in the whole blood and allows only the serum to move through; however, it retards the development of the serum and is sometimes blocked by the clotting of the intact whole blood in the sample well. The drier the sample serum becomes after passing through the nitrocellulose (NC) membrane, the higher the concentration of blood salts in the sample well, which eventually ruptures the RBCs. The intracellular materials including the red pigment can then pass through the sieve and cover the NC membrane, thereby preventing a correct reading.
In order to resolve these problems, an attempt was made to remove the color from RBCs by adding a whole-blood sample to a decoloring solution and then selecting additional components to facilitate the decoloring reaction. Our results demonstrated that whole blood could be applied in an ICA kit without reducing the test's simplicity or rapidity, when the blood was first decolored with a pretreatment solution.
MATERIALS AND METHODS
ICA kit.
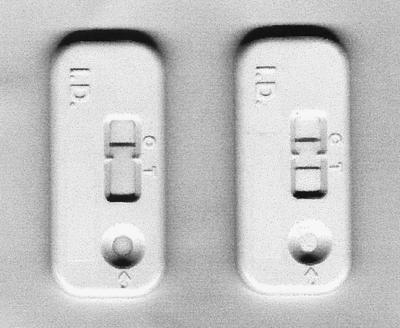
There are two major components in an ICA kit. One is a piece of 8-μm-pore-size NC membrane (Schleicher & Schuell, Dassel, Germany) which has two invisible lines on its surface, and the other is a piece of glass fiber filter containing monoclonal anti-HBs conjugated to colloidal gold particles 40 nm in diameter, which are deposited in a dry state on the surface and applied to the bottom of the membrane. Accordingly, two kinds of antibodies were separately immobilized on each line of the NC membrane. Each of them formed a separate line; that is, the horse anti-HBs (Fitzgerald) was applied on the lower part, and the goat anti-mouse immunoglobulin G (Jackson ImmunoResearch) was applied on the upper part 17. The gold particles were prepared using Frens' method 1. In brief, 6 μg of monoclonal anti-HBs was added to 1 ml of a gold particle suspension and mixed gently for 10 min. This antibody-gold particle conjugate was then blocked with bovine serum albumin (Sigma, St. Louis, Mo.) for 10 min, collected by centrifugation (11,000 × g for 1 h at 4°C), and washed twice with 50 mM Tris-HCl buffer (pH 8.0) containing 5% bovine serum albumin and 0.1% polyethylene glycol (Sigma). Finally, the conjugate was resuspended in the same buffer, and the A500 of the working suspension was adjusted to 5.0. A sheet of glass fiber filter was soaked in the conjugate suspension and dried at 37°C for 3 h. A 200-μl serum sample was added to the sample well, which reconstituted the monoclonal anti-HBs-gold particle conjugates deposited in a dry state on the surface of the glass fiber filter; thereafter, the conjugate combined with the HBsAg in the serum. After 5 min, the assay result was visible through the window; that is, the HBsAg-anti-HBs-gold particle complexes appear as a maroon line on the lower part of the NC membrane. Another maroon line in the system control area should also appear to ensure that the test result is valid (Fig. 1).
FIG. 1.
ICA kits showing a negative (left) and a positive (right) reaction against HBsAg. The serum samples were loaded into the sample well.
Selection and determination of decolorant.
In order to eliminate the color of the RBCs, whole blood was treated with phosphate-buffered saline (PBS) containing 3% H2O2 (Wako, Osaka, Japan), NaOCl (Aldrich, Milwaukee, Wis.), or KMnO4 (Sigma). A H2O2 solution (3%) was twofold serially diluted in PBS to prepare 1.5, 0.75, 0.375, 0.188, 0.094, 0.047, 0.023, 0.012, and 0.006% H2O2 solutions. Whole blood (10 μl) was added to 190 μl of each dilution; the mixture was incubated for 1 min at room temperature and then transferred into the sample well of an ICA kit. The degree of decolorizing activity was observed.
Selection and determination of antifoam.
Vigorous foaming was generated by the O2, which resulted from the decomposition of H2O2 in the whole blood after the blood was mixed with the decoloring solution; therefore, several antifoaming agents were added to the mixture to reduce the foaming. Ten microliters of 5% Sag 471 (Osi Specialties, Greenwich, Conn.), isopropyl alcohol, or polypropylene glycol was added to 180 μl of PBS containing 1.5% H2O2. Thereafter, 10 μl of whole blood was added to each solution to observe the antifoaming effect and to determine which was the most effective. PBS mixtures containing 1.5% H2O2 and Sag 471 at concentrations of 0.25, 0.125, 0.0625, 0.0313, 0.0156, 0.0078, 0.0039, 0.002, and 0.001% was prepared. Ten microliters of whole blood was added to 190 μl of each solution, and the mixture was then incubated for observation of the decolorizing and antifoaming activities.
Decoloring effect on hemolyzed or inactivated blood and temperature dependency.
The effect of the decolorizing solution on a hemolyzed or inactivated blood sample was detected using whole blood hemolyzed by freezing and thawing or inactivated by heating at 95°C for 1 min. Ten microliters of untreated hemolyzed or inactivated blood was added to tubes containing 190 μl of the decolorizing solution to observe the effect on the decolorizing activity.
In order to examine the effect of the reaction temperature on decoloring activity, all of the specimens and reagent solutions were heated or cooled to 8°C, room temperature, and 37°C. Ten microliters of whole blood was added to tubes containing 190 μl of the decoloring solution. Each mixture was transferred into a sample well of the ICA kit at the corresponding temperature. Based on the time required to obtain a result and the degree of decolorization, the optimum reaction temperature was determined.
Inhibition of catalytic enzyme.
When taking account of temperature sensitivity and heat inactivability, it was estimated that at least two kinds of enzymes are involved in the decoloring reaction and that, if the appropriate enzyme inhibitor(s) were added to the reaction mixture, this inhibitor could restrain the mixture from vigorous foaming during the initial stage of RBC decolorization. Accordingly, NaN3 (Sigma) was applied to inhibit the catalase 14 that generates O2 from H2O2. NaN3 (0.05%)–1.5% H2O2 in PBS was diluted with additional PBS containing 1.5% H2O2, using the twofold serial dilution method, and the resulting NaN3 concentrations of each solution were 0.05, 0.025, 0.0125, 0.006, 0.003, 0.0016, 0.0008, 0.0004, and 0.0002%. Ten microliters of whole blood was added to 190 μl of each solution to observe the effect on the decoloring and antifoaming activities.
Effect of anticoagulant on decoloring activity.
To examine the effects of certain anticoagulants on the decolorizing activity of the decoloring solution, Eppendorf tubes were treated with heparin (178 U/mg [Sigma]), 0.1 M EDTA (Sigma), and 1.0 M citrate buffer (pH 7.2). Whole blood was collected into the tubes from the tail veins of BALB/c mice anesthesized by inhalant methoxyflurane (Metofane, Mallinckrodt Veterinary, Inc., St. Louis, Mo.). Ten microliters of whole blood was added to 190 μl of the decoloring solution. The resulting decoloring activity was observed.
Determination of sample amount.
In order to determine the optimum amount of whole blood to apply, various amounts of whole blood (10, 20, 30, and 40 μl) were added into 190, 180, 170, and 160 μl of the pretreatment solution, respectively, composed of PBS, 1.5% H2O2, 0.03% Sag 471, 0.05% NaN3, and 5 mM EDTA. The effect on the decoloring activity was then observed.
RESULTS
Selection and determination of decolorant.
When 10 μl of whole blood was added to 190-μl solutions of PBS containing either 3% H2O2, 0.01 M NaOCl, or 0.01 M KMnO4, the blood added to the H2O2 solution was decolored with vigorous foaming. This allowed the blood to mix with the decoloring solution rapidly without any agitation, plus the red color of the RBCs was quickly changed to dark brown initially and finally became white within a minute. The blood added to the NaOCl and the KMnO4 solutions sank to the bottom, and the color slowly changed to dark brown after agitation.
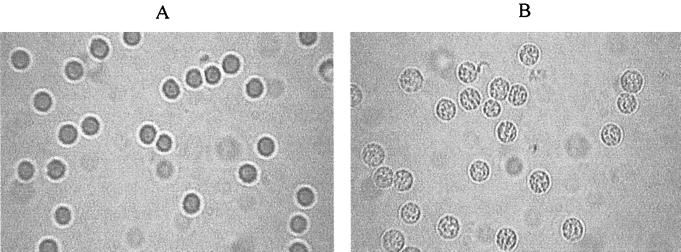
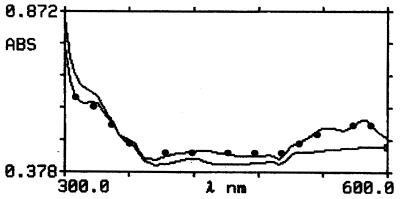
The blood cells were not disrupted but changed morphologically after decolorization. The morphology of the RBCs after discolorization with H2O2 was somewhat changed when compared with that of untreated RBCs (Fig. 2). The latter were smooth; however, the former had many spots on their surfaces. Figure 3 shows the scanning properties of the untreated and the decolored blood suspensions. The absorbency of the decolored suspension was markedly reduced between 520 and 600 nm, yet it somewhat increased between 300 and 320 nm, compared with that of the untreated suspension.
FIG. 2.
H2O2-induced changes in cell shape. Light micrographs of RBCs (5% suspension) in PBS (A) or exposed to 1.5% H2O2 in PBS (B). Magnification, ×100.
FIG. 3.
Scanning profile of untreated and decolored blood suspensions. The absorbency of the decolored suspension (——) was markedly reduced between 520 and 600 nm, yet it was somewhat increased between 300 and 320 nm, compared with that of the untreated suspension (•——•).
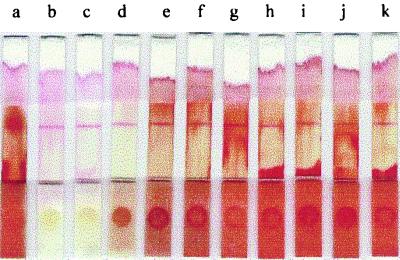
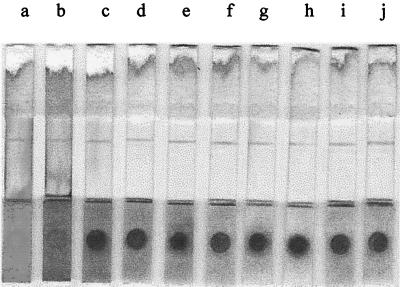
The decoloring reaction was dependent on the concentration of the H2O2 in the decoloring solution (Fig. 4). The color of RBCs on the sample pad was completely changed to white for concentrations of greater than 1% H2O2 (Fig. 4b and c); however, there was no change in color with concentrations of less than 0.1% H2O2 (Fig. 4g, h, i, j, and k). The degree of decoloration was dependent on the H2O2 concentration, and this was clearly exhibited on the sample pads under the NC membranes. The strips showed good results even though the decoloration was not enough to become white between the two concentrations (0.1 to ∼1%). The color of the blood sample pretreated with 0.75% H2O2 was close to white (Fig. 4d), whereas that pretreated with 0.38% H2O2 was brown (Fig. 4e) and that pretreated with 0.2% H2O2 was red (Fig. 4f). Therefore, the proper concentration of H2O2 in the decoloring solution was determined to be 1.5% when pretreating 10 μl of whole blood with 190 μl of the decoloring solution.
FIG. 4.
Effect of various concentrations of H2O2 on whole blood. Lanes: a, no H2O2; b, 3% H2O2; c, 1.5% H2O2; d, 0.75% H2O2; e, 0.38% H2O2; f, 0.19% H2O2; g, 0.1% H2O2; h, 0.05% H2O2; i, 0.025% H2O2; j, 0.01% H2O2; and k, 0.005% H2O2. The red color (a) was changed to white (b and c) or brown (d, e, and f), or it was not changed at all (g, h, i, j, and k). The reading of the results was not visually hindered by the RBCs in the case of lanes b, c, and d.
Selection and determination of antifoam.
Ten microliters of a mixture containing 5% Sag 471 in either PBS, isopropyl alcohol, or polypropylene glycol was added to the decoloring solution (1.5% H2O2 in PBS), and then 10 μl of whole blood was added to 190 μl of each of these solutions to observe and compare the antifoaming effects. As soon as the whole blood was added to the tubes containing the decoloring solution and each antifoam, foams initially were vigorously generated, yet most of them disappeared quite quickly. This effect was particularly rapid in the tubes containing Sag 471 in PBS and in polypropylene glycol, whereas it occurred more slowly in the tube with isopropyl alcohol. When the sample mixtures were loaded into each sample well of the ICA kit, these antifoams somewhat retarded the developing rate of the sample, comparing with Sag 471. Therefore, Sag 471 was selected as the most suitable antifoaming agent for the ICA kit.
When 10 μl of whole blood was added to 190 μl of the decoloring solution containing 0.25, 0.125, 0.062, 0.031, 0.016, 0.008, 0.004, 0.002, or 0.001% Sag 471, RBCs were slightly lysed in the tubes containing more than 0.1% Sag 471 (Fig. 5b and c), whereas the antifoaming effect was somewhat retarded in tubes with less than 0.01% Sag 471. Therefore, the proper concentration of Sag 471 in the pretreatment solution to prevent vigorous foaming was determined to be 0.016% for pretreating 10 μl of whole blood with 190 μl of the pretreatment solution. However, excessive foaming at the beginning of the decoloring reaction was unavoidable.
FIG. 5.
Effect of 1.5% H2O2 and various concentrations of Sag 471 on whole blood. Lanes: a, no H2O2 and Sag 471; b, 0.25% Sag 471; c, 0.125% Sag 471; d, 0.062% Sag 471; e, 0.031% Sag 471; f, 0.016% Sag 471; g, 0.008% Sag 471; h, 0.004% Sag 471; i, 0.002% Sag 471; j, 0.001% Sag 471. The RBCs were lysed with high concentrations of Sag 471 (b and c), which resulted in the staining of the NC membrane; however, there was no visual hindrance with low concentrations (d, e, f, g, h, i, and j)
Decoloring effect on hemolyzed or inactivated blood and temperature dependency.
When 10 μl of intact whole or lysed blood was added to tubes containing 190 μl of the pretreatment solution, the color of the RBCs rapidly, i.e., within a minute, changed from red to dark brown and finally to white with mild foaming; however, for heat-inactivated blood no foam was generated, and there was no color change. Accordingly, it would seem that there is an active component(s) in RBCs which is related to decolorization and foaming.
When 10 μl of whole blood was added to each tube containing 190 μl of pretreatment solution at room temperature or 37°C, the color of the RBCs rapidly changed from red to dark brown and finally to white with mild foaming; however, at 8°C very little foam was generated, and the color change was very slow from red to dark brown. Accordingly, it would seem that the active component(s) in RBCs is an enzyme(s), based on the heat-labile and temperature-sensitive characteristics of the reaction.
Inhibition of catalytic enzyme.
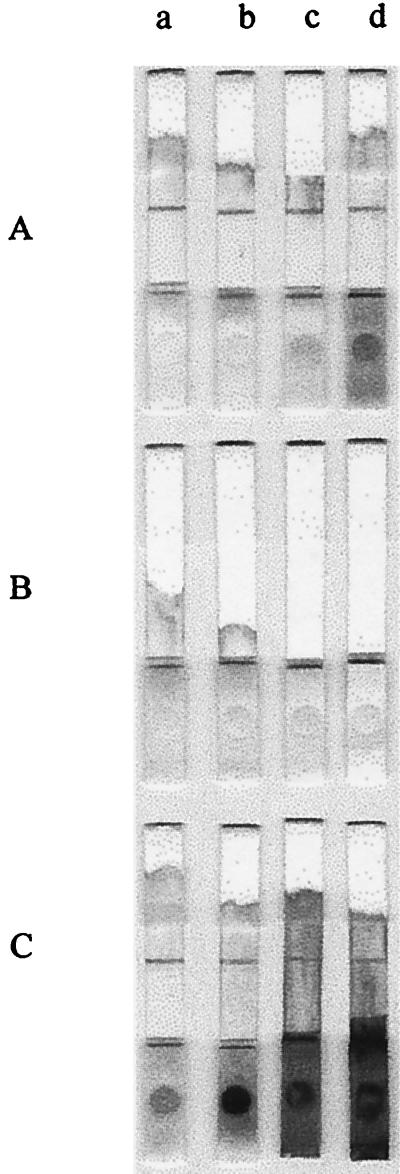
When 10 μl of whole blood was added to 190 μl of the pretreatment solution (1.5% H2O2 and 0.016% Sag 471 in PBS) containing 0.05, 0.025, 0.012, 0.006, 0.003, 0.0015, 0.0008, 0.0004, or 0.0002% NaN3, the foaming was immediately and remarkably reduced; however, the color completely changed to white in all of the tubes with the same rapidity as previously. NaN3 inhibited the catalase in a broad range of concentrations, although the RBCs were more slowly decolorized in the tubes containing more than 0.02% NaN3. It would seem that almost all of the enzyme was inhibited, and this prevented the generation of OH⋅ that bleaches the heme at concentrations of NaN3 greater than 0.02%, whereas the catalase was partially inhibited at concentrations of NaN3 less than 0.02%. However, when these pretreated whole blood samples were loaded into each sample well of an ICA kit, the individual samples did not develop and stay in the sample wells, since NaN3 couldn't inhibit the catalase so completely that small amounts of foams would be generated and block the micropores of the NC membrane which the sample should move through (Fig. 6B). This blocking was resolved by including 0.016% Sag 471 in the solutions (Fig. 6A). Sag 471 restrained the foaming and helped the mixture to pass through the pores of the membrane. We determined that 0.003% is the optimum concentration of NaN3 for pretreating 10 μl of whole blood with 190 μl of the pretreatment solution so that excessive foaming is prevented in the reaction mixture at the beginning of the decoloring reaction. At this NaN3 concentration, the developing patterns and signals on each membrane were more visible than the patterns and signals at other NaN3 concentrations, even though they were almost identical.
FIG. 6.
Effect of 1.5% H2O2, 0.016% Sag 471, 0.003% NaN3, and/or 5mM EDTA on whole blood. (A) Solution containing all four components. (B) Solution containing H2O2, NaN3, and EDTA. (C) Solution containing H2O2, Sag 471, and EDTA. Lanes: a, 10 μl of whole blood; b, 20 μl of whole blood; c, 30 μl of whole blood; d, 40 μl of whole blood. Sag 471 somewhat reduced the decoloring activities of H2O2 (C); however, this activity was recovered by the addition of NaN3 (A). NaN3 helped H2O2 to effectively decolor RBCs yet restrained the mixture from developing through the NC membrane (B).
Effect of anticoagulant on decoloring activity.
When 10 μl of whole blood treated with one or two kinds of anticoagulants was added to tubes containing 190 μl of the pretreatment solution, the color of the RBCs treated with EDTA changed a little more rapidly from red to dark brown and finally to white with mild foaming than there in blood treated with citrate or heparin, regardless of the presence of other anticoagulants. It was believed that the EDTA enhanced the release of iron ions by chelating with them and thereby reducing the concentration of free iron ions. Consequently, the optimum composition of the pretreatment solution was determined to be 1.5% H2O2, 0.016% Sag 471, 0.003% NaN3, and 5 mM EDTA in PBS.
Determination of sample amount.
When different volumes (10, 20, 30, and 40 μl, respectively) of blood samples were added to 190, 180, 170, and 160 μl of the pretreatment solution (resulting in 1:20 to 1:5 dilutions of blood), the RBCs were sufficiently decolored that the results could be read without any visual hindrance, even when the cells were not fully decolorized on the sample pad loaded with 40 μl of whole blood (Fig. 5a through d). As shown in Fig. 5, when the volume of blood sample added to the pretreatment solution decreased the general degree of decolorization increased (Fig. 6A). This effect was also seen when the whole blood was pretreated with 1.5% H2O2 and 0.003% NaN3 in PBS (Fig. 6B) or with 1.5% H2O2 and 0.016% Sag 471 in PBS (Fig. 6C); however, the decoloring effect of 1.5% H2O2 and 0.003% NaN3 in PBS was strong throughout the whole range of blood volumes, whereas that of 1.5% H2O2 and 0.016% Sag 471 in PBS was evident only for a narrow range of blood volumes (<20 μl of whole blood). With each additional 10 μl of blood (Fig. 6A through C, lanes a), the decoloring effect of Sag 471 on the RBCs was further reduced, yet this effect was somewhat recovered by the addition of NaN3 (Fig. 6A, lane a).
DISCUSSION
NaOCl seemed to be a weaker bleaching agent than H2O2, in contrast to the result of Iakutova et al. 4, because the RBCs had no enzymes to decompose the NaOC1; therefore, the NaOC1 needed more time to move to the center, depending on the gradient, compared with the H2O2, although NaOCl was more efficient than H2O2 4.
Sharma and Premachandra 16 studied the effect of H2O2 on the RBC membrane protein composition and concluded that the membrane-bound hemoglobin (Hb) content increases when RBCs are incubated with increasing concentrations of H2O2. This view was supported by the microscopic observations in this study, which confirmed that the smooth surface of the intact RBCs was changed after treatment with H2O2. There were many sporadic lumps on the membrane of the treated cells.
Sadrzadeh et al. 12 emphasized that the addition of H2O2 to Hb results in the decomposition of H2O2, the generation of a hydroxy radical (OH⋅), and the oxidation of Hb to methemoglobin (metHb) due to the reaction between the ferrous heme iron and H2O2. Titov et al. 18 reported that oxy-Hb is oxidized to metHb with a low concentration (10−7 M) of H2O2, and Puppo and Halliwell 11 stated that an excess of H2O2 degrades metHb, thereby releasing iron ions that react with H2O2 to form a species that appears to be OH⋅. It is therefore metHb that brings out the dark color 5, which can be discriminated from red oxy-Hb by this color difference. It was observed that the RBCs were discolored to a dark brown with the initial addition of H2O2 and then gradually changed to white. It would appear that H2O2 was able to move across the membrane 15; however, since the concentration of H2O2 at the beginning was low, the RBCs were oxidized to Met-Hb and discolored to dark brown; subsequently as the H2O2 concentration increased in the RBCs and the excess H2O2 degraded the Met-Hb, the released iron ions caused the RBCs to be decolored.
There have been various reports concerning the release of the iron ion from heme. Harel et al. 3 reported that the iron ion can be released from metmyoglobin, Met-Hb, and cytochrome c by the addition of H2O2. Mehlhorn and Gomez 10 reported that the oxidants arising from the reaction of the heme proteins with hydroperoxides oxidatively cleave the porphyrin ring, resulting in the release of iron ions and the bleaching of metmyoglobin. Karuzina and Bachmanova 6 reported that the H2O2 in the hemoprotein active center interacts with iron ions, thereby generating the OH⋅ that bleaches the heme. In this study the added H2O2 was able to move across the membrane and reach the active center, and the driving force was mainly the gradient of the H2O2 concentration. The catalase in the cell then decomposed H2O2 into H2O and O2; therefore, the gradient stayed high, and the H2O2 continue to move quickly towards the active center.
Sag 471 is used in industry to restrain culture broths from foaming during production of antibiotics by bacterial or fungal fermentation, and it is included as a component in the culture medium from the start. The manufacturer (Osi Specialties) emphasizes that it be a kind of silicone antifoam compound and suggests a starting concentration of 10 to 200 ppm. The effective concentration in this study (0.016%) was 160 ppm, which is within the recommended range.
The combination of decolored blood with an ICA kit has many advantages compared with using serum. First, an ICA kit can be used on the spot because there is no need for the machines and additional time to prepare serum. This advantage can help first-aid personnel safely to treat wounds at an accident location after checking for infectious diseases and the presence of drugs with the appropriate ICA kit. Next, this method minimizes the risk of inadvertent infection during sample treatment because it reduces the processes required to prepare serum and the possibility of exposure to infectious agents. Therefore, this method of applying whole blood to an ICA kit after decoloring the blood sample with a pretreatment solution comprising 1.5% H2O2, 0.016% Sag 471, 0.003% NaN3, and 5 mM EDTA in PBS is very convenient.
REFERENCES
- 1.Frens G. Controlled nucleation for the regulation of the particle size in monodisperse gold solutions. Nature Phys Sci. 1973;241:20–22. [Google Scholar]
- 2.Habib M P, Schifman R B, Shon B Y, Fiastro J F, Campbell S C. Evaluation of whole blood theophylline enzyme immunochromatography assay. Chest. 1987;92:129–131. doi: 10.1378/chest.92.1.129. [DOI] [PubMed] [Google Scholar]
- 3.Harel S, Salan M, Kanner J. Iron release from metmyoglobin, methaemoglobin and cytochrome c by a system generating hydrogen peroxide. J Free Radic Res Commun. 1988;5:11–19. doi: 10.3109/10715768809068554. [DOI] [PubMed] [Google Scholar]
- 4.Iakutova E S, Osipov A N, Kostenko O V, Arnkhol'd I, Arnol'd K, Vladimirov I A. Interaction of hypochlorite with oxyhemoglobin leads to liberation of iron in a catalytically active form. Biofizika. 1992;37:1021–1028. [PubMed] [Google Scholar]
- 5.Jaffe E R. Methaemoglobinaemia. Clin Haematol. 1981;10:99–122. [PubMed] [Google Scholar]
- 6.Karuzina I I, Bachmanova G I. Self-inactivation of cytochrome P-450 in the catalytic cycle. Archakov AI Vestn Ross Akad Med Nauk. 1995;2:17–29. [PubMed] [Google Scholar]
- 7.Koenhen, B. August 1993. U.S. patent 5,240,862.
- 8.Laitinen M P, Vuento M. Immunochromatographic assay for quantitation of milk progesterone. Acta Chem Scand. 1996;50:141–145. doi: 10.3891/acta.chem.scand.50-0141. [DOI] [PubMed] [Google Scholar]
- 9.Lou S C, Patel C, Ching S, Gordon J. One-step competitive immunochromatographic assay for semiquantitative determination of lipoprotein (a) in plasma. Clin Chem. 1993;39:619–624. [PubMed] [Google Scholar]
- 10.Mehlhorn R J, Gomez J. Hydroxyl and alkoxyl radical production by oxidation products of metmyoglobin. Free Radic Res Commun. 1993;18:29–41. doi: 10.3109/10715769309149911. [DOI] [PubMed] [Google Scholar]
- 11.Puppo A, Halliwell B. Formation of hydroxyl radicals from hydrogen peroxide in the presence of iron. Is haemoglobin a biological Fenton reagent? Biochem J. 1988;249:185–190. doi: 10.1042/bj2490185. [DOI] [PMC free article] [PubMed] [Google Scholar]
- 12.Sadrzadeh S M, Graf E, Panter S S, Hallaway P E, Eaton J W. Hemoglobin: a biologic fenton reagent. J Biol Chem. 1984;259:14354–14356. [PubMed] [Google Scholar]
- 13.Sato K, Ichiyama S, Iinuma Y, Nada T, Shimokata K, Nakashima N. Evaluation of immunochromatographic assay systems for rapid detection of hepatitis B surface antigen and antibody, Dainascreen HBsAg, and Dainascreen Ausab. J Clin Microbiol. 1996;34:1420–1422. doi: 10.1128/jcm.34.6.1420-1422.1996. [DOI] [PMC free article] [PubMed] [Google Scholar]
- 14.Schaefer W H, Harris T M, Guengerich F P. Characterization of the enzymatic and nonenzymatic peroxidative degradation of iron porphyrins and cytochrome P-450 heme. Biochemistry. 1985;24:3254–3263. doi: 10.1021/bi00334a027. [DOI] [PubMed] [Google Scholar]
- 15.Schwartz C E, Krall J, Norton L, McKay K, Kay D, Lynch R E. Catalase and superoxide dismutase in Escherichia coli. J Biol Chem. 1983;258:6277–6281. [PubMed] [Google Scholar]
- 16.Sharma R, Premachandra B R. Membrane-bound hemoglobin as a marker of oxidative injury in adult and neonatal red blood cells. Biochem Med Metab Biol. 1991;46:33–44. doi: 10.1016/0885-4505(91)90048-p. [DOI] [PubMed] [Google Scholar]
- 17.Shin H S, Kim Y B, Shin J W, Kim C K, Lee W S, Kim H K, Shin K S. The evaluation of a rapid immunochromatographic assay kit for rapid detection hepatitis B surface antigen. J Korean Soc Virol. 1997;27:137–141. [Google Scholar]
- 18.Titov V, Petrenko I M, Petrov V A, Vladimirov I A. Mechanism of oxyhemoglobin oxidation induced by hydrogen peroxide. Biull Eksp Biol Med. 1991;112:46–49. [PubMed] [Google Scholar]
- 19.Vaughn D W, Nisalak A, Kalayanarooj S, Solomon T, Dung N M, Cuzzubbo A, Devine P L. Evaluation of a rapid immunochromatographic test for diagnosis of dengue virus infection. J Clin Microbiol. 1998;36:234–238. doi: 10.1128/jcm.36.1.234-238.1998. [DOI] [PMC free article] [PubMed] [Google Scholar]


