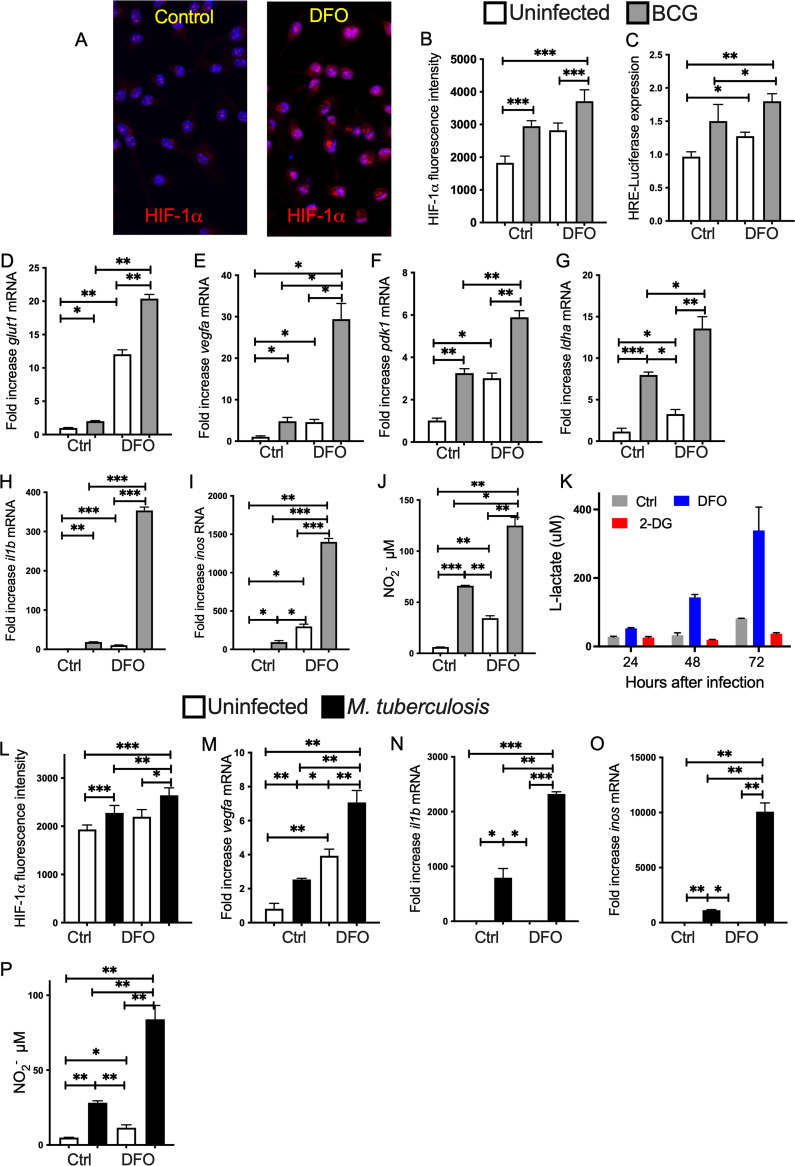
FIG 2.
DFO stimulates HIF-1-mediated immune and metabolic responses in BCG and M. tuberculosis-infected BMM. (A and B) BMM were infected with BCG and treated with 100 μM DFO starting 4 h after infection or left untreated. (A) The micrograph of HIF-1α immunolabeling 24 h after DFO treatment in noninfected cultures. The fluorescence intensity of HIF-1α was determined in triplicate independent cultures (4 determinations per slide). (B) The mean HIF-1α intensity per cell ± SEM in one representative sample is shown. Differences are significant at *, P ≤ 0.05; **, P ≤ 0.01; and ***, P ≤ 0.001, one-way ANOVA with Welch’s correction. (C) The relative HRE activity in RAW macrophages treated or not with DFO was evaluated 24 h after BCG infection. The mean relative luciferase levels ± SEM are in triplicated cultures are depicted. One of two experiments is depicted. Differences are significant at *, P ≤ 0.05; **; P ≤ 0.01; and ***, P ≤ 0.001 001, one-way ANOVA with Welch’s correction. (D to I) Total RNA was extracted 24 h after treatment and the levels of glut1 (D), vegfa (E), pdk1 (F), ldha (G), il1b (H), and inos (I) mRNA were measured by real-time PCR. The mean fold increase of mRNA concentration in triplicate cultures ± SEM compared to an uninfected and untreated control ± SEM is depicted. One out of at least 3 experiments is depicted. Differences are significant at **, P ≤ 0.01 and ***, P ≤ 0.001, one-way ANOVA test with Welch’s correction. (J) The concentration of nitrite in the supernatants of BCG-infected and or DFO-treated BMM was measured 48 h after culture. The mean levels of NO2− ± SEM in independent triplicates was measured by Griess assay. Differences are significant at **, P ≤ 0.01 and ***, P ≤ 0.001, one-way ANOVA test with Welch’s correction. (K) The lactate concentration was measured in the supernatants of BMM cultures after treatment with either 100 μM DFO or 300 μM 2-DG at different times after BCG infection. (L) HIF-1α was labeled in BMM infected with M. tuberculosis and treated with 100 μM DFO starting 4 h after infection or left untreated. The mean HIF-1α intensity per cell ± SEM in one representative of 3 independent samples is shown. Differences are significant at *, P ≤ 0.05; **, P ≤ 0.01; and ***, P ≤ 0.001 one-way Welch’s test ANOVA. (M to O) The fold increase of vegfa (M), il1b (N), and inos (O) transcripts in BMM cultures 24 h after M. tuberculosis infection treated or not with DFO as indicated above (n = 3 per group) ± SEM are depicted. Differences are significant at *, P ≤ 0.05; **, P ≤ 0.01; and ***, P ≤ 0.001, one-way Welch’s ANOVA test. (P) The concentration of nitrite in the supernatants of M. tuberculosis-infected and or DFO-treated BMM was measured 72 h after culture. Differences are significant at *, P ≤ 0.05 and **, P ≤ 0.01 one-way Welch’s ANOVA test.

