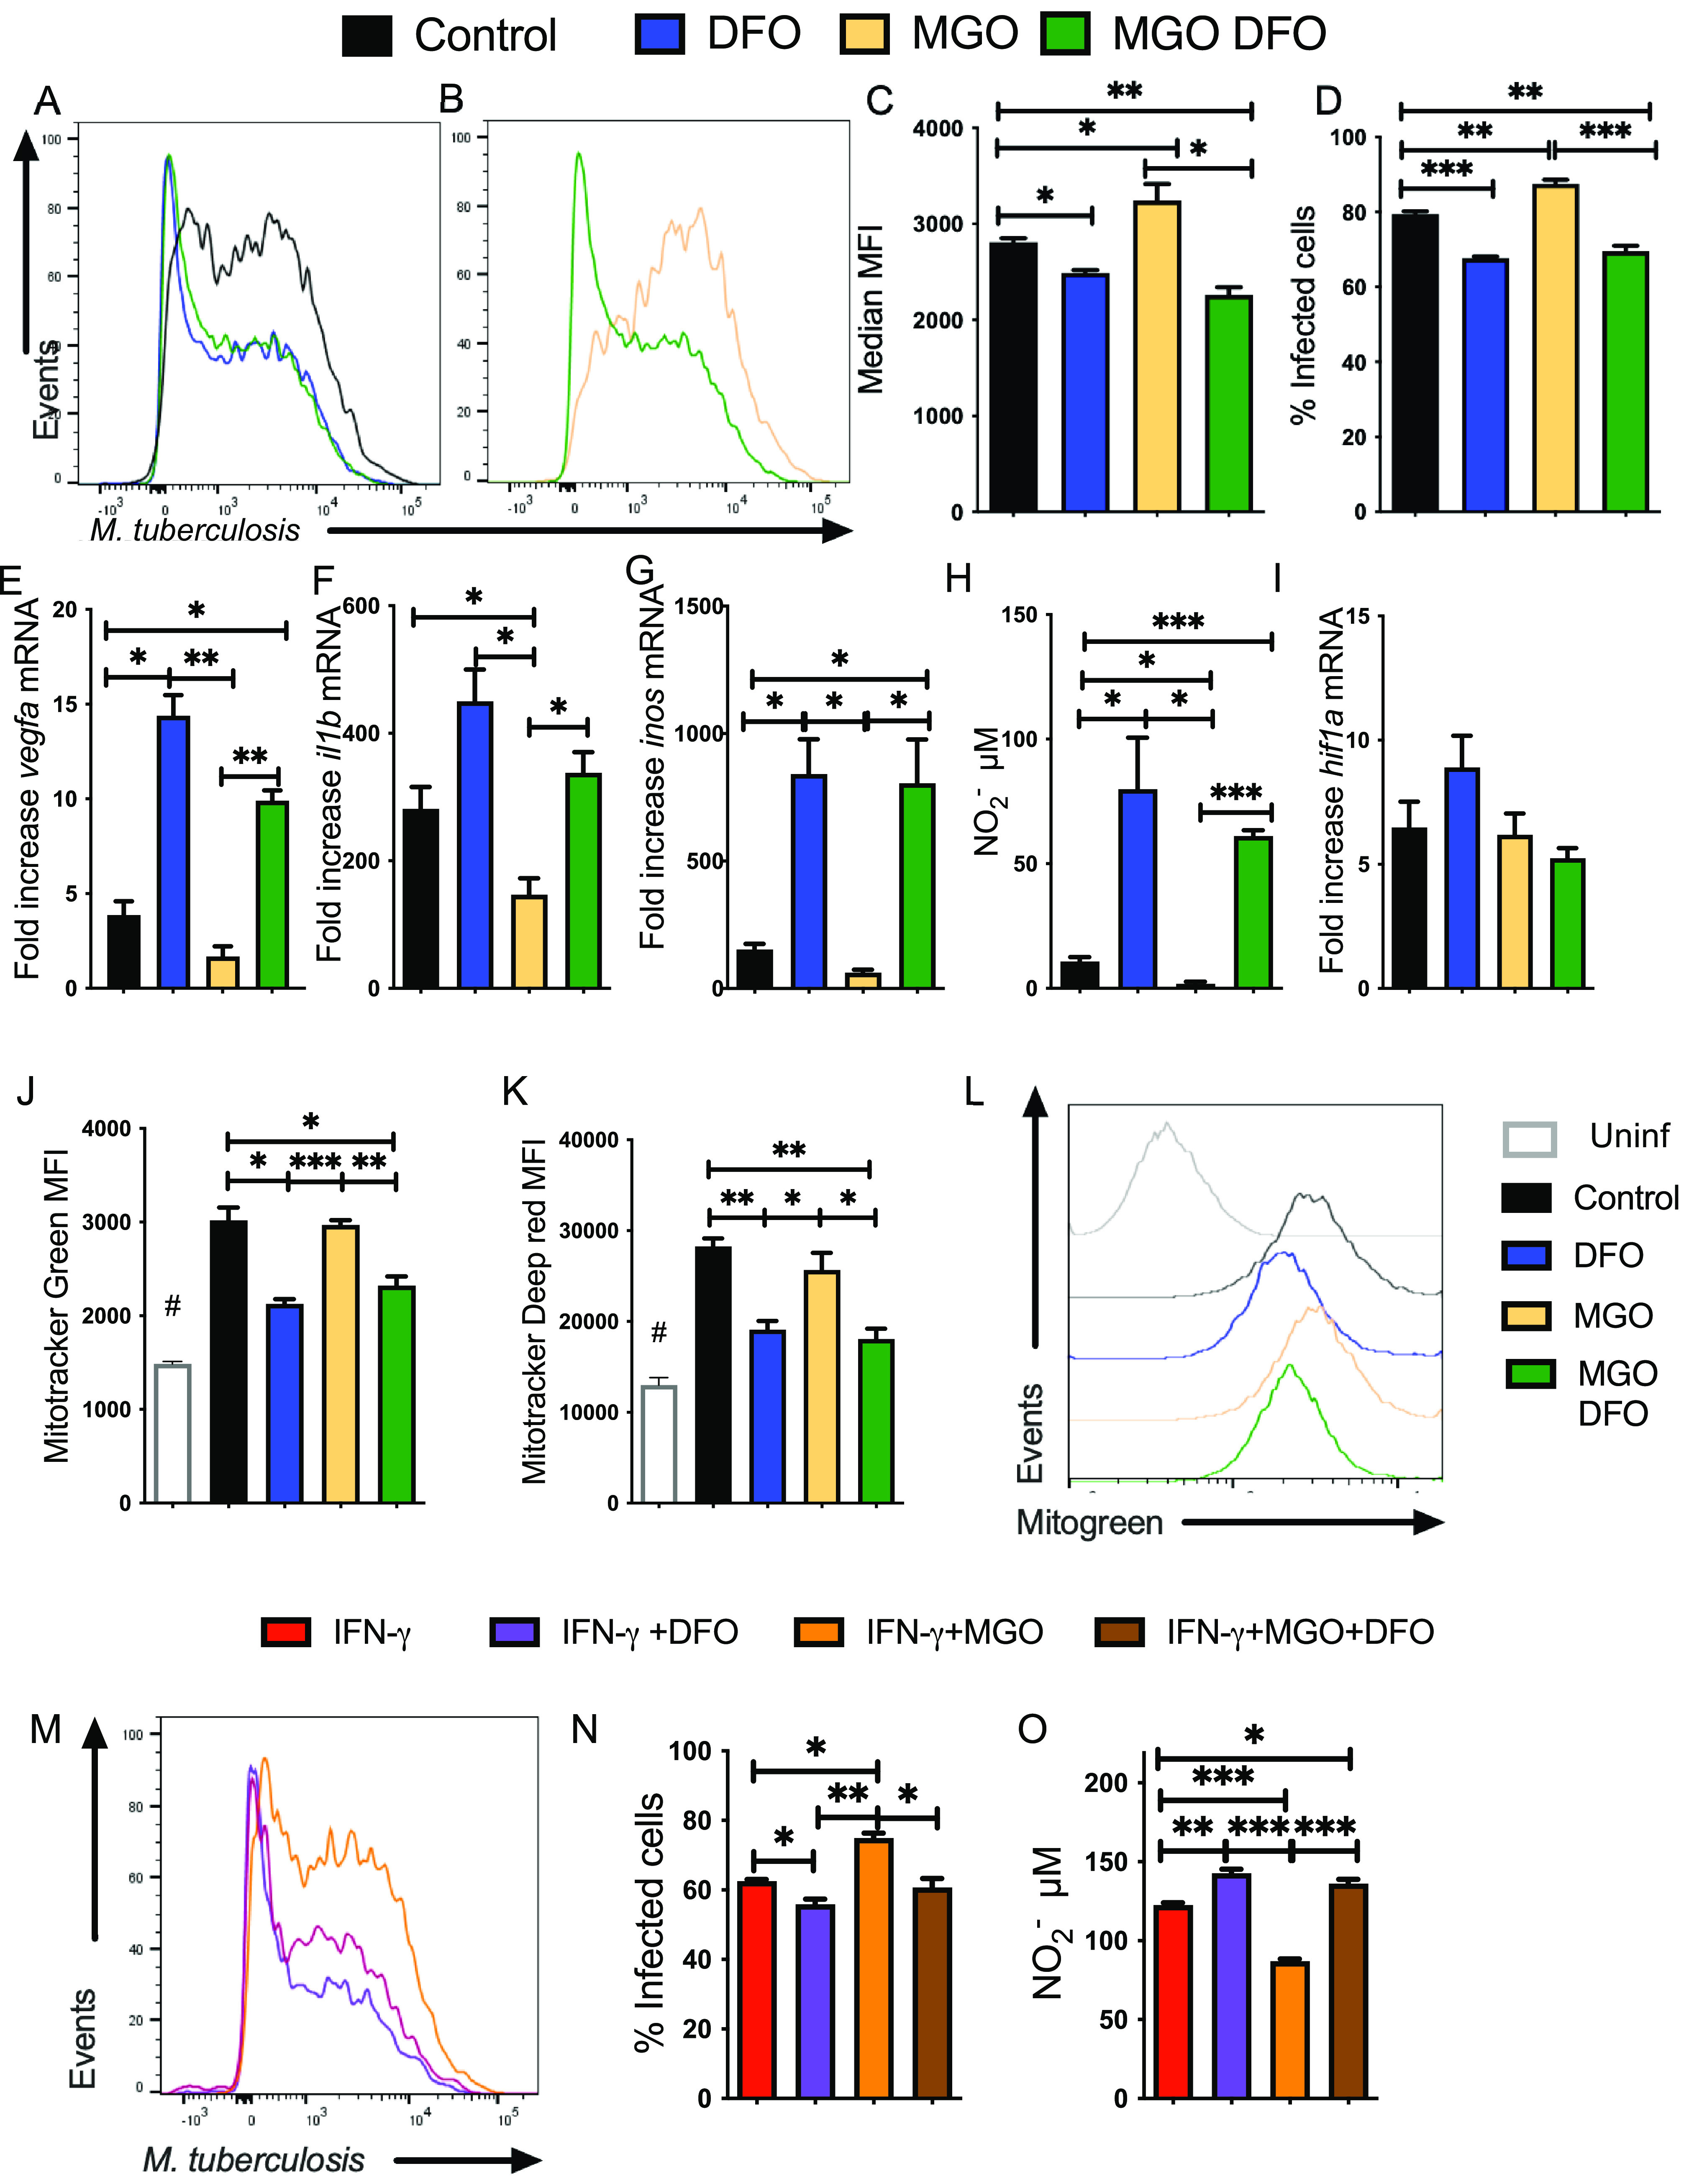
FIG 6.

DFO reverts the MGO-hampered HIF-1-mediated responses and the enhanced susceptibility to M. tuberculosis infection of BMM. (A to D) A group of BMM cultures were treated with MGO. Four hours later, MGO-treated and control BMM were infected with M. tuberculosis-gfp (MOI 1:1). BMM were either treated with 100 μM DFO or left untreated 4 h after infection. Representative histograms (A and B), the mean M. tuberculosis-gfp MFI (C), and the mean percentage of infected BMM (D) at 5 days after infection are shown. Differences are significant at *, P ≤ 0.05; **, P ≤ 0.01; and ***, P ≤ 0.001, one-way ANOVA test with Welch’s adjustment. (E to G and I) BMM were incubated with MGO and 1 h after being infected with M. tuberculosis. MGO-treated or control BMM were further incubated with DFO 4 h after infection. The mean fold increase of vegfa (E), il1b (F), inos (G), and hif1a (I) mRNA was measured in triplicate BMM cultures ± SEM was measured by RT-PCR. Differences are significant at *, P ≤ 0.05 and **, P ≤ 0.01, one-way ANOVA test with Welch’s correction. (H) The mean concentration of nitrite ± SEM in supernatants of MGO and/or DFO-treated, M. tuberculosis-infected BMM was measured 72 h after culture. Differences are significant at *, P ≤ 0.05 and ***, P ≤ 0.001, one-way, Welch’s adjusted, ANOVA test. (J to L) BMM were either treated with MGO 4 h before BCG infection and/or with DFO 4 h after infection. A group of BMM was left uninfected. Forty-eight hours after infection, BMM were incubated with Mito tracker Green (I) or Mito tracker Deep Red (J) for 30 min at 37°C. The mean fluorescence intensity of the different groups (n = 3 per group) ± SEM and representative histograms of Mito Tracker Green-labeled cells (K) are shown. This experiment was repeated three times. Differences are significant at *, P ≤ 0.05, **, P ≤ 0.01; and ***, P ≤ 0.001, one-way Welch’s adjusted ANOVA test. #, Differences with the uninfected group are statistically significant. (M and N) BMM was treated with IFN-γ 48 h before infection with M. tuberculosis. Further, a group of BMM was treated with MGO 4 h before infection. MGO-treated and control BMM were infected with M. tuberculosis-gfp. Four hours after infection, BMM were either treated with 100 μM DFO or left untreated. Representative histograms (M) and the mean percentage of infected BMM ± SEM (N) quantified 5 days after infection are shown. Differences are significant at *, P ≤ 0.05 and **, P ≤ 0.01, one-way ANOVA test with Welch’s correction. (O) The nitrite concentration in supernatants of IFN-γ-activated BMM treated with MGO and/or DFO treated was measured 72 h after infection with M. tuberculosis. Differences are significant at *, P ≤ 0.05; **, P ≤ 0.01; and ***, P ≤ 0.001, one-way Welch ANOVA test.
