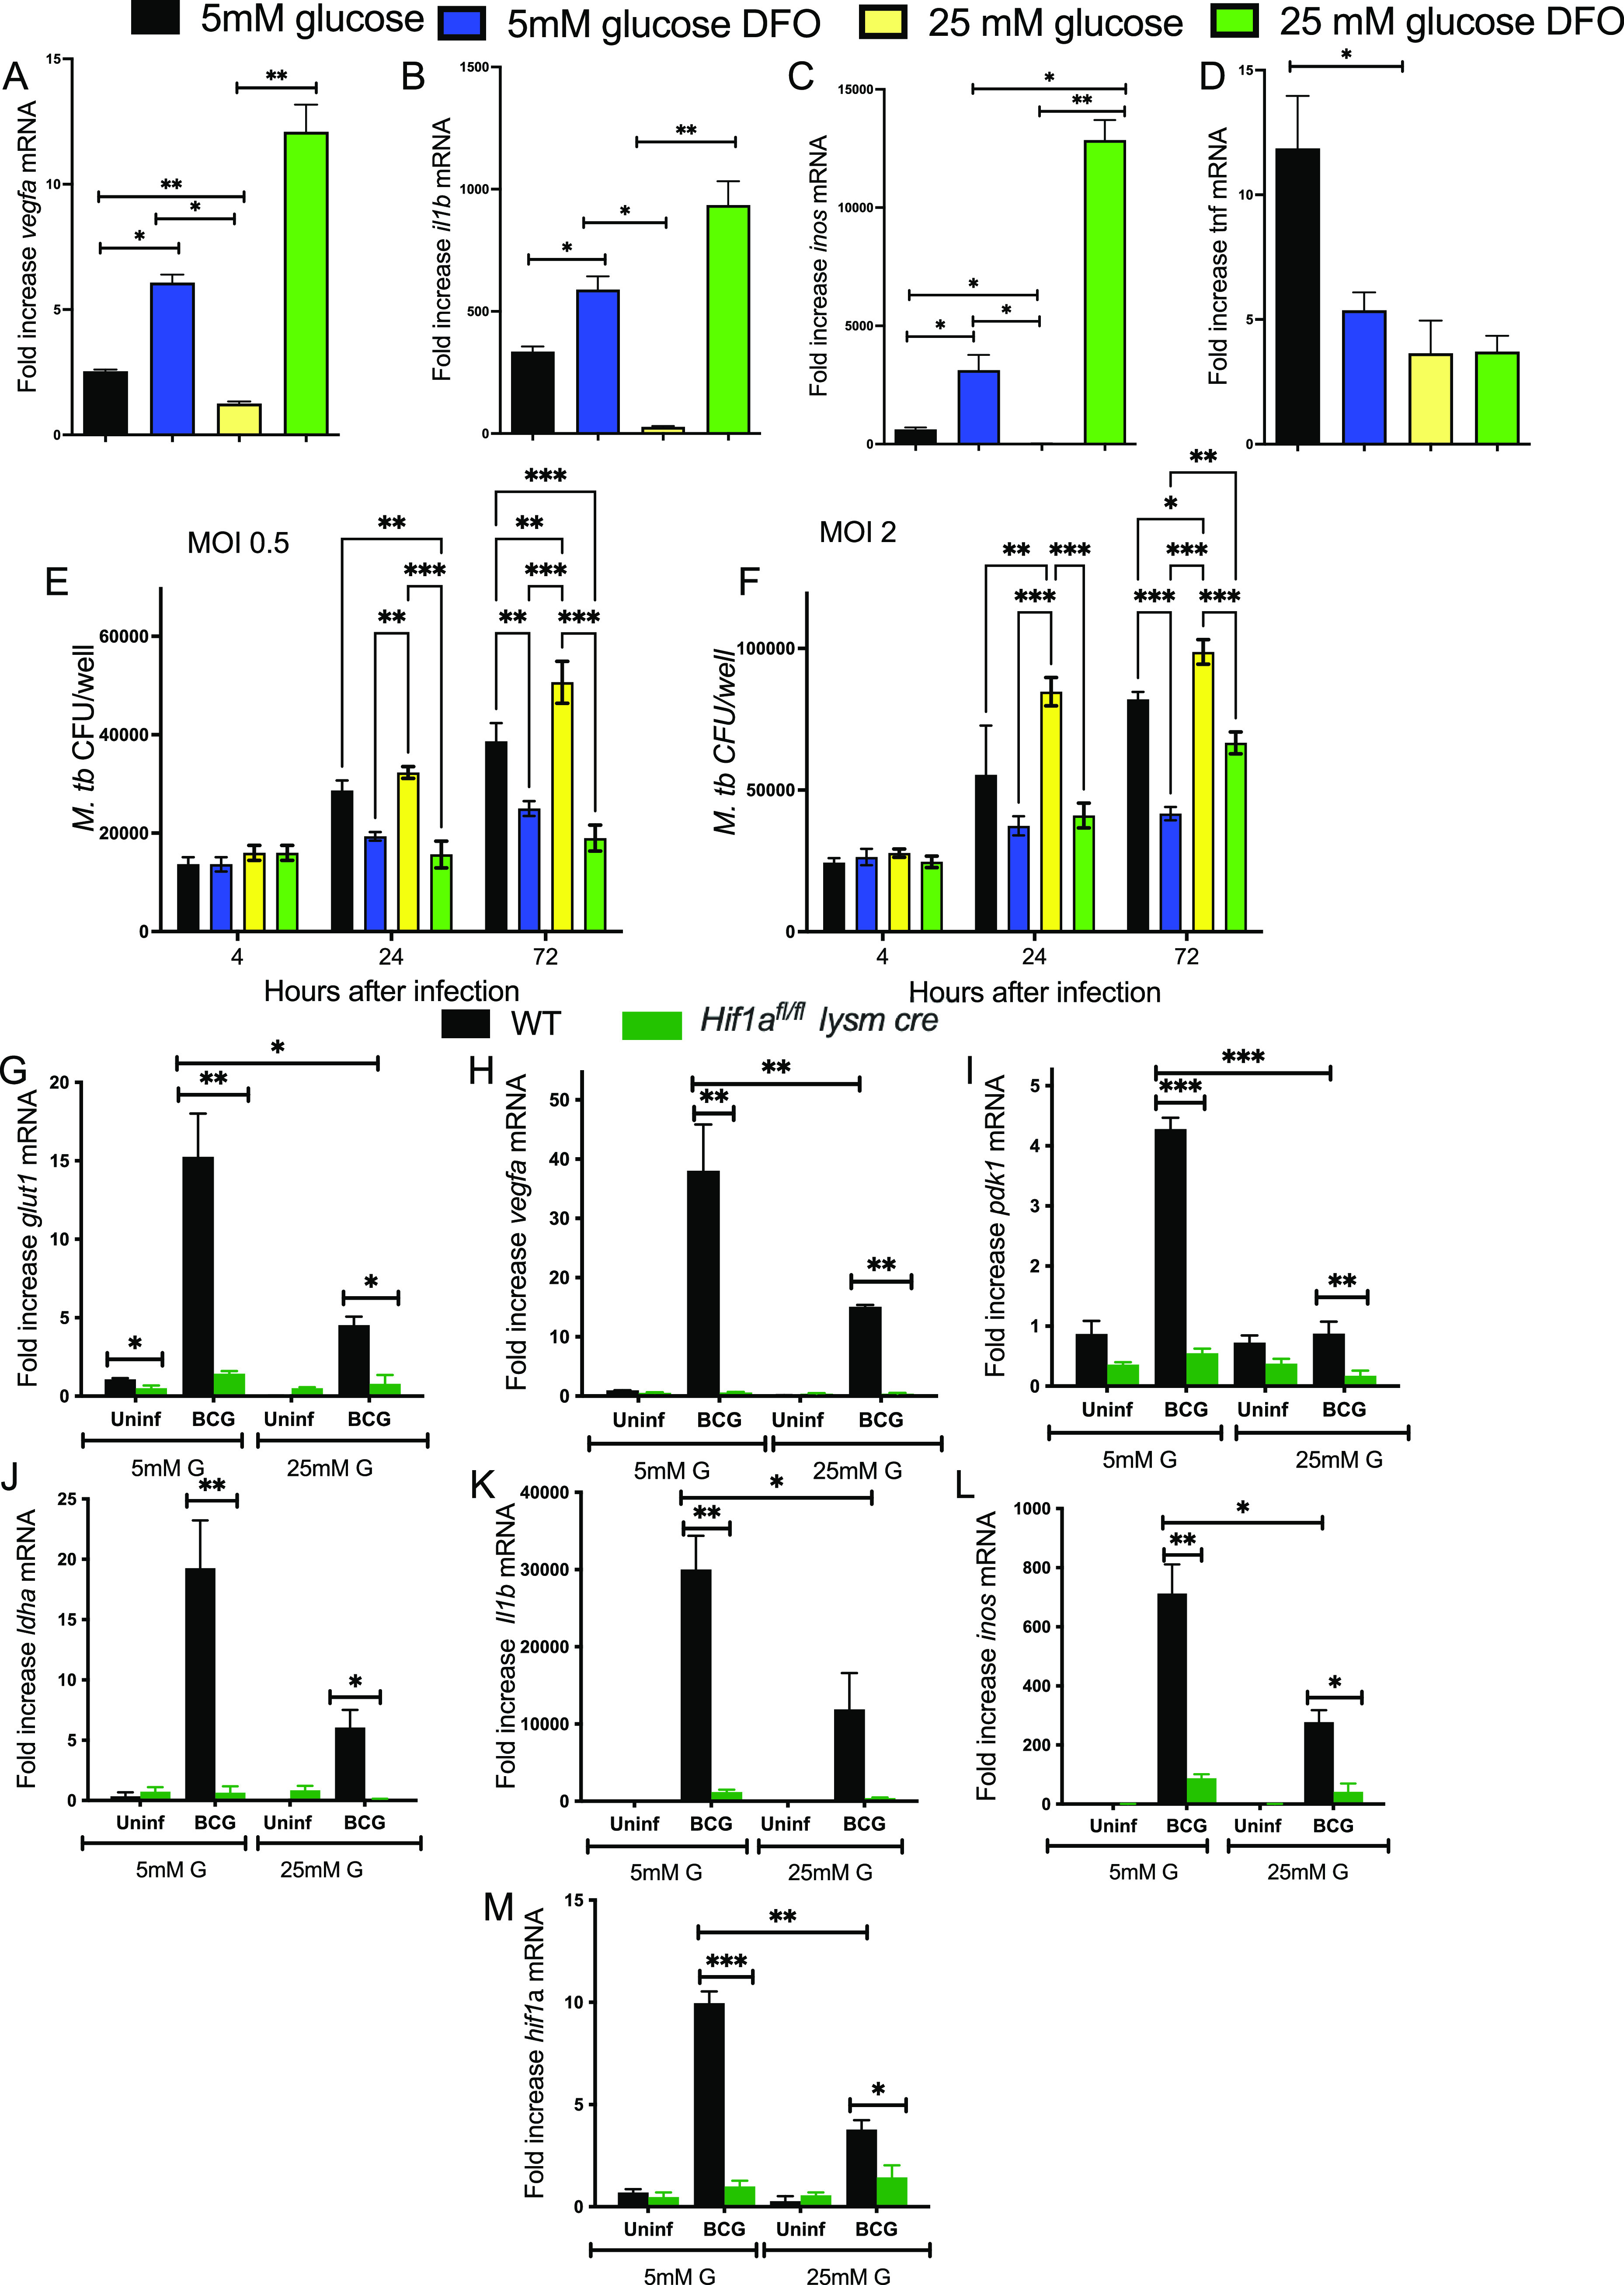
FIG 7.

DFO reverts the high-glucose concentration-hampered HIF-1-mediated responses and the enhanced susceptibility to M. tuberculosis infection of BMM. (A to D) BMM were cultured in medium containing 5 mM or 25 mM glucose and infected with BCG 3 days after. DFO was added 4 h after infection in indicated groups. Total RNA was extracted 24 h after infection and the levels of vegfa (A), il1b (B), inos (C), and tnf (D) mRNA in triplicate independent cultures were measured by real-time PCR. The mean fold increase of transcript levels ± SEM is depicted. Differences between groups are significant at *, P ≤ 0.05; **, P ≤ 0.01; and ***, P ≤ 0.001, one-way ANOVA test with Welch’s correction. (E and F) BMM were incubated with 5 mM or 25 mM glucose 3 days before infection with M. tuberculosis at MOI 0.5 (E) or 2:1 (F). BMM were treated with 100 μM DFO 4 h after the infection. The CFU in cell lysates at the indicated time points after infection was determined. The mean CFU ± SEM in triplicate independent cultures per condition is shown. Differences between groups are significant at **, P ≤ 0.05 and **, P ≤ 0.01, one-way ANOVA test with Welch’s correction. (G to M) Hif1afl/fL lysm cre and WT BMM were infected with BCG at an MOI 5:1. Total RNA was extracted 24 h after infection and the levels of glut1 (G), vegfa (H), pdk1 (I), ldha (J), il1b (K), inos (L), and hif1a (M) mRNA in triplicate independent cultures were in either 5 mM or 25 mM glucose measured by real-time PCR. The mean fold increase of transcript levels in triplicate cultures ± SEM is depicted. Differences are significant at *, P ≤ 0.05; **, P ≤ 0.01; and ***, P ≤ 0.001, one-way ANOVA test with Welch’s correction.
