

Abstract
Fetal exposure to environmental chemicals has been associated with adverse health outcomes in children and later into adulthood. While several studies have examined correlations and variability of non-persistent chemical exposures throughout pregnancy, many do not capture more recent exposures, particularly in New York City. Our goal was to characterize exposure to phthalates, bisphenols, polycyclic aromatic hydrocarbons, and organophosphate pesticides among pregnant women residing in New York City who enrolled in the New York University Children’s Health and Environment Study (NYU CHES) between 2016 and 2018. We measured urinary chemical metabolite concentrations in 671 women at early, mid, and late pregnancy (median 10.8, 20.8, and 29.3 weeks, respectively). We calculated Spearman correlation coefficients among chemical concentrations at each measurement time point. We compared changes in population-level urinary metabolites at each stage using paired Wilcoxon signed-rank tests and calculated intraclass correlation coefficients (ICCs) to quantify intra-individual variability of metabolites across pregnancy. Geometric means and ICCs were compared to nine other pregnancy cohorts that recruited women in 2011 or later as well as nationally reported levels from women of child-bearing age. Compared with existing cohorts, women in NYU CHES had higher geometric means of organophosphate pesticides (Σdiethylphosphates = 28.7 nmol/g cr, Σdimethylphosphates = 57.3 nmol/g cr, Σdialkyl phosphates = 95.9 nmol/g cr), bisphenol S (0.56 μg/g cr), and 2-naphthalene (8.98 μg/g cr). Five PAH metabolites and two phthalate metabolites increased between early to mid and early to late pregnancy at the population level. Spearman correlation coefficients for chemical metabolites were generally below 0.50. Intra-individual exposures varied over time, as indicated by low ICCs (0.22–0.88, median = 0.38). However, these ICCs were often higher than those observed in other pregnancy cohorts. These results provide a general overview of the chemical metabolites measured in NYU CHES in comparison to other contemporary pregnancy cohorts and highlight directions for future studies.
Keywords: Phthalates, Bisphenols, Polycyclic aromatic hydrocarbons, Organophosphate pesticides, Prenatal, Environmental chemicals
1. Introduction
Exposure to environmental chemicals during fetal development has become an increasingly important piece of the developmental origins of health and disease (DOHaD) paradigm ((Barker, 1990; Di Renzo et al., 2015; Heindel, 2019; Heindel, Skalla, Joubert, Dilworth, & Gray, 2017). Bisphenols, phthalates, organophosphate (OP) pesticides, and polycyclic aromatic hydrocarbons (PAHs) are a just a few chemical classes of concern, as they are able to cross the placental barrier and are suspected of affecting major processes of growth and development in the fetus (Choi, Wang, Lin, Spengler, & Perera, 2012; Drwal, Rak, & Gregoraszczuk, 2019; L. X. Li et al., 2013; Mulder et al., 2019). These exposures have been shown to negatively affect neurobehavioral, reproductive, and hormonal development in children and may act through multiple mechanisms, including endocrine disruption, epigenetic modifications, oxidative stress, and inflammation (Akash, Sabir, & Rehman, 2020; Di Renzo et al., 2015; Farzan, Chen, Trachtman, & Trasande, 2016; Grandjean & Landrigan, 2014; Nowak, Jabłonska, ´ & Ratajczak-Wrona, 2019).
Pregnant women are commonly exposed to phthalates via cosmetics and personal care products and to bisphenols in thermal paper via dermal exposure (Wang et al., 2020). Bisphenols and phthalates are often used in food packaging and may enter the body by ingestion, as well (Pacyga, Sathyanarayana, & Strakovsky, 2019). OP pesticides exposure also occurs through ingestion due to their continued use in agriculture (Sokoloff et al., 2016). Exposure to PAHs most commonly occurs through inhalation of contaminated indoor and outdoor air but they may also enter the body through ingestion of smoked or grilled meats (Aquilina et al., 2010; Han et al., 2020; Singh, Varshney, & Agarwal, 2016). Research indicates that long-term exposure to these chemicals, even at low levels, particularly during fetal development, may lead to adverse health effects (Abraham & Chakraborty, 2020; Gore et al., 2015).
Studying the effects of these classes of environmental chemicals on fetal development, specifically in humans, poses a challenge to researchers as most of them have short half-lives and are excreted in the urine (J. Li et al., 2019). Therefore, single spot urine samples during pregnancy may not be reflective of maternal and fetal total exposure (Barkoski et al., 2018; Shin et al., 2020). Furthermore, inconsistencies in single spot urine collection, such as time of day of collection, may give rise to misclassification (Weaver, Kotchmar, Fadrowski, & Silbergeld, 2016). It is well known that developmental processes of each organ system differ over gestation, resulting in critical windows of development (Barker, 1990; West-Eberhard, 1989). While many studies have measured repeated prenatal exposure to environmental chemicals, much of this data comes from pregnancy cohorts that enrolled women over a decade ago, and therefore may not represent the current state of chemical exposures in the population. This is particularly true for pregnancy cohorts based in New York City (Berkowitz et al., 2004; Perera et al., 2002).
In the present analysis, we aim to assess the inter-chemical relationships and within-individual variability of exposure to several bisphenols, phthalate metabolites, OP pesticide metabolites, and PAHs across pregnancy using data from a recent prospective pregnancy cohort, the New York University Children’s Health and Environment Study (NYU CHES). This study measured chemical metabolites in urine samples collected at early, mid, and late pregnancy to assess the reproducibility of single spot urine samples and understand key changes throughout pregnancy. Given the non-persistent nature of these chemicals, we hypothesized that metabolite concentrations would vary over pregnancy for the individual but would remain stable at the study population level. We compare the urinary chemical metabolite concentrations and intraclass correlation coefficients (ICCs) from this urban-based cohort with those from comparable pregnancy cohorts as well as those from women of child-bearing age from the National Health and Nutrition Examination Survey (NHANES). Finally, through this exploration of the urinary chemical data and comparison with other cohorts we aim to generate hypotheses that can be tested in future studies.
2. Methods
2.1. Study population
NYU CHES was developed to study the influence of environmental, dietary, and social influences on pre, peri, and postnatal health outcomes in pregnant women living in New York City and their babies. NYU CHES began recruiting pregnant women attending NYU-affiliated hospitals in March 2016. Women were eligible for enrollment if they were ≥18 years old, < 18 weeks pregnant, spoke English, Spanish, or Chinese, and planned to deliver at NYU Langone Hospital—Manhattan, Bellevue Hospital, or NYU Langone Hospital—Brooklyn. Women were not excluded based on existing conditions related to pregnancy, such as pre-eclampsia or gestational diabetes. A more detailed description of the cohort has been published previously (Trasande et al., 2020). The present analysis uses data from 671 women who provided spot urine samples and detailed questionnaire information at early, mid, and late pregnancy between March 2016 and June 2018. All women enrolled in NYU CHES provided written informed consent. The study was approved by the Institutional Review Board of the New York University Grossman School of Medicine.
2.2. NYU CHES chemical data
We chose to study phthalates and bisphenols given their previous associations with adverse developmental health effects, as described above, and to understand the level to which pregnant women are exposed to replacement chemicals. These include bisphenol S (BPS), a replacement for bisphenol A (BPA), and di-isodecyl phthalate (DiDP) and diisononyl phthalate (DiNP), which serve as replacements for di (2-ethylhexyl) phthalate (DEHP) (Kahn, Philippat, Nakayama, Slama, & Trasande, 2020). These replacement chemicals have been increasingly employed as their predecessors have been phased out in recent years and are thus less widely studied. OP pesticides were chosen for study given their potential effects on metabolic dysfunction as shown in animal models (Slotkin, 2011). PAHs were included to understand their potential role as promoters of inflammation, which may lead to an array of disease in both childhood and adulthood (Sun et al., 2009; Zheng et al., 2013).
Single random spot urine samples were collected at clinical care visits at three time points during pregnancy: early pregnancy (<18 gestational weeks), mid-pregnancy (18–25 gestational weeks), and late pregnancy (>25 gestational weeks). Samples were collected in polyethylene containers and aliquotted into bisphenol- and phthalate-free tubes, then stored at −80 °C. PAHs and OP pesticides were unable to be measured in one late pregnancy urine sample, decreasing the sample size to 670 for these chemical metabolites at late pregnancy only.
Phthalate metabolites (n = 22) were characterized using enzymatic deconjugation of glucuronidated phthalate monoesters followed by solid phase extraction (SPE) coupled with high-performance liquid chromatography electrospray ionization tandem mass spectrometry (HPLC-ESI-MS/MS). Phthalate metabolites were grouped and molar sums calculated based on their molecular weights (Table S1). Low molecular weight phthalates were defined as phthalates with molecular weight <250 Da, excluding monocyclohexyl phthalate (MCHP), mono-n-pentyl phthalate (MPeP), and mono-isopropyl phthalate (MiPrP) due to the percentage of non-detects being above 50%. Phthalates with molecular weight ≥250 Da were grouped as high molecular weight phthalates , excluding mono-n-heptyl phthalate (MHpP), mono-n-hexyl phthalate (MHxP), and mono-octyl phthalate (MOP) due to the large percentage of non-detects. Molar sums of parent compounds di (2-ethylhexyl) phthalate , diisononyl phthalate , and di-n-octyl phthalate were also calculated, excluding metabolites with more than 50% of samples below the limit of detection (LOD) (Table S4). Phthalic acid, the final common metabolite of phthalate acid esters, was analyzed separately.
Eight bisphenols, listed in the supplementary materials (Table S2), were analyzed using liquid-liquid extraction (LLE) followed by HPLC-MS/MS. Six bisphenols (bisphenol-AF (BPAF), bisphenol-AP (BPAP), bisphenol-B (BPB), bisphenol-F (BPF), bisphenol-P (BPP), bisphenol-Z (BPZ)) were excluded from further analysis because 50% or more of the sample concentrations were below the LOD (Table S4).
Twelve PAHs were measured using LLE and injection into an ABSciex 5500 triple quadrupole mass spectrometer (ESI-MS-MS; Applied Biosystems, Foster City, CA), equipped with an Agilent 1100 Series HPLC system (Agilent Technologies, Inc., Santa Clara, CA). All measured PAHs and their abbreviations are listed in the supplementary materials (Table S2). Four PAHs (1-chrysene (1-CHRY), 6-chrysene (6-CHRY), 1-benz [a]anthracene (1-BaA), 3-benzo [c]phenanthrene (3-BcP)) were excluded from further analysis due to more than 50% of samples being below the LOD (Table S4).
Six dialkyl phosphate (DAP) metabolites were characterized using HPLC-MS/MS. These metabolites and their abbreviations are listed in the supplementary materials (Table S2). Molar sums of diethylphosphates , dimethylphosphates and dialkyl phosphates were calculated. Diethyldithiophosphate (DEDTP) was excluded from and due to more than 50% of samples being below the LOD (Table S4).
Urinary creatinine was measured in all samples and chemical metabolites were adjusted for urinary dilution using the following equation: Xadji = Xi/creatininei, where i is the time at which the metabolite was measured (i = early, mid, or late), Xi is the metabolite concentration at the ith time, and Xadji is the creatinine-adjusted metabolite at the ith trime. Chemicals that were included in downstream analyses (i.e. chemicals that were below the LOD in greater than 50% of the study population) and measured below the LOD were imputed as LOD/√2 (Table S4). Further details of the analytical methods are reported elsewhere (Guo et al., 2011; A. J. Li et al., 2020; Z. Zhang et al., 2011; Zhu, Martinez-Moral, & Kannan, 2021).
2.3. Covariate data collection
Sociodemographic and lifestyle data were collected primarily using repeated prenatal visit questionnaires at early, mid, and late pregnancy. These included race, ethnicity, marital status, education level, household income, employment status, and health insurance. Where data were missing from the questionnaire responses, electronic medical records were searched. Age at enrollment, pre-pregnancy height, pre-pregnancy weight, and parity were also obtained from electronic medical records. Pre-pregnancy body mass index (BMI) was calculated from height and weight.
2.4. Statistical analyses
To understand key differences between the subset of women with chemical data to those without, we compared demographics of the subset of NYU CHES for which chemical data were available at early, mid, and late pregnancy to the remainder of the NYU CHES cohort for which we did not have chemical data. We calculated means and standard deviations for continuous variables and counts and frequencies for categorical variables of interest. Because the recruitment time frame during which urine samples were analyzed for chemical metabolites skews towards the beginning of NYU CHES recruitment, we analyzed differences in the same demographic variables after restricting the comparison group to women who were recruited during the same time frame as those whose urine samples were analyzed for chemical metabolites. This is presented as a sensitivity analysis.
We calculated creatinine-adjusted concentration percentiles (25th, 50th, 75th) and geometric means (GMs) and standard deviations (GSDs) for each creatinine-adjusted urinary chemical metabolite (ug/g cr) and chemical group (nmol/g cr) measured at early, mid, and late pregnancy. We also calculated the percent of samples below the LOD at each time point. Spearman correlation coefficients among concentrations of chemical metabolites (ug/g cr) or molar sums (nmol/g creatinine) at early, mid, and late pregnancy were calculated to assess collinearity of the chemicals and metabolites. To explore differences in metabolite concentrations over pregnancy at the population level, we performed pairwise Wilcoxon signed-rank tests on creatinine-adjusted metabolites to identify if any differences occurred from early to mid, mid to late, and/or early to late pregnancy. We used a significance threshold of p = 0.0005, which was calculated using the Bonferroni correction and took into account 93 individual tests (31 metabolites, three points of comparison). Metabolites that showed statistically significant differences across pregnancy phases were plotted in box plots to visualize the changes over pregnancy. We repeated this analysis among four racial/ethnic groups—Hispanic, non-Hispanic White, non-Hispanic Black, and Asian. To assess the reproducibility of the chemical concentrations over the three stages of pregnancy we calculated the two-way random effect intraclass correlation coefficients (ICCs) of the log10-transformed, creatinine-adjusted metabolites and molar sums as well as 95% confidence intervals. The model used to calculate ICCs assumes random effects for both time point and subject (Koo & Li, 2016). ICCs were also calculated separately for each racial/ethnic group described above.
2.5. NHANES chemical data
We used data from NHANES, a biannual representative survey of the non-incarcerated population of the United States, to provide a baseline of comparison that aligns with data collection in NYU CHES. We subset the data to include only women aged 18 to 45, a range chosen to reflect the ages of women with chemical data in NYU CHES, of which only two participants were older than 45. For phthalates, bisphenols, and PAHs we utilized the NHANES 2015–2016 dataset, as this time point is representative of the beginning of NYU CHES recruitment and the relevant chemical data were assessed during this wave (CDC & NCHS, 2015). For OP pesticides we used the NHANES 2011–2012 dataset, as OP pesticide data are not available past this cycle (CDC & NCHS, 2011). For all chemicals, samples below the LOD were imputed and reported as LOD/√2 by NHANES. We adjusted all chemicals metabolites for creatinine to account for urinary dilution. There were several chemicals that were measured in NYU CHES (50% samples > LOD) that were not measured in NHANES. These included phthalic acid (PA), mono-(7--carboxyheptyl) phthalate (MCHpP), mono-[(2-carboxymethyl) hexyl] phthalate (MCMHP), mono-methyl phthalate (MMP), 1,9-phenanthrene (1,9-PHE), 4-phenanthrene (4-PHE), and 2,3,9-fluorene (2,3,9-FLUO). NHANES measured 2-phenanthrene (2-PHE) and 3-phenanthrene (3-PHE) together, while these were measured separately in NYU CHES. We calculated geometric means for creatinine-adjusted phthalates, bisphenols, and PAH metabolites (ug/g cr), and OP pesticide molar sums (nmol/g cr), including adjustment for survey sample weights.
2.6. Comparison with existing pregnancy cohorts
To compare the urinary chemical metabolite concentrations in NYU CHES with those of existing pregnancy cohorts, we systematically searched for studies from pregnancy cohorts that reported on the geometric means of either creatinine-adjusted or specific-gravity adjusted phthalates, bisphenols, PAHs, or OP pesticides. While we recognize that comparison of chemicals with different methods of urinary dilution may not be perfect, recent research indicates that they are comparable (Kuiper et al., 2022). To increase comparability among cohorts, we restricted our search to cohorts that included the year 2011 or later in the recruitment period, as this would be five years before the start of NYU CHES in 2016. We also excluded cohorts of women from Asian countries, as we expected the exposure profiles for these countries to differ greatly from that of the United States. For OP pesticides, we reported and compared molar sums of , , and , rather than individual metabolites, as this is how they are commonly reported in the literature. We did not calculate molar sums of parent phthalate compounds for comparison, as studies reported on a range of differing phthalate metabolites. One cohort, the Atlanta African American Maternal-Child Cohort, reported metabolite concentrations from the first and second trimester separately (X. Zhang et al., 2022). We calculated and reported the trimester-averaged geometric means for this cohort. For NYU CHES data, we averaged the creatinine-adjusted concentrations across pregnancy stages and calculated pregnancy-averaged geometric means. To understand how racial/ethnic makeup may contribute to similarities and differences with other cohorts, we also calculated pregnancy-averaged creatinine-adjusted geometric means for Hispanic, non-Hispanic White, non-Hispanic Black, and Asian participants separately. Finally, we compared ICCs from these cohorts, where available, with ICCs from NYU CHES.
Data cleaning was performed using SAS version 9.4 (SAS Institute Inc., Cary, NC, USA). Statistical analyses were performed using R version 4.1.0 (R Development Core Team).
3. Results & discussion
3.1. Study population demographics
Demographic characteristics of the NYU CHES subpopulation for which chemical measurements at all three time points was available (n = 671) are shown in Table 1. Compared with women recruited into NYU CHES from whom urinary chemical concentrations were not measured or who had less than three chemical measurements (n = 1547), the participants in this analysis were more likely to be Hispanic (54% versus 46%, p < 0.001), have a high school education or less (37% versus 29%, p < 0.0001), and have public health insurance (56% versus 49%, p < 0.01). Participants in NYU CHES who were not included in the chemical subset were more likely to be non-Hispanic White (35% versus 29%, p < 0.01), have a post-graduate degree (29% versus 23%, p < 0.0001), have an annual household income of $100,000 or more (40% versus 29%, p < 0.0001), and be nulliparous (53% versus 47%, p < 0.01). When the comparison subset was restricted to women who were recruited during the same time frame as those who provided urine samples (n = 669), most of the differences described above were attenuated but not erased. Participants included in the chemical analysis were still more likely to be Hispanic (54% versus 48%, p = 0.03) and have a high school education or less (37% versus 31%, p = 0.01). Those without chemical data were more likely to be non-Hispanic White (34% versus 29%, p = 0.05), have an annual household income of $100,000 or more (36% versus 29%, p = 0.01), and be nulliparous (54% versus 47%, p = 0.006) (Table S3). These results suggest that part, but not all, of the systematic differences between women with chemical data and those without are related to the time frame in which they were recruited. This is an important consideration for future studies that utilize this data and may support the use of inverse probability weighting, depending on the study.
Table 1.
Demographic characteristics of NYU CHES participants with chemical data compared to NYU CHES participants not included in the chemical subset.
| Characteristic | Participants with chemical data at three time pointsa |
Participants with no chemical data or less than three measurementsb |
p-valuec |
|---|---|---|---|
| n = 671 | n = 1547 | ||
|
| |||
| Age at enrollment, mean (SD), years | 31.7 (5.5) | 31.9 (5.7) | 0.42 |
| Race/ethnicity, n (%) | |||
| Hispanic | 363 (54%) | 711 (46%) | 0.02 |
| White, not of Hispanic origin | 194 (29%) | 547 (35%) | |
| Black, not of Hispanic origin | 34 (5%) | 97 (6%) | |
| Asian | 61 (9%) | 137 (9%) | |
| Other | 6 (1%) | 16 (1%) | |
| Multiple | 12 (2%) | 32 (2%) | |
| Marital status, n (%) | |||
| Married/living with a partner | 593 (88%) | 1336 (86%) | 0.29 |
| Divorced/separated | 11 (2%) | 37 (2%) | |
| Single/widowed | 62 (9%) | 166 (11%) | |
| Education, n (%) | |||
| High school or less | 250 (37%) | 454 (29%) | <0.001 |
| Some college but no degree | 63 (9%) | 193 (12%) | |
| Associate degree | 39 (6%) | 67 (4%) | |
| Bachelor’s degree | 138 (21%) | 360 (23%) | |
| Post graduate degree | 154 (23%) | 448 (29%) | |
| Household income, n (%) | |||
| Less than $30,000 | 108 (16%) | 254 (16%) | 0.03 |
| $30,000–$49,999 | 61 (9%) | 117 (8%) | |
| $50,000–$74,999 | 37 (6%) | 104 (7%) | |
| $75,000–$99,999 | 30 (4%) | 76 (5%) | |
| $100,000 or more | 192 (29%) | 613 (40%) | |
| Don’t know | 192 (29%) | 337 (22%) | |
| Employed, n (%) | 422 (63%) | 1010 (65%) | 0.25 |
| Insurance, n (%) | |||
| Public | 377 (56%) | 765 (49%) | <0.01 |
| Private | 294 (44%) | 766 (50%) | |
| Pre-pregnancy body mass index, mean (SD), kg/m2 | 26.5 (5.8) | 26.5 (5.8) | 0.72 |
| Nulliparous, n (%) | 314 (47%) | 818 (53%) | <0.01 |
Missing data: race/ethnicity: 1 (<1%); marital status: 5 (1%); education: 27 (4%); household income: 51 (8%); employment: 3 (<1%); pre-pregnancy body mass index: 14 (2%); parity: 2 (<1%).
Missing data: race/ethnicity: 7 (<1%); marital status: 8 (<1%); education: 25 (2%); household income: 46 (3%); employment: 13 (1%); insurance: 16 (1%); pre-pregnancy body mass index: 24 (2%); parity: 6 (<1%).
p-value of chi-squared or t-test comparing subset with versus subset without chemical data.
3.2. Changes in metabolite concentrations across pregnancy
Mean gestational ages at urine collection were 10.8 weeks (standard deviation (SD) = 3.4 weeks), 20.8 weeks (SD = 2.2 weeks), and 29.3 weeks (SD = 3.5 weeks) for early, mid, and late pregnancy, respectively. Among chemicals measured in NYU CHES, we detected fifteen phthalate metabolites, phthalic acid, BPA, BPS, eight PAH metabolites, and five OP pesticide metabolites in at least 50% of the study population. Detailed descriptive statistics of chemical metabolites are reported in supplementary materials (Table S4). Concentrations did not change significantly (p < 0.05) at early, mid, and late pregnancy for most metabolites. However, two phthalate metabolites—MEHP and MBzP—and five PAH metabolites—2-NAP, 1,9-PHE, 2-PHE, 4-PHE, and 1-PYR—did increase across pregnancy (Fig. 1). For each of these metabolites, both mid and late pregnancy concentrations were significantly greater than early pregnancy concentrations. For 2-PHE, late pregnancy concentrations were significantly greater than those in mid-pregnancy (Table S5). When we compared changes across pregnancy among races/ethnicities, the differences observed for MBzP and MEOHP between early to mid and early to late pregnancy became non-significant for all groups. Among non-Hispanic white participants, all differences between PAHs between early to mid and early to late pregnancy remained significant. The same was true for Hispanic participants, except for 1,9-PHE, 2-PHE, and 1-PYR at early to mid-pregnancy, which became non-significant. Median concentrations did continue to decrease over time for Hispanic and non-Hispanic white participants. All differences became non-significant among non-Hispanic Black and Asian participants. This may be due to the relatively smaller sample sizes of these two racial groups (n = 34 and n = 61, respectively). P-values from race/ethnicity-specific pairwise Wilcoxon signed-rank tests are presented in the supplementary materials (Table S6).
Fig. 1.
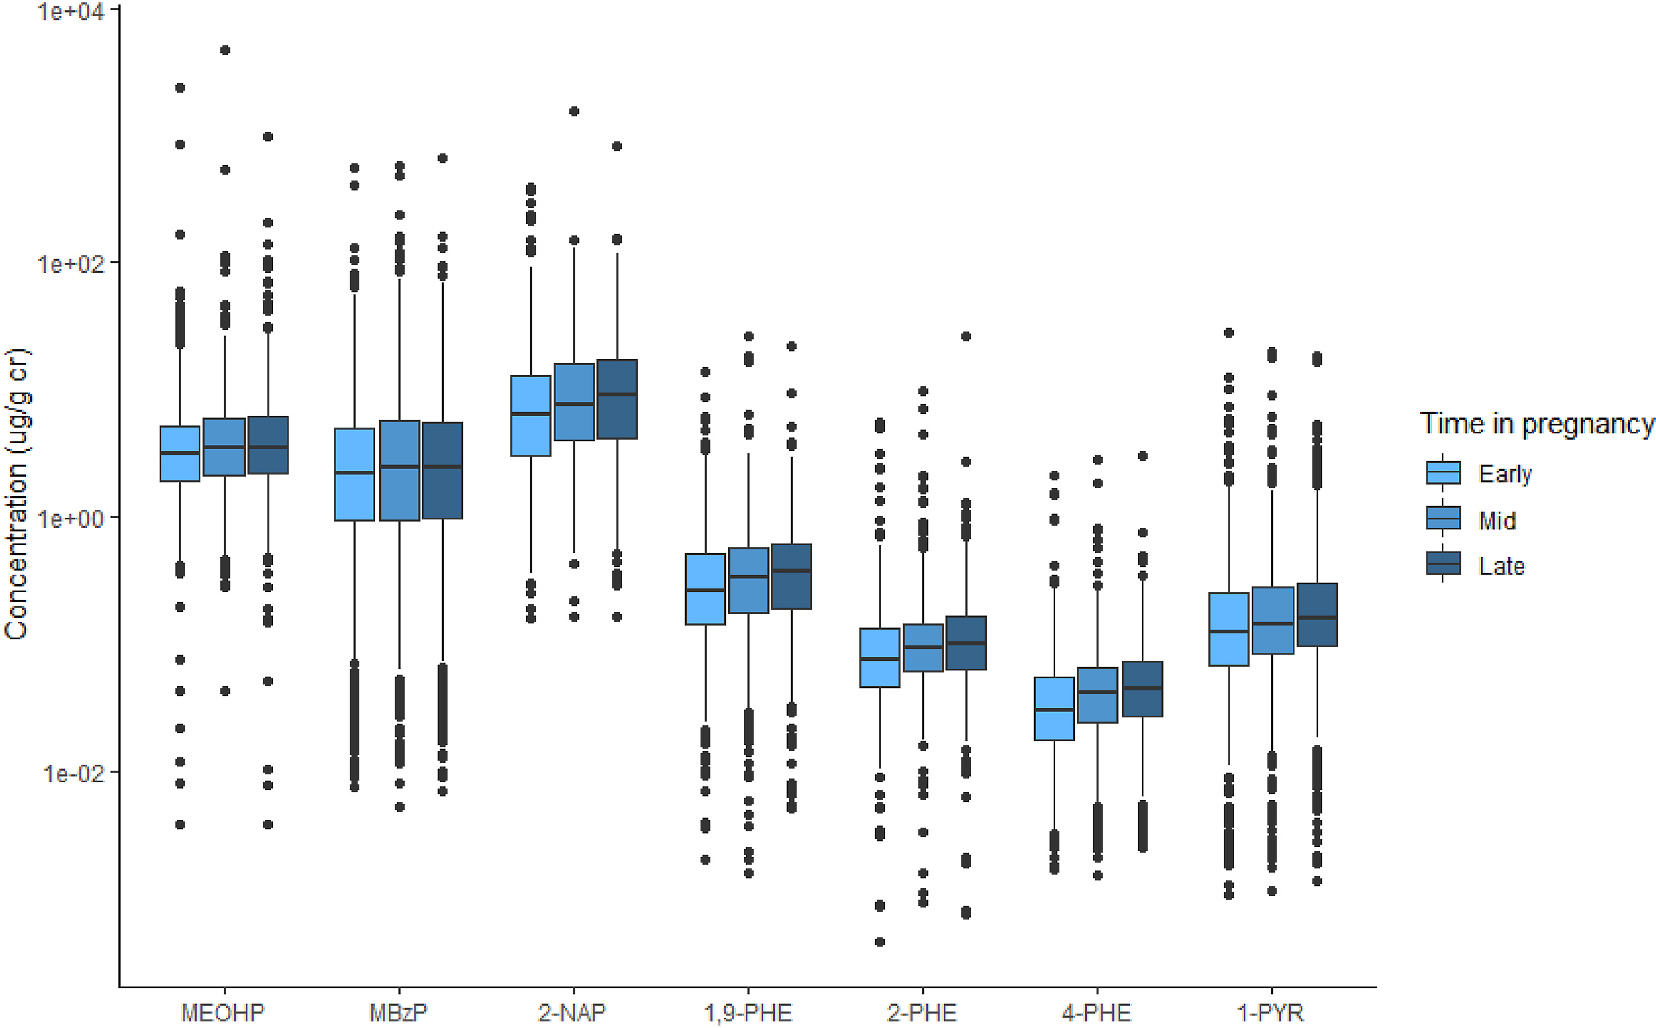
Box plots of urinary chemical metabolites that showed statistically significant differences across trimesters (p < 0.0005)
Abbreviations: MEOHP = Mono-(2-ethyl-5-oxohexyl) phthalate; MBzP = Mono-benzyl phthalate; 2-NAP = 2-hydroxynaphthalene; 1,9-PHE = 1,9-hydroxyphenanthrene; 2-PHE = 2-hydroxyphenanthrene; 4-PHE = 4-hydroxyphenanthrene; 1-PYR = 1-hydroxypyrene.
The increasing concentrations of select phthalate and PAH metabolites observed in the total population, Hispanic participants, and non-Hispanic white participants may be due to changes in metabolism throughout pregnancy. Pharmacological studies show that drug metabolizing enzyme activity changes in pregnancy (Jeong, 2010). It is possible that production or activity of the enzymes responsible for PAH and phthalate clearance increases as pregnancy progresses. Alternatively, women may be more highly exposed to PAHs or phthalates later in pregnancy. PAH exposure often occurs through ingestion of grilled or charred meats and processed foods, and phthalate exposure has been shown to occur through different food sources, so changes in diet over pregnancy may impact PAH levels (Polinski et al., 2018; Rodríguez-Carmona et al., 2020; Singh et al., 2016).
ICCs ranged from 0.22 to 0.88 with a median of 0.38 (Table 3). Using the guidelines from Rosner (2011), most ICCs were considered poor (n = 16), 12 were considered fair to good, and only one ICC, for MiNP, was considered excellent (Rosner, 2011). Among the ICCs for specific racial/ethnic groups, the greatest deviations from the population occurred in non-Hispanic Black and Asian participants. This is expected, as these groups made up smaller proportions of the total study population (Table S7). In some cases, the ICCs were much higher among non-Hispanic Black and Asian participants, while in other cases they were lower. Larger samples of both populations are needed to better assess whether these deviations are true or have occurred by chance due to the small sample sizes.
Table 3.
Comparison of intraclass correlation coefficients from other pregnancy birth cohorts concentrations in NYU CHES with NHANES and comparable pregnancy cohorts.
| Metabolite | NYU CHESa | PROTECTb | Healthy Startc | PROGRESSd |
|---|---|---|---|---|
|
| ||||
| Phthalatesg | ||||
| MMP | 0.57 (0.53, 0.61) | - | 0.73 (0.45, 0.88) | - |
| MEP | 0.44 (0.40, 0.48) | 0.44 (0.34, 0.55) | 0.60 (0.41, 0.74) | 0.05 (−0.02, 0.12) |
| MnBP | 0.53 (0.48, 0.57) | 0.42 (0.31, 0.53) | 0.04 (0.00, 0.27) | 0.23 (0.16, 0.29) |
| MiBP | 0.57 (0.53, 0.61) | 0.34 (0.24, 0.46) | 0.59 (0.40, 0.73) | 0.09 (0.02, 0.16) |
| MECPP | 0.30 (0.25, 0.35) | 0.19 (0.10, 0.33) | 0.39 (0.17, 0.57) | 0.03 (−0.04, 0.10) |
| MCMHP | 0.33 (0.28, 0.38) | - | - | - |
| MEOHP | 0.28 (0.23, 0.32) | 0.25 (0.15, 0.38) | 0.31 (0.10, 0.52) | 0.04 (−0.03, 0.10) |
| MEHHP | 0.29 (0.25, 0.34) | 0.24 (0.14, 0.37) | 0.28 (0.17, 0.57) | 0.03 (−0.03, 0.10) |
| MEHP | 0.32 (0.27, 0.36) | 0.36 (0.26, 0.48) | 0.58 (0.30, 0.78) | 0.07 (0.00, 0.14) |
| MiNP | 0.88 (0.87, 0.90) | - | 0.26 (0.00, 0.56) | - |
| MCiOP | 0.29 (0.24, 0.33) | 0.28 (0.18, 0.40) | 0.25 (0.06, 0.46) | 0.03 (−0.04, 0.09) |
| MCPP | 0.29 (0.24, 0.35) | 0.20 (0.11, 0.35) | 0.23 (0.02, 0.45) | 0.03 (−0.04, 0.10) |
| MCHpP | 0.25 (0.20, 0.30) | - | - | - |
| MBzP | 0.56 (0.52, 0.61) | 0.41 (0.30, 0.52) | 0.48 (0.26, 0.67) | 0.03 (−0.04, 0.09) |
| MCiNP | 0.36 (0.31, 0.40) | 0.05 (0.01, 0.33) | 0.18 (0.00, 0.39) | 0.03 (−0.04, 0.10) |
| PA | 0.23 (0.18, 0.28) | - | - | - |
| Bisphenolsg | ||||
| BPA | 0.36 (0.31, 0.41) | 0.24 (0.13, 0.40) | 0.39 (0.16, 0.58) | - |
| BPS | 0.30 (0.25, 0.35) | - | 0.25 (0.01, 0.48) | - |
| PAHsg | ||||
| 1-NAP | 0.41 (0.36, 0.46) | 0.39 (0.26, 0.50) | - | - |
| 2-NAP | 0.58 (0.53, 0.62) | 0.56 (0.46, 0.64) | - | - |
| 1,9-PHE | 0.51 (0.48, 0.55) | - | - | - |
| 2-PHE | 0.48 (0.43, 0.52) | - | - | - |
| 3-PHE | 0.49 (0.44, 0.54) | - | - | - |
| 4-PHE | 0.39 (0.33, 0.44) | 0.19 (0.03, 0.33) | - | - |
| 2,3,9-FLU | 0.47 (0.43, 0.51) | - | - | - |
| 1-PYR | 0.49 (0.44, 0.53) | 0.49 (0.37, 0.58) | - | - |
| Organophosphate pesticides | ||||
| ΣDE | 0.27 (0.22, 0.32) | - | - | - |
| ΣDM | 0.22 (0.18, 0.27) | - | - | - |
| ΣDAP | 0.22 (0.17, 0.27) | - | - | - |
New York University Children’s Health and Environment Study; New York, NY, USA; 2016–2018; n = 670–671; one sample collected at early, mid, and late pregnancy.
Puerto Rico Testsite for Exploring Contamination Threats Study; Puerto Rico, US Territory; 2012–2017; n = 138 (Cantonwine et al., 2014); n = 105 (Meeker et al., 2013); n = 659 (Cathey et al., 2020); one sample collected at early, mid, and late pregnancy.
Colorado Healthy Start Study; Colorado, USA; 2009–2014; n = 24 (Polinski et al., 2018); three samples collected at two week intervals between 24 and 32 weeks gestation.
Programming Research in Obesity, Growth, Environment and Social Stressors; Mexico City, Mexico; 2007–2011; n = 514 (Colicino et al., 2021); one sample collected at mid and late pregnancy.
3.3. Correlations of chemical metabolites
The majority of correlation coefficients between chemicals at each pregnancy stage were below 0.50 (93% at early pregnancy, 94% at mid-pregnancy, and 94% at late pregnancy, data not shown). Three high molecular weight phthalate metabolites had strong correlations that were sustained at each stage: MEOHP and MEHHP (ρ = 0.92–0.93, p < 0.001), MEOHP and MECPP (ρ = 0.86–0.89, p < 0.001), and MEHHP and MECPP (ρ = 0.83–0.86, p < 0.001). This is not surprising given that these are common metabolites of DEHP and high correlations have been observed previously (ATSDR, 2002; Colicino et al., 2021). Two PAHs, 2-PHE and 3-PHE, were also highly correlated at each stage (ρ = 0.78–0.79, p < 0.001). These correlations were slightly lower than what has been observed in other cohorts (Cathey et al., 2018). Interestingly, BPA and BPS were weakly correlated across pregnancy stages (ρ = 0.14–0.23, p < 0.001). Low correlation coefficients between BPA and BPS have been observed in the Generation R cohort as well (Sol et al., 2021). The low correlations may indicate that, rather than sharing a source of exposure, one chemical is replacing the other. Despite being the final common metabolite of phthalate acid esters, phthalic acid was not strongly correlated with most phthalates. The strongest correlation was with MEP at early pregnancy (ρ = 0.45, p < 0.001), but the correlation weakened at mid and late pregnancy (ρ = 0.33–0.35, p < 0.001).
3.4. Comparison of chemical metabolite concentrations and ICCs with other pregnancy cohorts
We identified nine pregnancy cohorts with which to compare urinary metabolite levels from NYU CHES mothers. These included the Atlanta African American Maternal-Child Cohort (Atlanta AA, 2014–2017), the Puerto Rico Testsite for Exploring Contamination Threats Study (PROTECT, 2012–2017), the Global Alliance to Prevent Prematurity and Stillbirth (GAPPS, 2011–2014), The Infant Development and Environment Study (TIDES, 2010–2012), the Alberta Pregnancy Outcomes and Nutrition Study (APrON, 2010–2012), the Colorado Healthy Start Study (2009–2014), the Maternal-Infant Research on Environmental Chemicals Study (MIREC, 2008–2011), the Programming Research in Obesity, Growth, Environment and Social Stressors Study (PROGRESS, 2007–2011), and the Conditions Affecting Neurocognitive Development and Learning in Early childhood Study (CANDLE, 2006–2011) (Aker et al., 2019; Arbuckle et al., 2014; Cathey et al., 2021; Cathey et al., 2020; Colicino et al., 2021; England-Mason et al., 2022; Freije et al., 2022; J. Liu et al., 2018; Loftus et al., 2021; Ntantu Nkinsa et al., 2020; Polinski et al., 2018; Serrano et al., 2014; X. Zhang et al., 2022). Details of these cohorts and geometric means of urinary metabolite concentrations are presented in Table 2 along with geometric means of pregnancy-averaged, creatinine-adjusted chemical metabolite concentrations from NYU CHES and data from a comparable subset of women from NHANES. Pregnancy-averaged geometric means across racial/ethnic groups are presented in the supplementary materials (Table S8).
Table 2.
Comparison of urinary chemical metabolite concentration geometric means in NYU CHES with NHANES and existing pregnancy cohorts.
| Cohort | MMP | MEP | MnBP | MiBP | MECPP | MCMHP | MEOHP | MEHHP | MEHP | MCiOP | MCPP | MBzP | MCiNP |
| GM (ug/g creatinine) | |||||||||||||
| NYU CHESa | 0.89 | 48.9 | 12.8 | 7.47 | 7.39 | 3.44 | 4.28 | 7.19 | 1.90 | 2.44 | 1.06 | 2.66 | 1.18 |
| NHANESb | - | 41.3 | 10.4 | 9.48 | 9.17 | - | 3.79 | 5.77 | 1.51 | 8.28 | 1.03 | 4.74 | 1.66 |
| Atlanta AAc | - | 67.5 | 6.65 | 5.69 | 6.15 | - | 2.68 | 4.16 | 1.40 | - | - | 4.16 | - |
| APrONd | 2.83 | 57.4 | 21.2 | 14.1 | 20.7 | - | 11.4 | 13.5 | 4.04 | - | - | 8.38 | - |
| Healthy Starte | 1.60 | 41.1 | 9.40 | 7.10 | 11.3 | - | 4.60 | 4.90 | 1.30 | 20.5 | 2.30 | 5.50 | 3.40 |
| GM (ug/L, adjusted for specific gravity) | |||||||||||||
| PROTECTf | - | 44.9 | 16.0 | 10.3 | 13.0 | - | 6.43 | 7.19 | 2.43 | 8.67 | 1.27 | 2.72 | 1.67 |
| GAPPSg | - | - | - | - | - | - | - | - | - | - | - | - | - |
| TIDESh | - | 35.6 | 8.23 | 5.08 | 10.1 | - | 5.56 | 7.68 | 2.54 | - | - | 4.28 | - |
| MIRECi | - | 37.7 | 13.7 | - | - | - | 7.54 | 10.8 | 2.63 | - | 1.02 | 6.14 | - |
| PROGRESSj | - | 144 | 80.5 | 9.29 | 44.3 | - | 19.7 | 20.9 | 5.40 | 4.54 | 1.41 | 5.04 | 0.97 |
| CANDLEk | 1.99 | 126 | 15.8 | 7.54 | 13.1 | 6.60 | 6.67 | 8.44 | 2.14 | 2.49 | 1.51 | 10.0 | 0.51 |
|
| |||||||||||||
| Cohort | BPA | BPS | 1-NAP | 2-NAP | 1,9-PHE | 2-PHE | 3-PHE | 4-PHE | 2,3,9-FLU | 1-PYR | ΣDM | ΣDE | ΣDAP |
| GM (ug/g creatinine) | GM (nmol/g creatinine) | ||||||||||||
| NYU CHESa | 0.80 | 0.56 | 0.80 | 8.98 | 0.34 | 0.10 | 0.08 | 0.04 | 0.74 | 0.18 | 57.3 | 28.7 | 95.9 |
| NHANESb | 1.04 | 0.59 | 1.57 | 7.46 | 0.12 | - | - | - | - | 0.16 | 40.0 | 16.6 | 61.0 |
| Atlanta AAc | - | - | - | - | - | - | - | - | - | - | - | - | - |
| APrONd | 1.68 | 0.22 | - | - | - | - | - | - | - | - | - | - | - |
| Healthy Starte | 1.00 | - | - | - | - | - | - | - | - | - | - | - | - |
| GM (ug/L, adjusted for specific gravity) | GM (nmol/L, adjusted for specific gravity) | ||||||||||||
| PROTECTf | 2.02 | 0.46 | 0.50 | 6.77 | - | - | - | 21.1 | - | 1.32 | - | - | - |
| GAPPSg | - | - | 0.42 | 2.96 | 0.10 | 0.05 | 0.05 | - | 0.15 | 0.04 | - | - | - |
| TIDESh | - | - | 0.20 | 2.48 | 0.09 | 0.06 | 0.05 | - | 0.59 | 0.03 | - | - | - |
| MIRECi | 0.90 | - | - | - | - | - | - | - | - | - | 58.3 | 26.7 | 87.6 |
| PROGRESSj | - | - | - | - | - | - | - | - | - | - | - | - | - |
| CANDLEk | - | - | 1.20 | 4.89 | 0.28 | 0.09 | 0.10 | - | 0.93 | 0.14 | - | - | - |
New York University Children’s Health and Environment Study; New York, NY, USA; 2016–2018; phthalates & bisphenols (n = 671), PAHs & OP pesticides (n = 670).
National Health and Nutrition Examination Survey; USA; 2011–2012 (OP pesticides (n = 408–419)); 2015–2016 (phthalates (n = 427), bisphenols (n = 427), PAHs (n = 437–454)).
Atlanta African American Maternal-Child Cohort; Atlanta, GA, USA; 2014–2017; n = 73 (X. Zhang et al., 2022).
The Alberta Pregnancy Outcomes and Nutrition Study; Alberta, Canada; 2010–2012; n = 78 (England-Mason et al., 2022); n = 455 (Liu et al., 2018).
Colorado Healthy Start Study; Colorado, USA; 2009–2014; n = 446 (Polinski et al., 2018).
Puerto Rico Testsite for Exploring Contamination Threats Study; Puerto Rico, US Territory; 2012–2017; n = 510 (Cathey et al., 2021); n = 867 (Aker et al., 2019); n = 659 (Cathey et al., 2020).
Global Alliance to Prevent Prematurity and Stillbirth; Multiple cities, WA USA; 2011–2014; n = 213 (Freije et al., 2022).
The Infant Development and Environment Study; Rochester, NY, Seattle, WA, Minneapolis, MN, San Francisco, CA, USA; 2010–2012; n = 656 (Serrano et al., 2014); n = 597 (Freije et al., 2022).
Maternal-Infant Research on Environmental Chemicals Study; Multiple cities, Canada; 2008–2011; n = 1788 (Arbuckle et al., 2014); n = 1853 (Ntantu Nkinsa et al., 2020).
Programming Research in Obesity, Growth, Environment and Social Stressors; Mexico City, Mexico; 2007–2011; n = 514 (Colicino et al., 2021).
Conditions Affecting Neurocognitive Development and Learning in Early childhood; Memphis, TN, USA; 2006–2011; n = 1015 (Loftus et al., 2021); n = 867 (Freije et al., 2022).
OP pesticides were higher in NYU CHES women (ΣDE = 28.7 nmol/g cr, ΣDM = 57.3 nmol/g cr, ΣDAP = 95.9 nmol/g cr) than in NHANES (ΣDE = 16.6 nmol/g cr, ΣDM = 40.0 nmol/g cr, ΣDAP = 61.0 nmol/g cr) (CDC & NCHS, 2011). This may be the result of differences in timing, as NHANES OP pesticide data was measured during the 2011–2012 cycle. However, OP pesticides measured in pregnant women in the Maternal-Infant Research on Environmental Chemicals Study (MIREC) in Canada, which recruited between 2008 and 2011, were similar to those observed in NYU CHES. The majority of women in MIREC identified as White and less than 10% reported having a high school degree or less (Ntantu Nkinsa et al., 2020). This differs from NYU CHES, which was predominately Hispanic and 37% of participants reported a high school education or less. Both cohorts recruited women from urban areas, which could help explain the similarity in metabolite concentrations. Access to non-pesticide treated produce may be less common in urban spaces than in rural or suburban areas. Previous research indicates that purchase and consumption of organic produce, which are less likely to be treated with pesticides, is associated with education level (Curl et al., 2013). This may explain the higher OP pesticide levels seen in NYU CHES than NHANES, but further research is needed to fully understand these differences.
Geometric means of phthalate metabolite concentrations in NYU CHES fell in the middle or low end among the comparison cohorts and NHANES. The phthalate metabolite profile of women in NYU CHES appeared most similar to that of TIDES, Colorado Healthy Start, and PROTECT (Cathey et al., 2021; Polinski et al., 2018; Serrano et al., 2014). A recent study examined associations of food products with urinary phthalates in NYU CHES and identified dried peas and beans as a major predictor (H. Liu et al., 2022). However, a study from PROTECT found dairy products to be the main food product predictor whereas TIDES found inverse associations with food products and Healthy Start found no dietary associations (Polinski et al., 2018; Rodríguez-Carmona et al., 2020; Serrano et al., 2014) The PROTECT study also found some personal care products and drinking water sourced from the public water supply or cisterns to be predictive of higher urinary phthalates (Rodríguez-Carmona et al., 2020). This is particularly interesting because Puerto Ricans are thought to be exposed to increased levels of phthalates due to environmental contamination of groundwater (Cantonwine et al., 2014; Padilla, Irizarry, & Steele, 2011). A recent report of water quality in New York City found very low levels of DEHP in drinking water, but this report did not measure non-DEHP phthalates (DEP, 2021). Future studies of NYU CHES should explore the associations between different sources of drinking water (i.e. tap versus filtered versus bottled) and levels of non-DEHP urinary phthalate metabolites. The majority of phthalate metabolite concentrations were highest among Hispanic women in NYU CHES, so there may be a genetic component of phthalate metabolism driving the similarities between NYU CHES and PROTECT as well (McGraw & Waller, 2012).
The geometric mean of BPA in NYU CHES (0.80 μg/g cr) was the lowest compared with NHANES (1.04 μg/g cr), APrON (1.68 μg/g cr), Colorado Healthy Start (1.00 μg/g cr), PROTECT (2.02 μg/L) and MIREC (0.90 μg/L). BPS concentration (0.56 μg/g cr) in this study, however, was similar to that of NHANES (0.59 μg/g cr) and higher than both APrON (0.22 μg/g cr) and PROTECT (0.46 μg/L) (Aker et al., 2019; Arbuckle et al., 2014; CDC & NCHS, 2015; J. Liu et al., 2018; Polinski et al., 2018; X. Zhang et al., 2022). This may reflect the replacement of BPA with BPS in consumer products which can be labeled “BPA free” and appear safe to consumers (Liao & Kannan, 2014). As with Colorado Healthy Start, BPA and BPS were found at higher concentrations among non-Hispanic white participants (Polinski et al., 2018). While this could indicate higher exposure among non-Hispanic white women it may also arise from metabolic differences arising from genetic factors that differ by ethnicity (McGraw & Waller, 2012).
Several of the PAHs measured in NYU CHES women were higher than in NHANES and other pregnancy cohorts, including PROTECT, GAPPS, and CANDLE (Cathey et al., 2020; CDC & NCHS, 2015; Freije et al., 2022). Urinary 2-NAP concentration in NYU CHES (8.98 μg/g cr) was most similar to that of NHANES (7.46 μg/g cr) while 1,9-PHE (0.34 μg/g cr) was most similar to CANDLE (0.28 μg/L) (CDC & NCHS, 2015; Freije et al., 2022). Both of these metabolites were highest among Hispanic women in NYU CHES (12.3 μg/g cr and 0.38 μg/g cr, respectively), a demographic that was not highly represented in GAPPS or CANDLE. Given the urban setting of this cohort, we expect that higher PAH concentrations are arising from traffic emissions or tobacco smoke, rather than wood burning practices (Jia & Batterman, 2010). Analysis of neighborhood factors—such as proximity to high-traffic areas (Levy, Bennett, Melly, & Spengler, 2003)—may help to tease out whether increased PAH levels in Hispanic women is due to location or other factors, such as lifestyle, diet, or genetics.
ICCs were identified in the Colorado Healthy Start, PROTECT, and PROGRESS cohorts. The Colorado Healthy Start Study collected three spot urine samples from a subset of women (n = 24) at two week intervals between 24 and 32 weeks gestation (Polinski et al., 2018). PROGRESS collected urine samples at mid and late pregnancy from 514 women and PROTECT collected urine samples at early, mid, and late pregnancy from 659 women, although ICCs for phthalates were measured in a 138 women and bisphenols in 105 women (Cantonwine et al., 2014; Cathey et al., 2020; Meeker et al., 2013). The ICCs and 95% confidence intervals from NYU CHES and these three additional cohorts are presented in Table 3. All three studies reported ICCs for phthalates, whereas ICCs for bisphenols were only reported by PROTECT and Healthy Start. PAHs were only reported by PROTECT.
ICCs for phthalates from PROGRESS were all lower than those observed in NYU CHES. ICCs reported in Healthy Start were generally similar to NYU CHES (±0.1) with some exceptions. Compared with Healthy Start, ICCs in NYU CHES were lower for MMP, MEP, and MEHP and higher for MnBP, MiNP, and MCiNP. We might expect most ICCs to be lower in NYU CHES compared with Healthy Start, given the longer time frame in which samples were collected (~19 weeks in NYU CHES versus 4 weeks in Healthy Start). Compared with PROTECT, NYU CHES had higher ICCs (>+0.1) for MnBP, MiBP, MECPP, MBzP, and MCiNP, BPA, and 4-PHE. All other ICCs were similar (±0.1). From these comparisons we see that, although the ICCs for the majority of chemical metabolites in NYU CHES are poor, this is a common occurrence across other pregnancy cohorts (Rosner, 2011). We were unable to identify studies within our cohort selection parameters that measured the same OP pesticides as measured in NYU CHES. Urinary levels of 3-phenoxy-benzoic acid (3-PBA), a pyrethroid pesticide metabolite, and 3,5,6-trichloro-2-pyridinol (TCPy), a chlorpyrifos pesticide metabolite, were measured at early, mid, and late pregnancy in the Markers of Autism Risk in Babies Learning Early Signs Study (MARBLES, 2007–2014). This study found lower ICCs than OP pesticides in NYU CHES (0.0 and 0.6, respectively), suggesting that low ICCs of urinary pesticide metabolites should be expected (Barkoski et al., 2018).
3.5. Strengths and limitations
Perhaps the greatest strength of the present study is the number of participants who provided urine samples at early, mid, and late pregnancy, allowing us to calculate ICCs and better understand the reliability of single spot urine samples in a subset of this cohort. The majority of this subset was made up of women who identified as Hispanic, allowing us to study the effects of a wide range of chemicals on a population that has been underrepresented in the more recent US mainland-based studies (Freije et al., 2022; Loftus et al., 2021; Polinski et al., 2018; Serrano et al., 2014; X. Zhang et al., 2022). While other New York City-based pregnancy cohorts have provided invaluable data over the past two decades (Berkowitz et al., 2004; Perera et al., 2002), the chemical metabolite data collected in NYU CHES provides a more recent picture of metabolite levels among pregnant women living in New York City. Many of the exposures measured in this cohort were detected at low concentrations. Given the growing concern of low-level chemical exposures (Lanphear, 2017), future studies using chemical measurements from the NYU CHES cohort may further elucidate the health effects of more common, low-level synthetic chemical exposures on the pregnant mother and developing fetus.
There are several limitations to this study. In Spearman correlations and ICCs, we adjusted for urinary dilution using creatinine rather than specific gravity, as specific gravity was not measured in NYU CHES. While we do not expect this to have a major effect on the results, it is worth noting that specific gravity is recommended due to its relative stability compared with creatinine. Creatinine may differ by biological factors, including race, BMI, and age, and also changes throughout the day (MacPherson, Arbuckle, & Fisher, 2018). It may be appropriate to use more sophisticated methods of creatinine adjustment in future, analyses where creatinine may act as a confounder, such as covariate-adjusted standardization (O’Brien, Upson, Cook, & Weinberg, 2016). Additionally, as this study used urine to quantify exposure, the reported distributions and correlations may not reflect exposure to the placenta and fetus. Although we collected samples at multiple time points throughout pregnancy, we do not have repeated measurements within each stage of pregnancy. Therefore, trimester-specific analyses will need to rely on a single exposure measurement. Sensitivity analyses using the pregnancy-averaged concentrations or more sophisticated methods of modeling chemical exposures over time are recommended for studies focusing on critical windows of exposure (Chen, Ferguson, Meeker, McElrath, & Mukherjee, 2015). Finally, to include the largest possible number of comparison cohorts, we only compared urinary metabolite concentrations in NYU CHES mothers to other studies that reported geometric means of chemical metabolites adjusted for urinary dilution. Studies that reported only median values or non-adjusted values were not included in the cohort comparison, and we did not curate an exhaustive list of pregnancy cohorts.
4. Conclusion
Geometric means of non-persistent chemical concentrations in the NYU CHES cohort were similar to those seen in NHANES but varied in comparison with other pregnancy cohorts dependent on chemical group. While the majority of urinary metabolites showed no differences in concentrations between early, mid, and late pregnancy, some phthalates and PAHs did have statistically significant increases at early to mid and early to late pregnancy. ICC coefficients showed that within person exposure varied largely over gestation, but this was not unique to this cohort. These findings suggest that single spot urine samples for the measurement of non-persistent chemicals may not reflect the average exposure to these chemicals over pregnancy.
Supplementary Material
Funding
NYU CHES is supported by institutional funds of NYU Grossman School of Medicine as well as the NIH Office of the Director (UG3/UH3OD023305).
Abbreviations:
- DOHaD
Developmental origins of health and disease
- OP
organophosphate
- PAH
polycyclic aromatic hydrocarbon
- LMWP
low molecular weight phthalate
- HMWP
high molecular weight phthalate
- NYU CHES
New York University Children’s Health and Environment Study
- NHANES
National Health and Nutrition Examination Survey
- LOD
limit of detection
- ICC
intraclass correlation
Footnotes
Declaration of competing interest
The authors declare the following financial interests/personal relationships which may be considered as potential competing interests: Leonardo Trasande reports financial support was provided by National Institutes of Health Office of the Director. Leonardo Trasande reports financial support was provided by New York University Grossman School of Medicine.
Appendix A. Supplementary data
Supplementary data to this article can be found online at https://doi.org/10.1016/j.envpol.2022.119774.
This paper has been recommended for acceptance by Dr. Payam Dadvand.
Data availability
Data will be made available on request.
References
- Abraham A, Chakraborty P, 2020. A review on sources and health impacts of bisphenol A. Rev. Environ. Health 35 (2), 201–210. [DOI] [PubMed] [Google Scholar]
- Akash MSH, Sabir S, Rehman K, 2020. Bisphenol A-induced metabolic disorders: from exposure to mechanism of action. Environ. Toxicol. Pharmacol. 77, 103373. [DOI] [PubMed] [Google Scholar]
- Aker AM, Ferguson KK, Rosario ZY, Mukherjee B, Alshawabkeh AN, Cordero JF, et al. , 2019. The associations between prenatal exposure to triclocarban, phenols and parabens with gestational age and birth weight in northern Puerto Rico. Environ. Res. 169, 41–51. [DOI] [PMC free article] [PubMed] [Google Scholar]
- Aquilina NJ, Delgado-Saborit JM, Meddings C, Baker S, Harrison RM, Jacob P 3rd, et al. , 2010. Environmental and biological monitoring of exposures to PAHs and ETS in the general population. Environ. Int. 36 (7), 763–771. [DOI] [PMC free article] [PubMed] [Google Scholar]
- Arbuckle TE, Davis K, Marro L, Fisher M, Legrand M, LeBlanc A, et al. , 2014. Phthalate and bisphenol A exposure among pregnant women in Canada–results from the MIREC study. Environ. Int. 68, 55–65. [DOI] [PubMed] [Google Scholar]
- ATSDR, 2002. Toxicological profile for di(2-ethylhexyl)phthalate update [online]. [PubMed]
- Barker DJ, 1990. The fetal and infant origins of adult disease. Bmj 301 (6761), 1111. [DOI] [PMC free article] [PubMed] [Google Scholar]
- Barkoski J, Bennett D, Tancredi D, Barr DB, Elms W, Hertz-Picciotto I, 2018. Variability of urinary pesticide metabolite concentrations during pregnancy in the MARBLES Study. Environ. Res. 165, 400–409. [DOI] [PMC free article] [PubMed] [Google Scholar]
- Berkowitz GS, Wetmur JG, Birman-Deych E, Obel J, Lapinski RH, Godbold JH, et al. , 2004. In utero pesticide exposure, maternal paraoxonase activity, and head circumference. Environ. Health Perspect. 112 (3), 388–391. [DOI] [PMC free article] [PubMed] [Google Scholar]
- Cantonwine DE, Cordero JF, Rivera-González LO, Anzalota Del Toro LV, Ferguson KK, Mukherjee B, et al. , 2014. Urinary phthalate metabolite concentrations among pregnant women in Northern Puerto Rico: distribution, temporal variability, and predictors. Environ. Int. 62, 1–11. [DOI] [PMC free article] [PubMed] [Google Scholar]
- Cathey AL, Eaton JL, Ashrap P, Watkins DJ, Rosario ZY, Vélez Vega C, et al. , 2021. Individual and joint effects of phthalate metabolites on biomarkers of oxidative stress among pregnant women in Puerto Rico. Environ. Int. 154, 106565. [DOI] [PMC free article] [PubMed] [Google Scholar]
- Cathey AL, Ferguson KK, McElrath TF, Cantonwine DE, Pace G, Alshawabkeh A, et al. , 2018. Distribution and predictors of urinary polycyclic aromatic hydrocarbon metabolites in two pregnancy cohort studies. Environ. Pollut. 232, 556–562. [DOI] [PMC free article] [PubMed] [Google Scholar]
- Cathey AL, Watkins DJ, Rosario ZY, Vélez Vega CM, Loch-Caruso R, Alshawabkeh AN, et al. , 2020. Polycyclic aromatic hydrocarbon exposure results in altered CRH, reproductive, and thyroid hormone concentrations during human pregnancy. Sci. Total Environ. 749, 141581. [DOI] [PMC free article] [PubMed] [Google Scholar]
- CDC & NCHS, 2011. National Health and Nutrition Examination Survey Data.
- CDC & NCHS, 2015. National Health and Nutrition Examination Survey Data.
- Chen Y-H, Ferguson KK, Meeker JD, McElrath TF, Mukherjee B, 2015. Statistical methods for modeling repeated measures of maternal environmental exposure biomarkers during pregnancy in association with preterm birth. Environ. Health : Global Access Sci. Sour. 14, 9, 9. [DOI] [PMC free article] [PubMed] [Google Scholar]
- Choi H, Wang L, Lin X, Spengler JD, Perera FP, 2012. Fetal window of vulnerability to airborne polycyclic aromatic hydrocarbons on proportional intrauterine growth restriction. PLoS One 7 (4), e35464. [DOI] [PMC free article] [PubMed] [Google Scholar]
- Colicino E, de Water E, Just AC, Navarro E, Pedretti NF, McRae N, et al. , 2021. Prenatal urinary concentrations of phthalate metabolites and behavioral problems in Mexican children: the Programming Research in Obesity, Growth Environment and Social Stress (PROGRESS) study. Environ. Res. 201, 111338. [DOI] [PMC free article] [PubMed] [Google Scholar]
- Curl CL, Beresford SA, Hajat A, Kaufman JD, Moore K, Nettleton JA, et al. , 2013. Associations of organic produce consumption with socioeconomic status and the local food environment: multi-Ethnic Study of Atherosclerosis (MESA). PLoS One 8 (7), e69778. [DOI] [PMC free article] [PubMed] [Google Scholar]
- DEP, 2021. Drinking Water Supply and Quality Report.
- Di Renzo GC, Conry JA, Blake J, DeFrancesco MS, DeNicola N, Martin JN Jr., et al. , 2015. International Federation of Gynecology and Obstetrics opinion on reproductive health impacts of exposure to toxic environmental chemicals. Int. J. Gynaecol. Obstet. 131 (3), 219–225. [DOI] [PMC free article] [PubMed] [Google Scholar]
- Drwal E, Rak A, Gregoraszczuk EL, 2019. Review: polycyclic aromatic hydrocarbons (PAHs)-Action on placental function and health risks in future life of newborns. Toxicology 411, 133–142. [DOI] [PubMed] [Google Scholar]
- England-Mason G, Merrill SM, Gladish N, Moore SR, Giesbrecht GF, Letourneau N, et al. , 2022. Prenatal exposure to phthalates and peripheral blood and buccal epithelial DNA methylation in infants: an epigenome-wide association study. Environ. Int. 163, 107183. [DOI] [PubMed] [Google Scholar]
- Farzan SF, Chen Y, Trachtman H, Trasande L, 2016. Urinary polycyclic aromatic hydrocarbons and measures of oxidative stress, inflammation and renal function in adolescents: NHANES 2003–2008. Environ. Res. 144 (Pt A), 149–157. [DOI] [PMC free article] [PubMed] [Google Scholar]
- Freije SL, Enquobahrie DA, Day DB, Loftus C, Szpiro AA, Karr CJ, et al. , 2022. Prenatal exposure to polycyclic aromatic hydrocarbons and gestational age at birth. Environ. Int. 164, 107246. [DOI] [PMC free article] [PubMed] [Google Scholar]
- Gore AC, Chappell VA, Fenton SE, Flaws JA, Nadal A, Prins GS, et al. , 2015. EDC-2: the endocrine society’s second scientific statement on endocrine-disrupting chemicals. Endocr. Rev. 36 (6), E1–e150. [DOI] [PMC free article] [PubMed] [Google Scholar]
- Grandjean P, Landrigan PJ, 2014. Neurobehavioural effects of developmental toxicity. Lancet Neurol. 13 (3), 330–338. [DOI] [PMC free article] [PubMed] [Google Scholar]
- Guo Y, Alomirah H, Cho HS, Minh TB, Mohd MA, Nakata H, et al. , 2011. Occurrence of phthalate metabolites in human urine from several Asian countries. Environ. Sci. Technol. 45 (7), 3138–3144. [DOI] [PubMed] [Google Scholar]
- Han F, Guo H, Hu J, Zhang J, Ying Q, Zhang H, 2020. Sources and health risks of ambient polycyclic aromatic hydrocarbons in China. Sci. Total Environ. 698, 134229. [DOI] [PubMed] [Google Scholar]
- Heindel JJ, 2019. The developmental basis of disease: update on environmental exposures and animal models. Basic Clin. Pharmacol. Toxicol. 125 (Suppl. 3), 5–13. [DOI] [PubMed] [Google Scholar]
- Heindel JJ, Skalla LA, Joubert BR, Dilworth CH, Gray KA, 2017. Review of developmental origins of health and disease publications in environmental epidemiology. Reprod. Toxicol. 68, 34–48. [DOI] [PubMed] [Google Scholar]
- Jeong H, 2010. Altered drug metabolism during pregnancy: hormonal regulation of drug-metabolizing enzymes. Expet Opin. Drug Metabol. Toxicol. 6 (6), 689–699. [DOI] [PMC free article] [PubMed] [Google Scholar]
- Jia C, Batterman S, 2010. A critical review of naphthalene sources and exposures relevant to indoor and outdoor air. Int. J. Environ. Res. Publ. Health 7 (7), 2903–2939. [DOI] [PMC free article] [PubMed] [Google Scholar]
- Kahn LG, Philippat C, Nakayama SF, Slama R, Trasande L, 2020. Endocrine-disrupting chemicals: implications for human health. Lancet Diabetes Endocrinol. 8 (8), 703–718. [DOI] [PMC free article] [PubMed] [Google Scholar]
- Koo TK, Li MY, 2016. A guideline of selecting and reporting intraclass correlation coefficients for reliability research. J. Chiropr. Med. 15 (2), 155–163. [DOI] [PMC free article] [PubMed] [Google Scholar]
- Kuiper JR, O’Brien KM, Welch BM, Barrett ES, Nguyen RHN, Sathyanarayana S, et al. , 2022. Combining urinary biomarker data from studies with different measures of urinary dilution. Epidemiology 33 (4), 533–540. [DOI] [PMC free article] [PubMed] [Google Scholar]
- Lanphear BP, 2017. Low-level toxicity of chemicals: No acceptable levels? PLoS Biol. 15 (12), e2003066. [DOI] [PMC free article] [PubMed] [Google Scholar]
- Levy JI, Bennett DH, Melly SJ, Spengler JD, 2003. Influence of traffic patterns on particulate matter and polycyclic aromatic hydrocarbon concentrations in Roxbury, Massachusetts. J. Expo. Sci. Environ. Epidemiol. 13 (5), 364–371. [DOI] [PubMed] [Google Scholar]
- Li AJ, Banjabi AA, Takazawa M, Kumosani TA, Yousef JM, Kannan K, 2020. Serum concentrations of pesticides including organophosphates, pyrethroids and neonicotinoids in a population with osteoarthritis in Saudi Arabia. Sci. Total Environ. 737, 139706. [DOI] [PubMed] [Google Scholar]
- Li J, Wu C, Zhao H, Zhou Y, Cao G, Yang Z, et al. , 2019. Exposure assessment of bisphenols in Chinese women during pregnancy: a longitudinal study. Environ. Sci. Technol. 53 (13), 7812–7820. [DOI] [PubMed] [Google Scholar]
- Li LX, Chen L, Meng XZ, Chen BH, Chen SQ, Zhao Y, et al. , 2013. Exposure levels of environmental endocrine disruptors in mother-newborn pairs in China and their placental transfer characteristics. PLoS One 8 (5), e62526. [DOI] [PMC free article] [PubMed] [Google Scholar]
- Liao C, Kannan K, 2014. A survey of bisphenol A and other bisphenol analogues in foodstuffs from nine cities in China. Food Addit. Contam. Part A Chem Anal Control Expo Risk Assess 31 (2), 319–329. [DOI] [PubMed] [Google Scholar]
- Liu H, Wang Y, Kannan K, Liu M, Zhu H, Chen Y, et al. , 2022. Determinants of phthalate exposures in pregnant women in New York City. Environ. Res. 212, 113203. [DOI] [PMC free article] [PubMed] [Google Scholar]
- Liu J, Wattar N, Field CJ, Dinu I, Dewey D, Martin JW, 2018. Exposure and dietary sources of bisphenol A (BPA) and BPA-alternatives among mothers in the APrON cohort study. Environ. Int. 119, 319–326. [DOI] [PubMed] [Google Scholar]
- Loftus CT, Bush NR, Day DB, Ni Y, Tylavsky FA, Karr CJ, et al. , 2021. Exposure to prenatal phthalate mixtures and neurodevelopment in the conditions affecting neurocognitive development and learning in early childhood (CANDLE) study. Environ. Int. 150, 106409. [DOI] [PMC free article] [PubMed] [Google Scholar]
- MacPherson S, Arbuckle TE, Fisher M, 2018. Adjusting urinary chemical biomarkers for hydration status during pregnancy. J. Expo. Sci. Environ. Epidemiol. 28 (5), 481–493. [DOI] [PMC free article] [PubMed] [Google Scholar]
- McGraw J, Waller D, 2012. Cytochrome P450 variations in different ethnic populations. Expet Opin. Drug Metabol. Toxicol. 8 (3), 371–382. [DOI] [PubMed] [Google Scholar]
- Meeker JD, Cantonwine DE, Rivera-González LO, Ferguson KK, Mukherjee B, Calafat AM, et al. , 2013. Distribution, variability, and predictors of urinary concentrations of phenols and parabens among pregnant women in Puerto Rico. Environ. Sci. Technol. 47 (7), 3439–3447. [DOI] [PMC free article] [PubMed] [Google Scholar]
- Mulder TA, van den Dries MA, Korevaar TIM, Ferguson KK, Peeters RP, Tiemeier H, 2019. Organophosphate pesticides exposure in pregnant women and maternal and cord blood thyroid hormone concentrations. Environ. Int. 132, 105124. [DOI] [PMC free article] [PubMed] [Google Scholar]
- Nowak K, Jabłońska E, Ratajczak-Wrona W, 2019. Immunomodulatory effects of synthetic endocrine disrupting chemicals on the development and functions of human immune cells. Environ. Int. 125, 350–364. [DOI] [PubMed] [Google Scholar]
- Ntantu Nkinsa P, Muckle G, Ayotte P, Lanphear BP, Arbuckle TE, Fraser WD, et al. , 2020. Organophosphate pesticides exposure during fetal development and IQ scores in 3 and 4-year old Canadian children. Environ. Res. 190, 110023. [DOI] [PubMed] [Google Scholar]
- O’Brien KM, Upson K, Cook NR, Weinberg CR, 2016. Environmental chemicals in urine and blood: improving methods for creatinine and lipid adjustment. Environ. Health Perspect. 124 (2), 220–227. [DOI] [PMC free article] [PubMed] [Google Scholar]
- Pacyga DC, Sathyanarayana S, Strakovsky RS, 2019. Dietary predictors of phthalate and bisphenol exposures in pregnant women. Adv. Nutr. 10 (5), 803–815. [DOI] [PMC free article] [PubMed] [Google Scholar]
- Padilla I, Irizarry C, Steele K, 2011. Historical contamination of groundwater resources in the north coast karst aquifers of Puerto Rico. Rev. Dimens. 3, 7–12. [PMC free article] [PubMed] [Google Scholar]
- Perera FP, Illman SM, Kinney PL, Whyatt RM, Kelvin EA, Shepard P, et al. , 2002. The challenge of preventing environmentally related disease in young children: community-based research in New York City. Environ. Health Perspect. 110 (2), 197–204. [DOI] [PMC free article] [PubMed] [Google Scholar]
- Polinski KJ, Dabelea D, Hamman RF, Adgate JL, Calafat AM, Ye X, et al. , 2018. Distribution and predictors of urinary concentrations of phthalate metabolites and phenols among pregnant women in the Healthy Start Study. Environ. Res. 162, 308–317. [DOI] [PMC free article] [PubMed] [Google Scholar]
- Rodríguez-Carmona Y, Ashrap P, Calafat AM, Ye X, Rosario Z, Bedrosian LD, et al. , 2020. Determinants and characterization of exposure to phthalates, DEHTP and DINCH among pregnant women in the PROTECT birth cohort in Puerto Rico. J. Expo. Sci. Environ. Epidemiol. 30 (1), 56–69. [DOI] [PMC free article] [PubMed] [Google Scholar]
- Rosner B, 2011. Fundamentals of Biostatistics. Cengage Learning, Boston, MA. [Google Scholar]
- Serrano SE, Karr CJ, Seixas NS, Nguyen RH, Barrett ES, Janssen S, et al. , 2014. Dietary phthalate exposure in pregnant women and the impact of consumer practices. Int. J. Environ. Res. Publ. Health 11 (6), 6193–6215. [DOI] [PMC free article] [PubMed] [Google Scholar]
- Shin HM, Dhar U, Calafat AM, Nguyen V, Schmidt RJ, Hertz-Picciotto I, 2020. Temporal trends of exposure to phthalates and phthalate alternatives in California pregnant women during 2007–2013: comparison with other populations. Environ. Sci. Technol. 54 (20), 13157–13166. [DOI] [PMC free article] [PubMed] [Google Scholar]
- Singh L, Varshney JG, Agarwal T, 2016. Polycyclic aromatic hydrocarbons’ formation and occurrence in processed food. Food Chem. 199, 768–781. [DOI] [PubMed] [Google Scholar]
- Slotkin TA, 2011. Does early-life exposure to organophosphate insecticides lead to prediabetes and obesity? Reprod. Toxicol. 31 (3), 297–301. [DOI] [PMC free article] [PubMed] [Google Scholar]
- Sokoloff K, Fraser W, Arbuckle TE, Fisher M, Gaudreau E, LeBlanc A, et al. , 2016. Determinants of urinary concentrations of dialkyl phosphates among pregnant women in Canada - results from the MIREC study. Environ. Int. 94, 133–140. [DOI] [PubMed] [Google Scholar]
- Sol CM, van Zwol-Janssens C, Philips EM, Asimakopoulos AG, Martinez-Moral MP, Kannan K, et al. , 2021. Maternal bisphenol urine concentrations, fetal growth and adverse birth outcomes: a population-based prospective cohort. Environ. Health 20 (1), 60. [DOI] [PMC free article] [PubMed] [Google Scholar]
- Sun Q, Yue P, Deiuliis JA, Lumeng CN, Kampfrath T, Mikolaj MB, et al. , 2009. Ambient air pollution exaggerates adipose inflammation and insulin resistance in a mouse model of diet-induced obesity. Circulation 119 (4), 538–546. [DOI] [PMC free article] [PubMed] [Google Scholar]
- Trasande L, Ghassabian A, Kahn LG, Jacobson MH, Afanasyeva Y, Liu M, et al. , 2020. The NYU children’s health and environment study. Eur. J. Epidemiol. 35 (3), 305–320. [DOI] [PMC free article] [PubMed] [Google Scholar]
- Wang Y, Wu Y, Jacobson MH, Lee M, Jin P, Trasande L, et al. , 2020. A family of partial-linear single-index models for analyzing complex environmental exposures with continuous, categorical, time-to-event, and longitudinal health outcomes. Environ. Health 19 (1), 96. [DOI] [PMC free article] [PubMed] [Google Scholar]
- Weaver VM, Kotchmar DJ, Fadrowski JJ, Silbergeld EK, 2016. Challenges for environmental epidemiology research: are biomarker concentrations altered by kidney function or urine concentration adjustment? J. Expo. Sci. Environ. Epidemiol. 26 (1), 1–8. [DOI] [PubMed] [Google Scholar]
- West-Eberhard MJ, 1989. Phenotypic plasticity and the origins of diversity. Annu. Rev. Ecol. Systemat. 20 (1), 249–278. [Google Scholar]
- Zhang X, Barr DB, Dunlop AL, Panuwet P, Sarnat JA, Lee GE, et al. , 2022. Assessment of metabolic perturbations associated with exposure to phthalates among pregnant African American women. Sci. Total Environ. 818, 151689. [DOI] [PMC free article] [PubMed] [Google Scholar]
- Zhang Z, Alomirah H, Cho HS, Li YF, Liao C, Minh TB, et al. , 2011. Urinary bisphenol A concentrations and their implications for human exposure in several Asian countries. Environ. Sci. Technol. 45 (16), 7044–7050. [DOI] [PubMed] [Google Scholar]
- Zheng Z, Xu X, Zhang X, Wang A, Zhang C, Hüttemann M, et al. , 2013. Exposure to ambient particulate matter induces a NASH-like phenotype and impairs hepatic glucose metabolism in an animal model. J. Hepatol. 58 (1), 148–154. [DOI] [PMC free article] [PubMed] [Google Scholar]
- Zhu H, Martinez-Moral MP, Kannan K, 2021. Variability in urinary biomarkers of human exposure to polycyclic aromatic hydrocarbons and its association with oxidative stress. Environ. Int. 156, 106720. [DOI] [PMC free article] [PubMed] [Google Scholar]
Associated Data
This section collects any data citations, data availability statements, or supplementary materials included in this article.
Supplementary Materials
Data Availability Statement
Data will be made available on request.