FIG 6.
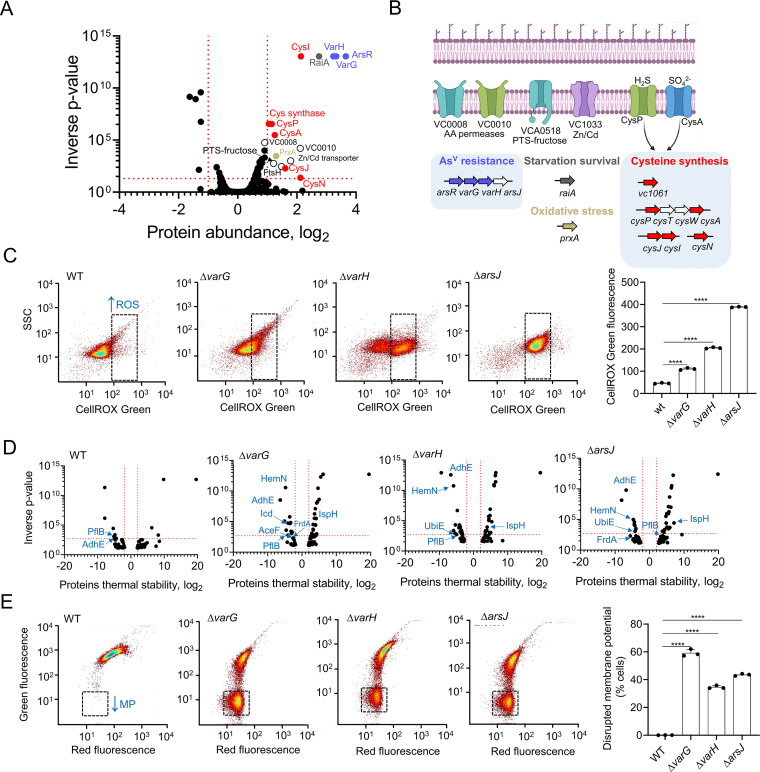
Oxidative stress response and membrane potential alterations of V. cholerae WT and the var mutants. (A) Volcano plot of LIMMA analysis output depicting read fold change (log2) of protein abundance and inverse P value for each protein queried in the proteomic screen in response to 1 mM AsV in V. cholerae WT. Red dotted lines indicate arbitrary thresholds of a fold change (log2) of >1 or <1 and an inverse P value of >20. Var proteins are labeled in blue and oxidative stress related proteins (cysteine biosynthesis and PrxA are labeled as in described in panel B). (B) Schematic of the systems induced in response to AsV in V. cholerae. White coloured genes depict undetected genes within an operon. (C) Representative dot plots from V. cholerae WT and var mutant cells stained with CellRox green following growth in the presence of 1 mM AsV for 5 h. The black dotted gate indicates an area with higher CellRox fluorescence (higher ROS levels). (D) Volcano plot of LIMMA analysis output depicting the read fold change (log2) of protein thermal stability and inverse P value for each protein queried in the proteomic screen in response to 1 mM AsV in V. cholerae WT and var mutant strains. AsV interacting proteins related to energy-generating pathways are labeled in blue. PflB, VC1866 formate acetyltransferase; AdhE, VC2033 alcohol dehydrogenase/acetaldehyde dehydrogenase; HemN, VC0116 oxygen-independent coproporphyrinogen III oxidase; Icd, VC1141 isocitrate dehydrogenase; FrdA, VC2656 fumarate reductase; IspH, 4-hydroxy-3-methylbut-2-enyl diphosphate reductase; AceF, VC2413 pyruvate dehydrogenase, E2 component; UbiE, VC0083 ubiquinone/menaquinone biosynthesis methyltransferase. (E) Representative dot plots from V. cholerae WT and var mutant cells stained with DiOC2 following growth in the presence of 1 mM AsV for 5 h. The black dotted gate indicates an area with lowered green fluorescence (lower membrane potential). Data are the mean of three biological replicates ± SEM.

