Abstract
Denaturing gradient gel electrophoresis (DGGE) was used to study the diversity of hepatitis C virus (HCV) quasispecies. Optimized DGGE running conditions were applied to screen for variations in sequences cloned from amplicons originating from the nonstructural 5b (NS5b) gene of HCV in blood of hemophilia patients, intravenous drug users, and blood donors (five specimens from each study group, ca. 40 clones studied per specimen). Clones identified by DGGE as unique were sequenced. NS5b sequence entropy and mean genetic distance in hemophiliacs did not differ significantly from those in the other groups, pointing to a lack of correlation between HCV diversity and the multiplicity of past HCV exposures. DGGE was also applied to investigate variation in the HCV envelope 2/hypervariable region 1 (E2/HVR-1) in serum samples serially taken from two patients during the seroconversion phase of HCV infection. E2/HVR-1 sequence entropy changes were small and not correlated with rising anti-HCV antibody levels, reflecting mutational changes not mediated by antibody selection.
Most studies assessing the diversity of hepatitis C virus (HCV) quasispecies are conducted by amplifying selected portions of the genome by PCR, isolating individual subgenomic fragments by a cloning procedure, and then characterizing the nucleotide sequence of each clone 15, 17, 20. Evaluating the diversity of HCV quasispecies in clinical specimens often requires the sequencing of a large number of clones. Less onerous procedures, e.g., those that analyze single-strand conformation polymorphism and heteroduplex mobility of PCR amplicons, have been described 11, 18, 26. We have developed an alternative procedure based on denaturing gradient gel electrophoresis (DGGE) 10 that permits intrahost HCV genetic diversity to be screened more comprehensively.
In the DGGE procedure, double-stranded (ds) DNA is electrophoresed through an acrylamide gel containing a gradient of denaturant that increases in the direction of electrophoresis. The DNA molecules melt when they reach a part of the gel that is sufficiently denaturing. At this position, denaturation starts to occur at melting domains of the molecule. As electrophoresis proceeds, conditions become more denaturing and more domains melt. Single-stranded domains, as they are formed, retard the movement of the DNA through the gel matrix. Sequence differences of as little as 1 base can dramatically alter the stability of the melting domains. However, at positions of the gel where the concentration of denaturants is high, DNA can become completely single stranded and the migration is no longer dependent on sequence. To prevent complete denaturation of ds DNA, a “GC-clamp” is attached to one of the PCR primers, facilitating the detection of mutations along the whole length of a DNA molecule 23. The sensitivity of DGGE in distinguishing between mutations is highly dependent on the quality of the gradient gels and the differences in migratory positions of DNA molecules and is not necessarily related to the number of nucleotide differences.
Nucleotide variation in three subgenomic regions, the 5′ noncoding region (5′NCR), the nonstructural 5b (NS5b) gene, and hypervariable region 1 of the envelope glycoprotein 2-coding (E2/HVR-1) region was investigated. The 5′NCR is a highly conserved region of the genome. Nucleotide variations therein permit genotypes to be assigned, allowing inferences of how HCV evolves over long intervals (decades and centuries) to be drawn 3. In this study, PCR clones derived from 5′NCR were used to optimize DGGE running conditions and to determine if DGGE can discriminate between sequences with single-nucleotide changes. The NS5b gene is a relatively variable subgenomic region 1, 13, 14. It displays a diversity wide enough to allow observation of how the HCV genome drifts over a relatively short period (months and years) 25. In our study, clones amplified from this region were used to test whether the optimized DGGE conditions were adequate to screen a large array of PCR clones bearing a variety of sequence changes and to investigate if its sequence diversity differs between HCV-infected people belonging to different at-risk groups. E2/HVR1 is the most hypermutable locus of the HCV genome 6. It exhibits the highest sequence diversity of any region of the genome, encoding a 27-amino-acid peptide at the amino terminus of the E2 gene against which the host antibody response is targeted 28, 29. The DGGE procedure was applied to E2/HVR-1 to study how the HCV quasispecies changes during the early (seroconverting) phase of acute infection 2, 7, 16.
MATERIALS AND METHODS
Specimens.
For studies of variation in 5′NCR and the NS5b region, we used sera from 15 HCV RNA-positive individuals referred to our laboratory for confirmatory testing. Five serum samples were from hemophilia patients, five were from injecting drug users (IDUs) and five were from blood donors. All the individuals were known not to have undergone antiviral therapy. The hemophilia patients had received clotting-factor therapy before anti-HCV antibody screening became routine in blood donor centres. To investigate E2/HVR-1 evolution in the early, acute phase of infection, panels of serum samples each serially taken from two plasma donors undergoing HCV seroconversion was used. These specimens were purchased from Bioclinical Partners Inc. (Franklin, Mass.) (catalogue numbers HCV6211 and HCV6214).
PCR amplification and cloning.
RNA was extracted from 100 μl of sera or plasma using the Amplicor HCV specimen preparation kit (Roche Diagnostic Systems, Branchburg, Calif.). The final pellet was resuspended in 50 μl of nuclease-free water. Extracted RNA (22.2 μl) was reverse transcribed in 5 mM MgCl2–1 mM each deoxynucleoside triphosphate (dNTP)–3.3 μM random hexamers–0.34 U of RNasin (Promega, Madison, Wis.)–5 U of Moloney murine leukemia virus reverse transcriptase (Life Technologies, Paisley, United Kingdom).
Amplification from the 5′NCR was carried out in 50-μl reaction volumes each containing 10 μl of cDNA solution, 1.5 mM MgCl2, 1 mM each dNTP, 25 pmol of sense primer 126 (5′GTGGTCTGCGGAACCGG), 25 pmol of antisense primer 299 (5′GGGCACTCGCAAGCACCC) 12, and 0.7 U of EXPAND high-fidelity polymerase (Roche Molecular Biochemicals, Lewes, United Kingdom). The reaction mixtures were heated to 94°C for 30 s, and this was followed by 35 cycles of 94°C for 30 s, 65°C for 40 s, and 72°C for 50 s and a final cycle of 30 s at 72°C. This primer pair amplified a 174-bp fragment between genomic positions −199 and −26.
Amplification from the NS5b gene was carried out in 50-μl reaction mixtures each containing 10 μl of cDNA, 0.7 U of EXPAND high-fidelity polymerase, 25 pmol of sense primer 1204 (5′GGAGGGGCGGAATACCTGGTCATAGCCTCCGTGAA), 25 pmol of antisense primer 1203 (5′ATGGGGTTCTCGTATGATACCCGCTGCTTTGACTC), and 1 mM each dNTP in Opti-prime PCR buffer 4 (Stratagene, La Jolla, Calif.). The reaction mixtures were heated to 94°C for 30 s, and this was followed by 35 cycles of 94°C for 30 s, 54°C for 40 s, and 72°C for 50 s and a final cycle of 30 s at 72°C. The sequence amplified is a 401-bp fragment between positions 7903 and 8309.
Amplification of the E2/HVR-1 region was carried out in 50-μl reaction mixtures containing 10 μl of cDNA in 5 mM MgCl2, 1 mM each dNTP, 25 pmol of sense primer HVR-S2 (5′TACTACTCCATGGTGGGAGACTGGGC) 27, 25 pmol of antisense primer HVR-A2 (5′GATGTGCCAGCTGCCATTGG), and 0.7 U of EXPAND high-fidelity polymerase. The reaction mixtures were heated to 94°C for 1 min, and this was followed by 30 cycles of 94°C for 1 min, 56°C for 1 min, and 72°C for 1 min. These primers amplify a 189-bp product between positions 1082 and 1271 of the HCV genome 4.
PCR products were cloned using the TOPO TA cloning kit (Invitrogen BV, De Schelp, The Netherlands). Colonies with inserts from the three subgenomic regions were picked and amplified directly using PCR conditions described above. The number of cycles was reduced to 20 for amplification of the 5′NCR and E2/HVR-1 sequences. A GC clamp sequence (5′CGCCCGCCGCGCCCCGCGCCCGTCCCGCCGCCCCCGCCCG) was incorporated in the 5′ end of the forward primer sequences (HVR-S2, sense 126, and sense 1204) during PCR to prevent complete denaturation of ds DNA during DGGE 23.
DGGE analysis.
The denaturing-gradient polyacrylamide gel was prepared as follows. Acrylamide solutions were prepared as two stock solutions. For 5′NCR and NS5b analysis, one solution contained 30% denaturants consisting of 12% polyacrylamide (supplied as Protogel by National Diagnostics, Hull, United Kingdom), 12% formamide, and 2.1 M urea in 0.6× Tris-acetate-EDTA (TAE) buffer, and the second solution contained 70% denaturants consisting of 12% polyacrylamide, 28% formamide, and 4.9 M urea in 0.6× TAE buffer. For analysis of the E2/HVR-1, these solutions were diluted down to 10 and 65% denaturants, respectively, using an acrylamide solution that contained no denaturants. The gradient gel was formed by transferring, using a gravity-driven gradient maker (GRI, Braintree, United Kingdom), 30 ml of each gel solution between the glass plates of the Ingeny Phor U2 vertical electrophoresis apparatus (GRI). This apparatus allows two gels to be made for each electrophoresis run. Wells in each gel were formed with a 48-well square-toothed comb, after which the gels were allowed to polymerize for 1 h. PCR products (3 to 5 μl of each) were mixed with 2 to 4 μl of loading dye and applied to the gel. Electrophoresis was carried out in 0.6× TAE buffer at 60°C and 100 V for 16 h. Running buffer was continuously circulated to maintain a constant temperature throughout the electrophoresis tank. The gels were stained with SYBR Green I (Flowgen; Lichfield, Staffordshire, United Kingdom), and bands were visualized by UV transillumination.
Sequence analysis.
Following DGGE, the migration positions of the various PCR products were first inspected. For cloned products, the migration position of the dominant clone was identified. The PCR product from a representative dominant clone was then chosen for sequencing, together with products that yielded migration positions different from the dominant clone. PCR products were purified by electrophoresis through 2% agarose followed by excision of the appropriate band. DNA was recovered using the Igenie DNA extraction kit (Immunogen, Sunderland, United Kingdom). The 5′NCR products were sequenced with the ABI Prism DNA sequencing kit (PE Applied Biosciences, Warrington, United Kingdom), and electrophoresis was carried out using the ABI 373 automated sequencer. The NS5b products were sequenced using ABI prism Big Dye terminator sequencing kit, which particularly facilitated characterization of the sequence of the entire length of the amplicon in both the forward and reverse directions.
Sequences were aligned and compared using the CLUSTAL V algorithm in the MEGALIGN program of the LASERGENE package (DNASTAR Inc, Madison, Wis.). Phylogenetic analysis was also carried out using DNADIST and FITCH from the PHYLIP suite of programs and TREEVIEW to generate dendrograms 9.
Statistical analysis.
Sequence data from the NS5b segment formed the basis for the determination of HCV genetic diversity. Shannon entropy (Sn) values were calculated as a measure of genetic complexity. They incorporate the number of sequence variants, the frequency of each variant, and the total number of variants analyzed 21
 |
where N = total number of sequences and pi = frequency of each sequence. Sn values can range from 0 (when 1 variant is present) to 1 (where each variant occurs once). The data were first verified to be normal by Shapiro-Wilks testing. Student's t testing of mean values and variance ratio testing of standard deviations were then applied. Genetic diversity was calculated as the average genetic distance between species, using the CLUSTAL V algorithm. The statistical significance of differences in Sn and genetic distance values between groups was evaluated using the Kruskal-Wallis test.
Nucleotide sequence accession numbers.
Sequences were deposited in GenBank under accession numbers AF282631 to AF282674 and AY003921 to AY004035.
RESULTS
Optimizing DGGE running conditions using 5′NCR amplicons.
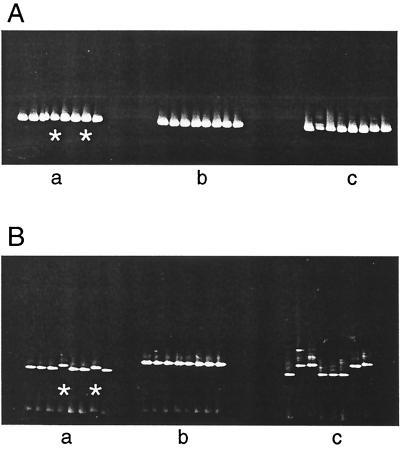
Two patients chronically infected with HCV were used for the optimization of the DGGE technique. A fragment of the HCV 5′NCR was amplified, by PCR, from the sera of these patients and then cloned. PCR products derived from the resulting colonies had a GC clamp attached and were then analyzed by DGGE. In addition, 5′NCR PCR products from a further eight patients were used in the optimization process. These were not cloned. Two of the colony PCR products from one patient, CHC001, differed by a 1-nucleotide (nt) substitution from each other and from the dominant clones. The sequences of colony products derived from the other patient, CHC002, were all identical. These products were then analyzed by DGGE using a 0 to 80% denaturant gradient. Initial electrophoresis conditions were 200 V for 6 h at 60°C. Figure 1A shows the final migratory positions of the two sets of colony PCR products attained under these DGGE conditions (panels a and b; the two products with different sequences are indicated by asterisks in panel a). Thus, while these DGGE conditions reproducibly led to uniform migration of DNA sharing the same sequence, they failed to distinguish DNA products bearing 1-nt changes. Panel c of Fig. 1A shows that there was little difference in the migratory positions reached in noncloned amplicons derived from the 5′NCR of HCV carried by the eight individuals.
FIG. 1.
DGGE gel migratory positions of colony PCR products amplified from the 5′NCR of HCV in sera of two patients with chronic hepatitis C, CHC001 and CHC002 (panels a and b, respectively) and 5′NCR PCR products directly amplified from eight different HCV carriers (panel c). Sequences of two of the colony products from CHC001 (indicated by asterisks in panel a) differ by 1 nt between each other and the dominant clone; sequences of the colony products from CHC002 are all identical. (A) Positions attained after electrophoresis through a 0 to 80% denaturant gradient. (B) Positions attained after electrophoresis through a 30 to 70% gradient.
Narrower gradients were empirically tested using the same panel of colony and noncloned PCR products to determine the gradient that would result in the clear resolution of unique variants. The best result was achieved using a 30 to 70% gradient. Figure 1B shows the migratory positions of these PCR products through such a gradient. Cloned sequences bearing 1-nt substitutions (panel a) and noncloned sequences from different HCV carriers could then be discriminated (panel c). Increasing the electrophoresis time for the DGGE procedure to 16 h (overnight) and reducing the voltage to 100 V did not alter discrimination (data not shown). Forty colony 5′NCR products derived from five hemophiliacs, five IDUs, and five blood donors were systematically studied using the overnight running conditions. For each set of clones, clones whose reamplified DNA products resulted in DGGE bands migrating to positions different from each other were subjected to DNA sequencing analyses. In all cases, products of 5′NCR-derived clones yielding minority DGGE banding positions were found to carry sequences differing from the majority sequence (data not shown).
The G+C content of a DNA fragment predicts the denaturing conditions under which it will be completely retarded in the gel matrix. We predicted that, having a lower G+C content than the 5′NCR, both the NS5b and E2/HVR-1 fragments would be resolved in a lower concentration of denaturants. This allowed us to analyze NS5b-derived clones on the upper half of the gel used to analyze 5′NCR-derived clones. For the E2/HVR-1 colony products, a gel with a denaturing gradient of 10 to 65% was used. In initial DGGE runs, five or six of the dominant colony products derived from both the NS5b and E2/HVR-1 were sequenced to confirm that minor variants could indeed be detected. In later runs, two or three dominant colony products were sequenced.
DGGE and sequence analysis of NS5b-amplified clones from individuals belonging to different risk groups.
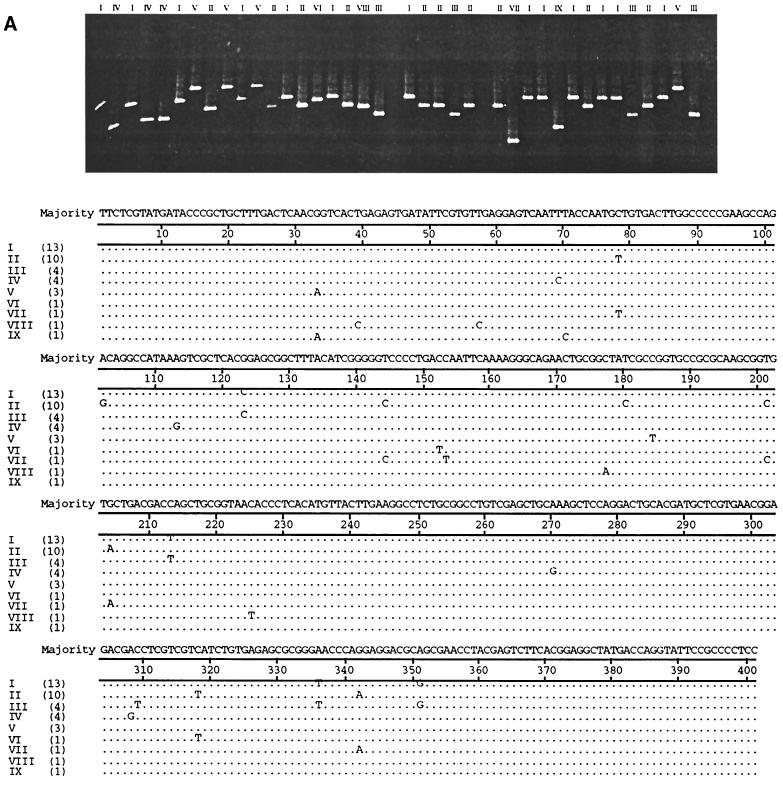
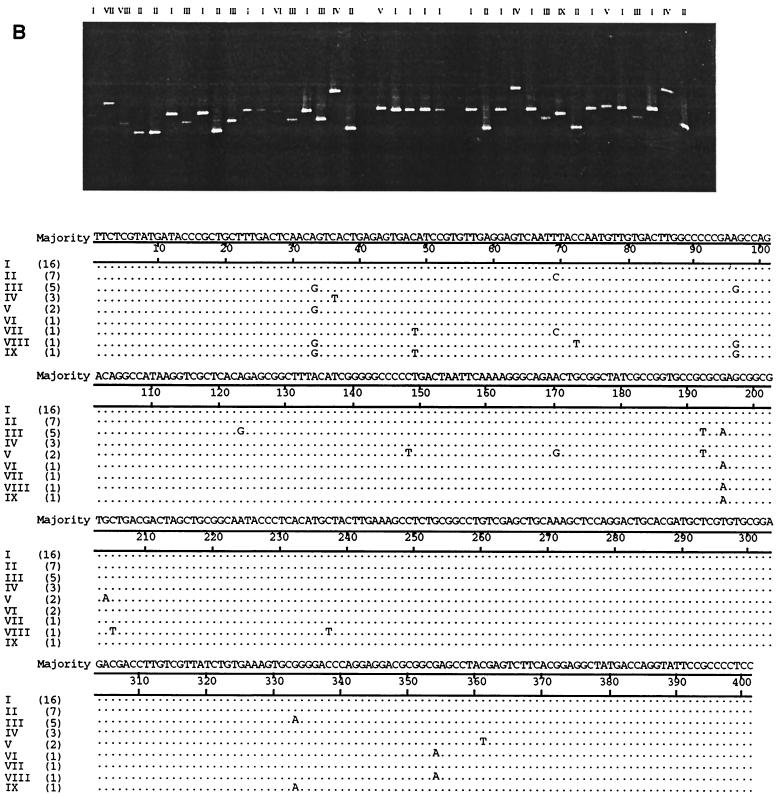
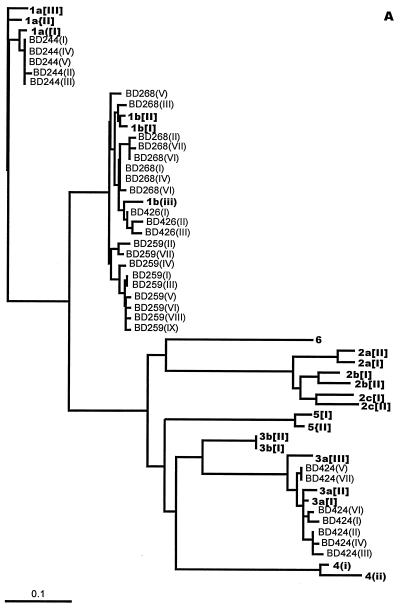
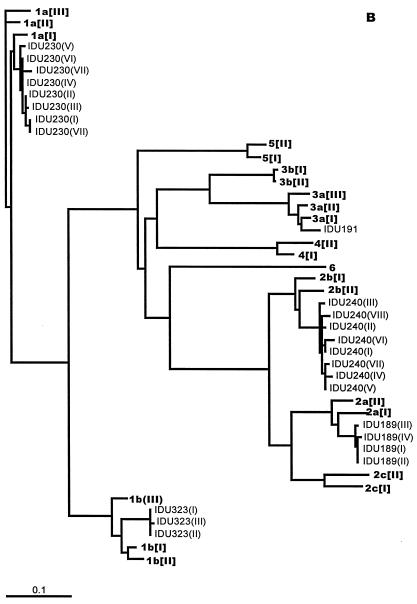
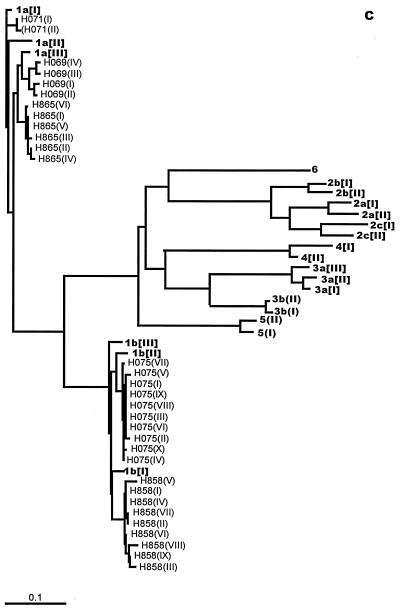
Intrahost NS5b variation in the hemophilia patients, IDUs, and blood donors (five from each group) was then studied using DGGE conditions optimized for the analysis of 5′NCR clones. As with the study of 5′NCR variation, every product of each individual screened by DGGE to yield a banding position different from the majority position was processed for DNA sequencing. Figure 2 illustrates representative DGGE bands obtained and the sequence changes that accounted for the different positions in clones from a blood donor (BD259) (Fig. 2A) and a hemophilia patient (H858) (Fig. 2B). PCR products whose sequences differed by as little as 1 nt regularly migrated to different positions. Figure 3 displays dendrograms illustrating NS5b sequence diversity in individuals from the three study groups. Sequences from each individual tended to cluster tightly, segregated away from clusters of sequences from other individuals in the same genotype. This tight clustering is the result of nucleotide substitutions occurring at one to three sites along different positions of the NS5b amplicon in the minority variants (the complete sequence data are in GenBank). Only in two individuals (BD268 and BD424) was a single substitution observed at the same site in a small proportion of minority variants (BD268 III and V, and BD424 V and VII); such an occurrence leads to positioning of these minority variants away from the main cluster (Fig. 3A).
FIG. 2.
The upper panels show DGGE gel migratory positions of colony PCR products amplified from the HCV NS5b subgenomic region from serum of blood donor BD259 (A) and hemophilia patient H858 (B). The lower panels show a comparison of nucleotide sequences characterized after unique sequences were screened by the DGGE procedure. Colony products with unique sequences are assigned different Roman numerals at the top of the upper panels and to the left of the lower panels. Numbers in parentheses in the lower panels denote the number of clones with the unique sequences.
FIG. 3.
Unrooted tree showing the diversity of NS5b sequences cloned from serum blood donors (A), IDUs (B), and hemophilia patients (C). Sequences from study individuals are shown in plain type; Roman numerals in parentheses denote unique sequences found within each specimen. Representative sequences obtained from the GenBank database are shown in bold type. The number and line at the bottom denote the proportion of nucleotides substituted for a given horizontal branch length. Dendrograms were produced using DNADIST, FITCH, and TREEVIEW in the PHYLIP suite of programs.
Table 1 summarizes the entropy and genetic diversity values derived from NS5b sequences. Although the median Sn and GD values in the blood donor group are higher than those in the other two groups, the differences between the groups were not significant. Comparison of the variant NS5b sequences identified from each sample with sequences deposited in GenBank showed five of the individuals to be infected by type 1a, six to be infected by 1b, one to be infected by 2a, one to be infected by 2b, and two to be infected by 3a. None were infected with more than one genotype or subtype.
TABLE 1.
Comparison of median values and ranges for HCV NS5b entropy and genetic distance in three at-risk groups
| Group | Median entropy (range) | Median genetic diversity (range) |
|---|---|---|
| Blood donors | 0.256 (0.205–0.502) | 1.58 (0.83–1.93) |
| IDUs | 0.103 (0–0.387) | 0.53 (0–1.24) |
| Hemophiliacs | 0.176 (0.036–0.466) | 0.89 (0.72–1.45) |
Analysis of changes in the E2/HVR-1 region during HCV seroconversion.
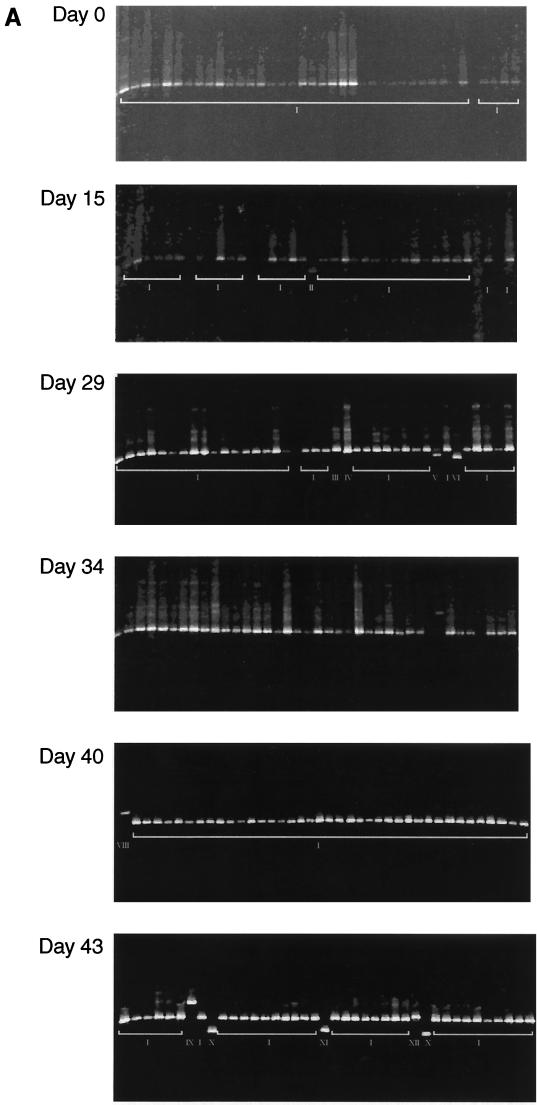
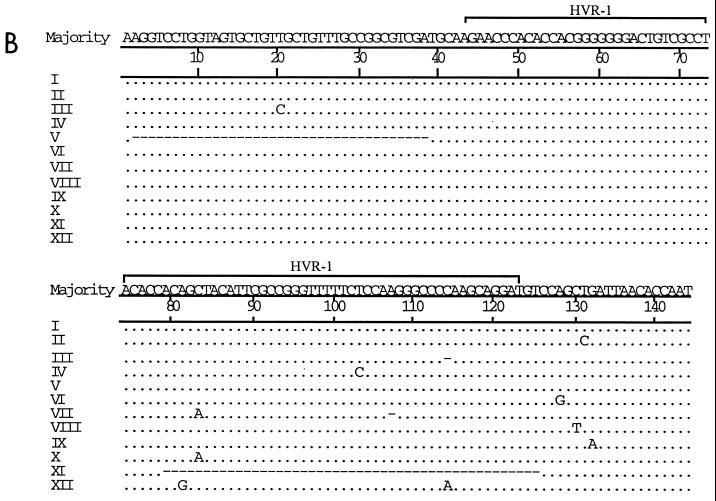
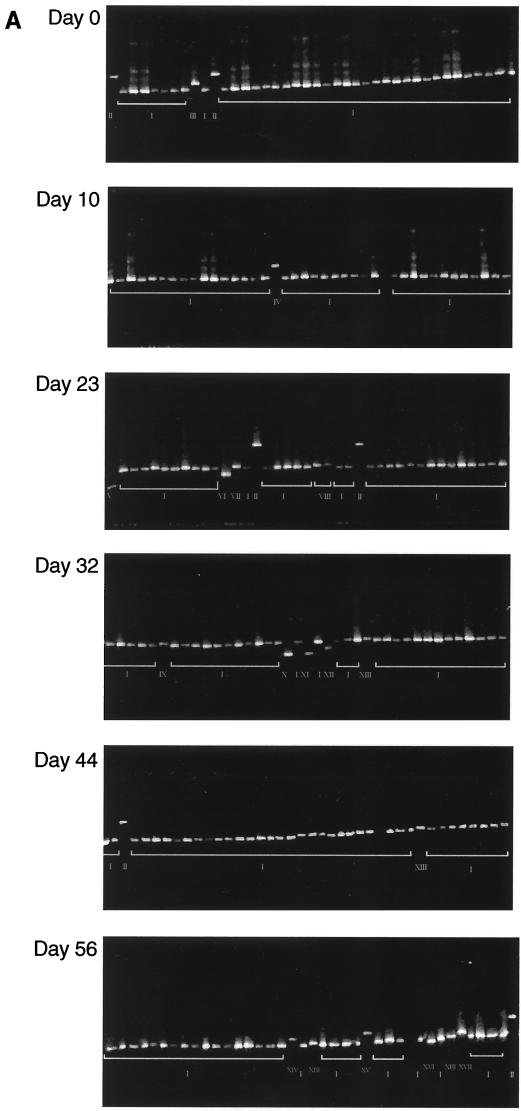
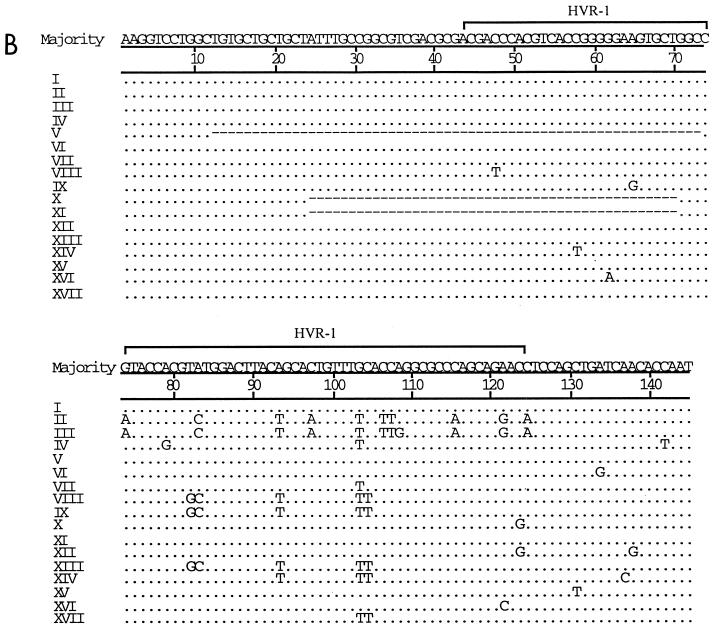
DGGE analysis allowed the changes in E2/HVR-1 sequences over a short period in two seroconverting individuals, SC1 and SC2, to be evaluated rapidly. Figure 4 shows the distribution of E2/HVR-1 sequences from each patient at six time points, and Fig. 5 documents the base changes that led to variation in DGGE banding positions.
FIG. 4.
(A) DGGE profiles of colony PCR products amplified from the HCV E2/HVR-1 subgenomic region obtained from serially collected sera from acutely infected patient SC1. (B) Comparison of E2/HVR-1 unique sequences from SC1. Unique sequences and their corresponding DGGE profiles are assigned different Roman numerals. Dots represent sequence identity, and dashes represent deletions.
FIG. 5.
(A) DGGE profiles of colony PCR products amplified from the HCV E2/HVR-1 subgenomic region obtained from serially collected sera from acutely infected patient SC2. (B) Comparison of E2/HVR-1 unique sequences from SC2. Dots represent sequence identity, and dashes represent deletions.
For SC1, DGGE showed that a single variant (I) was exclusively carried by the first sample (day 0) (Fig. 4A). Over the seroconversion period, variant I remained dominant, while most of the minority variants (II to X, XI, and XII) appeared only once and variant X appeared twice (both on day 43). Sequence analysis revealed point deletions in variants III and VII and longer deletions in variants V and XI (Fig. 4B). All these deletions predict the translation of truncated envelope protein products (data in GenBank). In addition, point substitutions were found in variants III and VII and in variants without any deletions (II, IV, VI, VIII, IX, and XII) (Fig. 4B). Substitutions in variants VIII, IX, and XII were synonymous, with the amino acid sequence specified being identical to that specified by variant I while substitutions in variants II, IV, and X were nonsynonymous (data in GenBank). The small number of nucleotide substitutions precluded analysis of variation in synonymous/nonsynonymous and transition/transversion ratios over time.
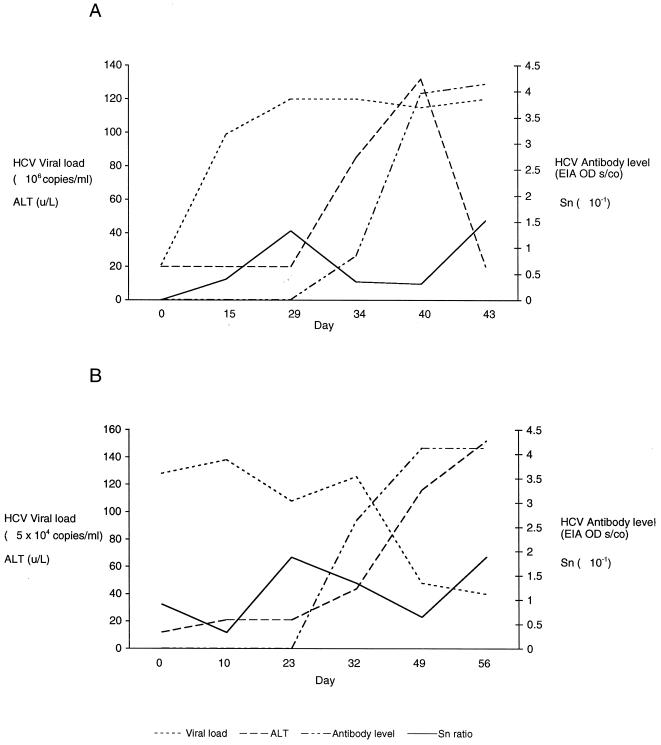
E2/HVR-1 entropy values obtained for the samples from SC1 at each time point were low, ranging from 0 (day 0) to 0.153 (day 43). No trends were observed as entropy values changed with the changes in circulating viral load, serum alanine aminotransferase (ALT) level, and anti-HCV level (Fig. 6A).
FIG. 6.
Changes in HCV viral load, ALT level, anti-HCV antibody level, and HCV E2/HVR-1 sequence entropy (Sn) in patients SC1 (A) and SC2 (B). Viral load and antibody level data were as provided by the distributor of the study samples. OD, optical density.
In contrast to SC1, DGGE showed the presence of three variants (I to III) in the first sample from SC2 (Fig. 5A). Sequence analysis of the clones showed that while the minority variants II and III differed by 1 nt, both these variants were substantially different from variant I (Fig. 5B). Over the seroconversion period, variant I remained dominant, and minority variants other than II and III appeared (Fig. 4B). Of the minority variants, only two (variants II and XIII) re-emerged: variant II on days 23, 49 and 56 and variant XIII on days 32, 49 and 56. The rest of the minority variants appeared only once. Figure 5B also shows that the various sequences may be segregated into three groups according to nucleotide motifs: variants II and III, those clustering with variant I (variants IV, V, VI, VII, X, XI, XII, XV, and XVI), and those clustering with variant XIII (variants VIII, IX, XIV, and XVII). Phylogenetic analysis confirmed the grouping of variant sequences to the three clusters (data not shown). The deletion variants (V, X, and XI), all mutants of variant I, also specify the translation of truncated products (data in GenBank).
Despite the presence of clusters, little variation in diversity was seen in SC2 over the seroconversion period, with the entropy values varying from 0.03 (day 10) to 0.188 (day 56). There was also no trend in the entropy changes as the viral load and ALT and anti-HCV levels changed (Fig. 6B).
DISCUSSION
This study, using PCR clones derived from three regions of the HCV genome 5′NCR, NS5b, and E2/HVR-1, which possessed different degrees of nucleotide sequence variability, shows that the DGGE approach is applicable to the investigation of HCV genetic diversity at the intrahost level. Sequence differences in a relatively large number of clones from a subgenomic fragment (up to 48 per gel, two gels per run) can be screened during a single procedure. No radioisotopes are needed. Clones yielding differing gel migratory positions are rapidly identified, to be processed further for nucleotide sequencing analyses if required. We regularly observed that single-nucleotide variations in the amplicons led to differences in the migratory positions reached. Convenient overnight runs were made possible by carrying out electrophoresis at reduced voltage. A long electrophoresis run can be tolerated because once GC-clamped DNA fragments travel to positions in the gel gradient where all but the clamp region has denatured, they do not migrate further through the gel matrix.
The assessment of quasispecies diversity, as opposed to complexity, requires sequencing procedures to be carried out. These are particularly necessary to define sequence changes in the minority variants. The diversity and complexity of the NS5b region characterized from blood samples from hemophiliacs, IDUs, and blood donors were evaluated using DGGE combined with sequencing of PCR clones derived from this region. Entropy (a measure of complexity) and mean genetic distance (a measure of diversity) are both indices of how rapidly HCV mutates and of the extent of multiple HCV carriage. We found that mean values of the two measures were not significantly different between groups. Assuming that the NS5b subgenomic region mutates at about the same rate among individuals in the three groups, the lack of significance in the mean entropy and genetic distance values suggests equal likelihood of carrying multiple HCV variants. That blood donors should have the same extent of sequence diversity as hemophiliacs and IDUs is surprising, considering that they are thought to be less exposed to multiple HCV transmission events. It may be that the multiple HCV transmission events hypothesized to occur in IDUs are, for various reasons, not associated with an increase in genetic complexity. In addition to this, the epidemiology of HCV in blood donors is poorly understood 5. Seropositive blood donors may thus be as susceptible to HCV multiple transmission as are IDUs through a variety of unknown routes. A recent study has identified intravenous drug use in a substantial proportion of British anti-HCV-positive blood donors 19.
That HCV genetic complexity and diversity in hemophiliacs do not differ significantly from those in the other two groups is also unexpected. HCV-infected hemophilia patients are exposed to HCV from having undergone therapy with clotting-factor concentrates prepared from blood donors who were not yet screened for anti-HCV. Before routine screening of blood donors for anti-HCV came into effect, hemophiliacs had been particularly prone to multiple HCV transmissions. This arose not only because of the frequency of clotting-factor infusions but also because each concentrate was derived from plasma fractions that originated from very large pools of blood donors 24. Despite the vulnerability of hemophiliacs to infection by multiple HCV variants, we found no evidence of mixed HCV genotype infection, neither did we find higher NS5b entropy or genetic distance values in this group compared to the IDU and blood donor groups. Moreover, sequencing of NS5b clones derived from the hemophilia patients shows that in all five patients, variation in sequences of the minority variants involved single-nucleotide substitutions from the majority variant, accounting for the tight clustering of sequences seen in Fig. 4C. These data are consistent with quasispecies evolution from a single HCV founder strain and again point to the rarity of multiple HCV carriage in hemophiliacs. Such an occurrence may be due to resistance of the already infected host to HCV reinfection, which may in turn be due to failure of the newly transmitted strains to supplant the strain that had persisted after having first established infection. However, it is possible that mixed infections are in fact common but that one subtype prevails and the other becomes undetectable. It would be feasible to apply the DGGE procedure to larger numbers of blood specimens to confirm the absence or paucity of multiple infection in hemophilia patients. This confirmation would imply that vaccination programs employing live, attenuated HCV vaccines might be more effective in preventing primary HCV infections than inactivated, subunit, or epitope vaccines would be.
HCV quasispecies evolution in the pre- and early seroconversion stage of HCV infection has been studied, and the role of immune selection is being clarified 8, 15. We note that in one of the study patients (SC1), HCV viremia had peaked prior to the rise in ALT and antiviral antibody levels, while in the other (SC2), viremia was already declining at the time of the rise in ALT and antibody levels (Fig. 6). Between our two study patients, there were also differences in HCV complexity and diversity in the circulation before and after the appearance of antibody. In SC1, there was no variation in the E2/HVR-1 region in the earliest samples, and the variants that subsequently emerged possessed changes (deletions and substitutions) suggesting that these and the dominant variant belong to one monophyletic group. By contrast, the HCV infecting SC2 belonged to at least three monophyletic groups. Such a disparity in the complexity of HCV in specimens at the acute stage of infection has been noted in a previous study of three patients with acute hepatitis C 15. Variation in HCV complexity and diversity in early specimens may be due to the absence (as exemplified in SC1) or presence (as exemplified in SC2) of multiple strains in the inoculum, to differences in the way hepatocytes permit the replication of particular strains 22, or to whether effective humoral or cellular responses have been triggered 8.
Investigation of the two seroconverting patients by the combined DGGE-sequencing protocol also revealed that despite the difference in the patients with regard to carriage of single or multiple strains, there was no substantial difference in their rates of diversification. The highest E2/HVR-1 entropy values reached in each patient did not even attain the highest values of the relatively conserved NS5b region of the 15 individuals studied earlier (Table 1). There was also no observable trend to the changes in entropy as antibody levels increased (Fig. 6). Furthermore, for SC1 and SC2, nucleotide substitutions within HVR-1 appeared as frequently as those outside it (Fig. 4B and 5B).
Overall, the E2/HVR-1 findings agree with observations on naive chimpanzees experimentally infected with HCV, in which a paucity of mutations in HVR-1 during the acute phase of infection has also been noted 28. They also agree with data from a recent study of human patients undergoing acute HCV infection, in whom the diversity of and number of sequence variants in HVR-1 between the first PCR-positive and the pre-seroconversion blood specimens were not substantially changed 8.
In SC1 and SC2, the low frequency of the E2/HVR-1 mutations and the poor correlation of these mutations with anti-HCV changes suggest that at the early stage of HCV infection, mutations arise stochastically and are not antibody mediated. It is noted that various reports of mutations in HVR-1 which ascribe them to neutralizing pressure from anti-HCV 29, 30 relate only to studies involving the use of antibody preparations from blood collected from patients with chronic, not acute, hepatitis C. However, a study of HVR variation in acutely infected patients showed that in some individuals E2/HVR-1 changes may be immune mediated 8. Such individuals tended to progress to chronic infection. The paucity of E2/HVR-1 changes in early infection tended to be associated with resolving infection; SC1 and SC2 may thus belong to the latter category.
In summary, DGGE facilitates rapid and reliable assessment of HCV quasispecies diversity. Combined with nucleotide-sequencing procedures, it provided evidence that HCV genetic complexity and diversity in blood donors and IDUs did not differ significantly from those in hemophilia patients. This observation led us to hypothesize that multiple HCV infection is uncommon because persistent infection by one HCV strain prevents the establishment of infection by subsequently introduced strains. We also found that few mutations emerged during the seroconversion period of HCV infection of the two patients studied, suggesting that genetic drifts occurring at this stage of infection are not immune-mediated.
REFERENCES
- 1.Behrens S E, Tomei L, De Francesco R. Identification and properties of the RNA-dependent RNA polymerase of hepatitis C virus. EMBO J. 1996;15:12–22. [PMC free article] [PubMed] [Google Scholar]
- 2.Bukh J, Miller R H, Purcell R H. Genetic heterogeneity of hepatitis C virus: quasispecies and genotypes. Semin Liver Dis. 1995;15:41–63. doi: 10.1055/s-2007-1007262. [DOI] [PubMed] [Google Scholar]
- 3.Bukh J, Purcell R H, Miller R H. Sequence analysis of the 5′ noncoding region of hepatitis C virus. Proc Natl Acad Sci USA. 1992;89:4942–4946. doi: 10.1073/pnas.89.11.4942. [DOI] [PMC free article] [PubMed] [Google Scholar]
- 4.Choo Q L, Richman K H, Han J H, Berger K, Lee C, Dong C, Gallegos C, Coit D, Medina-Selby R, Barr P J. Genetic organization and diversity of the hepatitis C virus. Proc Natl Acad Sci USA. 1991;88:2451–2455. doi: 10.1073/pnas.88.6.2451. [DOI] [PMC free article] [PubMed] [Google Scholar]
- 5.Dike A E, Christie J M, Kurtz J B, Teo C G. Hepatitis C in blood transfusion recipients identified at the Oxford Blood Centre in the national HCV look-back programme. Transfus Med. 1998;8:87–95. doi: 10.1046/j.1365-3148.1998.00132.x. [DOI] [PubMed] [Google Scholar]
- 6.Domingo E, Martinez-Salas E, Sobrino F, de la Torre J C, Portela A, Ortin J, Lopez-Galindez C, Perez-Brena P, Villanueva N, Najera R, et al. The quasispecies (extremely heterogeneous) nature of viral RNA genome populations: biological relevance—a review. Gene. 1985;40:1–8. doi: 10.1016/0378-1119(85)90017-4. [DOI] [PubMed] [Google Scholar]
- 7.Farci P, Bukh J, Purcell R H. The quasispecies of hepatitis C virus and the host immune response. Springer Semin Immunopathol. 1997;19:5–26. doi: 10.1007/BF00945022. [DOI] [PubMed] [Google Scholar]
- 8.Farci P, Shimoda A, Coiana A, Diaz G, Peddis G, Melpolder J C, Strazzera A, Chien D Y, Munoz S J, Balestrieri A, Purcell R H, Alter H J. The outcome of acute hepatitis C predicted by the evolution of the viral quasispecies. Science. 2000;288:339–344. doi: 10.1126/science.288.5464.339. [DOI] [PubMed] [Google Scholar]
- 9.Felsenstein J. PHYLIP (Phylogeny Inference Package 3.5c). Seattle: Department of Genetics, University of Washington; 1993. [Google Scholar]
- 10.Fodde R, Losekoot M. Mutation detection by denaturing gradient gel electrophoresis (DGGE) Hum Mutat. 1994;3:83–94. doi: 10.1002/humu.1380030202. [DOI] [PubMed] [Google Scholar]
- 11.Lee J H, Stripf T, Roth W K, Zeuzem S. Non-isotopic detection of hepatitis C virus quasispecies by single strand conformation polymorphism. J Med Virol. 1997;53:245–251. doi: 10.1002/(sici)1096-9071(199711)53:3<245::aid-jmv11>3.0.co;2-g. [DOI] [PubMed] [Google Scholar]
- 12.Lin H J, Shi N, Mizokami M, Hollinger F B. Polymerase chain reaction assay for hepatitis C virus RNA using a single tube for reverse transcription and serial rounds of amplification with nested primer pairs. J Med Virol. 1992;38:220–225. doi: 10.1002/jmv.1890380312. [DOI] [PubMed] [Google Scholar]
- 13.Lohmann V, Korner F, Herian U, Bartenschlager R. Biochemical properties of hepatitis C virus NS5B RNA-dependent RNA polymerase and identification of amino acid sequence motifs essential for enzymatic activity. J Virol. 1997;71:8416–8428. doi: 10.1128/jvi.71.11.8416-8428.1997. [DOI] [PMC free article] [PubMed] [Google Scholar]
- 14.Lohmann V, Roos A, Korner F, Koch J O, Bartenschlager R. Biochemical and kinetic analyses of NS5B RNA-dependent RNA polymerase of the hepatitis C virus. Virology. 1998;249:108–118. doi: 10.1006/viro.1998.9311. [DOI] [PubMed] [Google Scholar]
- 15.Manzin A, Solforosi L, Petrelli E, Macarri G, Tosone G, Piazza M, Clementi M. Evolution of hypervariable region 1 of hepatitis C virus in primary infection. J Virol. 1998;72:6271–6276. doi: 10.1128/jvi.72.7.6271-6276.1998. [DOI] [PMC free article] [PubMed] [Google Scholar]
- 16.Martell M, Esteban J I, Quer J, Genesca J, Weiner A, Esteban R, Guardia J, Gomez J. Hepatitis C virus (HCV) circulates as a population of different but closely related genomes: quasispecies nature of HCV genome distribution. J Virol. 1992;66:3225–3229. doi: 10.1128/jvi.66.5.3225-3229.1992. [DOI] [PMC free article] [PubMed] [Google Scholar]
- 17.McAllister J, Casino C, Davidson F, Power J, Lawlor E, Yap P L, Simmonds P, Smith D B. Long-term evolution of the hypervariable region of hepatitis C virus in a common-source-infected cohort. J Virol. 1998;72:4893–4905. doi: 10.1128/jvi.72.6.4893-4905.1998. [DOI] [PMC free article] [PubMed] [Google Scholar]
- 18.Moribe T, Hayashi N, Kanazawa Y, Mita E, Fusamoto H, Negi M, Kaneshige T, Igimi H, Kamada T, Uchida K. Hepatitis C viral complexity detected by single-strand conformation polymorphism and response to interferon therapy. Gastroenterology. 1995;108:789–795. doi: 10.1016/0016-5085(95)90452-2. [DOI] [PubMed] [Google Scholar]
- 19.Murphy E L, Bryzman S M, Glynn S A, Ameti D I, Thomson R A, Williams A E, Nass C C, Ownby H E, Schreiber G B, Kong F, Neal K R, Nemo G J. Risk factors for hepatitis C virus infection in United States blood donors. NHLBI Retrovirus Epidemiology Donor Study (REDS) Hepatology. 2000;31:756–762. doi: 10.1002/hep.510310329. [DOI] [PubMed] [Google Scholar]
- 20.Ni Y H, Chang M H, Chen P J, Lin H H, Hsu H Y. Evolution of hepatitis C virus quasispecies in mothers and infants infected through mother-to-infant transmission. J Hepatol. 1997;26:967–974. doi: 10.1016/s0168-8278(97)80104-3. [DOI] [PubMed] [Google Scholar]
- 21.Pawlotsky J M, Germanidis G, Neumann A U, Pellerin M, Frainais P O, Dhumeaux D. Interferon resistance of hepatitis C virus genotype 1b: relationship to nonstructural 5A gene quasispecies mutations. J Virol. 1998;72:2795–2805. doi: 10.1128/jvi.72.4.2795-2805.1998. [DOI] [PMC free article] [PubMed] [Google Scholar]
- 22.Rumin S, Berthillon P, Tanaka E, Kiyosawa K, Trabaud M A, Bizollon T, Gouillat C, Gripon P, Guguen-Guillouzo C, Inchauspe G, Trepo C. Dynamic analysis of hepatitis C virus replication and quasispecies selection in long-term cultures of adult human hepatocytes infected in vitro. J Gen Virol. 1999;80:3007–3018. doi: 10.1099/0022-1317-80-11-3007. [DOI] [PubMed] [Google Scholar]
- 23.Sheffield V C, Cox D R, Lerman L S, Myers R M. Attachment of a 40-base-pair G+C-rich sequence (GC-clamp) to genomic DNA fragments by the polymerase chain reaction results in improved detection of single-base changes. Proc Natl Acad Sci USA. 1989;86:232–236. doi: 10.1073/pnas.86.1.232. [DOI] [PMC free article] [PubMed] [Google Scholar]
- 24.Simmonds P, Zhang L Q, Watson H G, Rebus S, Ferguson E D, Balfe P, Leadbetter G H, Yap P L, Peutherer J F, Ludlam C A. Hepatitis C quantification and sequencing in blood products, haemophiliacs, and drug users. Lancet. 1990;336:1469–1472. doi: 10.1016/0140-6736(90)93179-s. [DOI] [PubMed] [Google Scholar]
- 25.Smith D B, Simmonds P. Review: molecular epidemiology of hepatitis C virus. J Gastroenterol Hepatol. 1997;12:522–527. doi: 10.1111/j.1440-1746.1997.tb00477.x. [DOI] [PubMed] [Google Scholar]
- 26.Sullivan D G, Wilson J J, Carithers R L J, Perkins J D, Gretch D R. Multigene tracking of hepatitis C virus quasispecies after liver transplantation: correlation of genetic diversification in the envelope region with asymptomatic or mild disease patterns. J Virol. 1998;72:10036–10043. doi: 10.1128/jvi.72.12.10036-10043.1998. [DOI] [PMC free article] [PubMed] [Google Scholar]
- 27.Toyoda H, Fukuda Y, Nakano I, Katano Y, Takayama T, Kumada T, Nakano, Takamatsu J, Saito H, Hayakawa T. Quasispecies nature of hepatitis C virus (HCV) in patients with chronic hepatitis C with mixed HCV subtypes. J Med Virol. 1998;54:80–85. [PubMed] [Google Scholar]
- 28.van Doorn L J, Capriles I, Maertens G, DeLeys R, Murray K, Kos T, Schellekens H, Quint W. Sequence evolution of the hypervariable region in the putative envelope region E2/NS1 of hepatitis C virus is correlated with specific humoral immune responses. J Virol. 1995;69:773–778. doi: 10.1128/jvi.69.2.773-778.1995. [DOI] [PMC free article] [PubMed] [Google Scholar]
- 29.Weiner A J, Geysen H M, Christopherson C, Hall J E, Mason T J, Saracco G, Bonino F, Crawford K, Marion C D, Crawford K A. Evidence for immune selection of hepatitis C virus (HCV) putative envelope glycoprotein variants: potential role in chronic HCV infections. Proc Natl Acad Sci USA. 1992;89:3468–3472. doi: 10.1073/pnas.89.8.3468. [DOI] [PMC free article] [PubMed] [Google Scholar]
- 30.Zibert A, Schreier E, Roggendorf M. Antibodies in human sera specific to hypervariable region 1 of hepatitis C virus can block viral attachment. Virology. 1995;208:653–661. doi: 10.1006/viro.1995.1196. [DOI] [PubMed] [Google Scholar]


