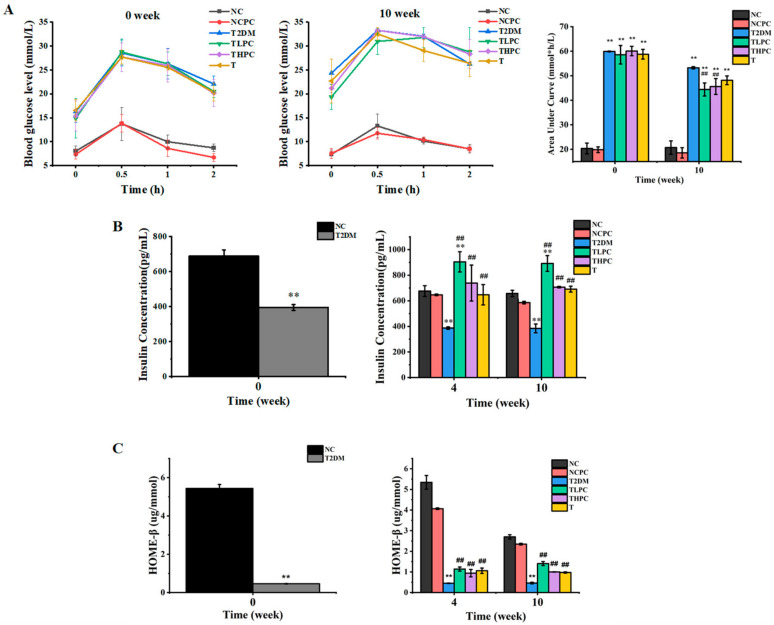
Figure 2.
Effects of phycocyanin on glucose tolerance, FIN, and HOME-β levels in diabetic mice. (A) The glucose tolerance levels of diabetic mice under different treatments at week 0 and week 10. (B) The FIN levels of diabetic mice under different treatments at weeks 0, 4, and 10. (C) The HOME-β levels of diabetic mice under different treatments at weeks 0, 4, and 10. Data are expressed as means ± SD for 12 mice. ** (p < 0.01) represent groups with significant differences compared with the NC group. ## (p < 0.01) represent groups with significant differences compared with the T2DM group.

