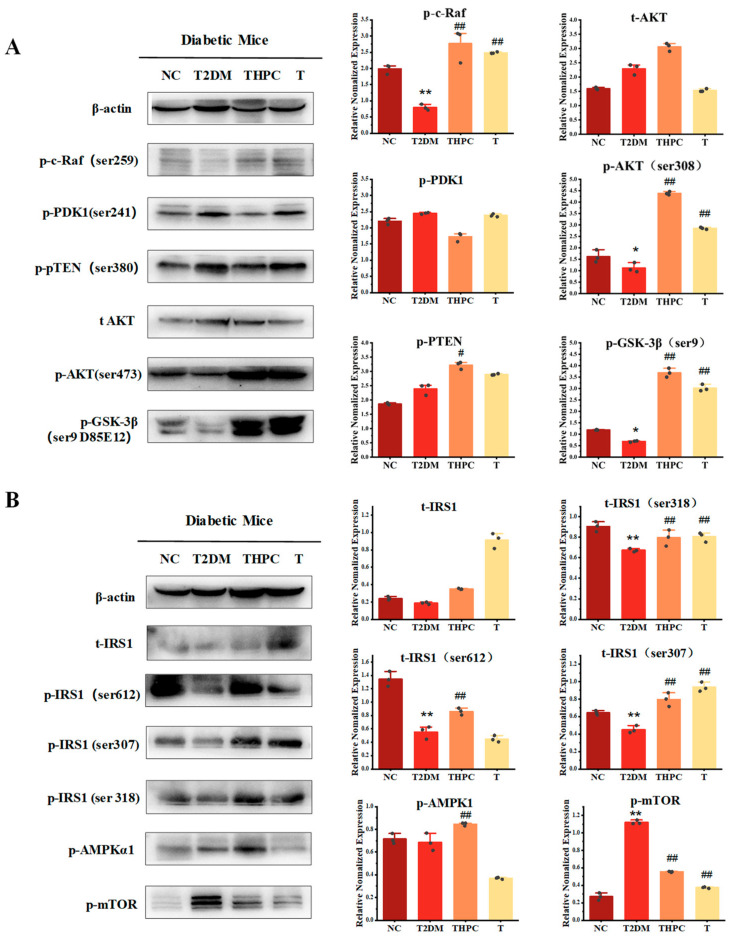
Figure 5.
Phycocyanin promotes the activity of the AKT and AMPK pathway in diabetic mice. (A) Western blot analysis of the AKT signaling pathway in the NC, T2DM, THPC, and T groups. (B) Western blot analysis of the expressions of the AMPKα and IRS proteins in the NC, T2DM, THPC, and T groups. Data are expressed as means ± SD for random three mice. * (p < 0.05) and ** (p < 0.01) represent groups with significant differences compared with the NC group. # (p < 0.05) and ## (p < 0.01) represent groups with significant differences compared with the T2DM group. The dots in the histogram represent the three different grey values of the Western blot samples.

