Abstract
Two functionally distinct antibodies, categorized as conventional serology antibodies (CSA) and lytic antibodies (LA) have been described in Chagas' disease, based on their ability to bind to fixed epimastigotes (EPI) or live trypomastigotes (TRYPO), respectively. In this study, the profile of immunoglobulin G (IgG) subclasses of CSA and LA were analyzed by flow cytometry using serum samples from chronic chagasic patients with the indeterminate (IND), cardiac (CARD), and digestive (DIG) clinical forms of the disease. The results were expressed as percentage of positive fluorescent parasites (PPFP) for each sample. CSA showed a higher PPFP than LA for all samples. At serum dilutions between 1:256 and 1:2,048, IgG1 anti-EPI was able to distinguish chagasic from nonchagasic individuals. Different profiles of IgG subclasses were observed for CSA and LA. IgG1 and IgG2 were the main subclasses in CSA, whereas IgG1 and IgG3 were the predominant ones in LA. The reactivity of IgG2 anti-EPI was greater in IND and CARD than in DIG patients. Furthermore, a low level of IgG1 and IgG3 LA was associated with most of the CARD patients. On the other hand, a high level of IgG1 LA was associated with most of the IND patients. In summary, our findings indicate the potential of IgG1 anti-EPI for serological diagnosis of Chagas' disease, providing further evidence for a protective role of LA, and show that IgG1 anti-live Trypanosoma cruzi TRYPO may be used to predict the risk of cardiac damage in Chagas' disease.
Human infection with Trypanosoma cruzi (Chagas' disease) is widespread in Latin America, where 16 to 18 million people are estimated to be infected 26. Acute Chagas' disease, which lasts for 1 or 2 months, is usually followed by a lifelong chronic phase. The chronic phase remains asymptomatic for many years in most infected individuals, referred to as indeterminate (IND) phase. Clinical alterations can occur in 28 to 40% of the chronically infected patients including cardiac (CARD) and/or digestive (DIG) manifestations. The pathological substract of the CARD form is a chronic progressive fibrotic myocarditis. The DIG form is characterized by pathological dilatation of the esophagus and/or colon (megaesophagus and megacolon) 3, 6, 22, 24.
Several studies have demonstrated that different clinical manifestations are associated with a distinct and complex host-parasite relationship with direct involvement of the immune system 23. The long-lasting nature of the asymptomatic chronic phase strongly suggests an effective participation of modulatory events that would allow the establishment and maintenance of the IND clinical form.
A large number of studies have demonstrated that both cellular and humoral-mediated antiparasite immune responses are correlated with resistance and susceptibility to infection in experimental models 12, 13. The relationship of these mechanisms with clinical manifestations of human Chagas' disease is still controversial. Concerning the humoral immune response, specific immunoglobulin G (IgG) antibody subclasses, mainly IgG1 and IgG3, have been associated with human Chagas' disease. However, no correlation with clinical forms of chronic infection has been observed. Still, it is important to emphasize that most of these studies of the IgG subclasses have been performed by immunoassays using soluble or fixed whole T. cruzi antigenic preparations 19, 20, 21.
It has been proposed by Krettli and Brener 14 that sera from patients with chronic Chagas' disease contain two types of antiparasite antibodies with different functional activities, lytic antibodies (LA) and conventional serology antibodies (CSA). LA are associated with resistance in active ongoing T. cruzi infection, bind to live trypomastigotes (TRYPO), and can be detected by complement-mediated lysis, indirect immunofluorescence assay (IFA), and flow cytometry. CSA are not associated with host resistance and can be mainly detected using soluble and/or fixed antigenic preparations 14, 18. Considering these findings, it is likely that the presence of protective and nonprotective antibodies in the chronic chagasic host might be assessed by analyzing the IgG subclasses within LA and CSA using both live and fixed parasites. In the present study, we have explored flow cytometry as a new method for the serological diagnosis and prognosis of Chagas' disease.
MATERIALS AND METHODS
Patient population.
The inclusion of all subjects in our investigation had the approval of the Ethics Committees of the FIOCRUZ and Faculdade de Medicina do Triângulo Mineiro (Brazilian Ministry of Health). The patients included in this study ranged from 24 to 77 years of age. All infected individuals were from Minas Gerais State, Brazil, and had received a positive diagnosis for Chagas' disease. The diagnosis was based on standard serological tests, including IFA, and hemagglutination 9, 10. In this study, we used 76 sera from chagasic patients with chronic disease. According to their clinical records, the chagasic patients were divided into three different categories, namely, IND, CARD, and DIG. Patients presenting asymptomatic T. cruzi infection, classified as IND (n = 20), had no clinical manifestations of the disease other than their positive serology. Patients with CARD dysfunction (n = 27) presented dilated cardiomyopathy and were identified by a detailed clinical examination, including electrocardiography, 24-h electrocardiography and thoracic X ray. Chagasic patients with gastrointestinal disease, DIG (n = 29), presented a clinical radiological status of megacolon and/or megaesophagus. Twenty nonchagasic individuals, with negative results on serological tests for Chagas' disease, were included in this study as negative controls (NC). All were living in an area of endemic Chagas' disease.
The serum samples were inactivated by heating for 30 min at 56°C and kept at −20°C until use. The inactivated sera were diluted in 0.15 M phosphate-buffered saline (PBS), pH 7.2, containing 10% heat-inactivated fetal bovine serum (FBS) (GIBCO, Grand Island, N.Y.) and used to evaluate the presence of anti-T. cruzi antibodies by flow cytometry.
Parasite preparations.
NTCT clone 929 cells (L929) (ATCC CCL 1) from mouse connective tissue were maintained in our laboratory by serial passages and kept frozen in liquid nitrogen. For the assays, 5 × 10⁵ L929 cells were seeded in tissue culture flasks (Falcon 25 or 75 cm2) with 10 ml of RPMI medium (GIBCO) containing 10% FBS, and incubated at 37°C in a humidified air containing 5% CO2. After 2 or 3 days, the monolayer was infected with 3 × 10⁶ to 7 × 10⁶ trypomastigotes of T. cruzi-CL strain 7. The cultures were maintained in RPMI–10% FBS at 33°C in 5% CO2 at 95% humidity 4. After 5 to 6 days the TRYPO were harvested from the supernatant. Cell debris and amastigotes were removed by differential centrifugation at a low speed (100 × g for 10 min at room temperature). The supernatant containing most of the parasites was centrifuged at 1,000 × g for 15 min at 4°C. The pellet was washed three times in PBS supplemented with 10% FBS. For the investigation with fixed trypomastigotes, the parasites were immediately resuspended in an equal volume of PBS and FACS fix solution (per liter, 10 g of paraformaldehyde, 10.2 g of sodium cacodylate, and 6.65 g of sodium chloride, pH 7.2; Sigma Chemical Corp., St. Louis, Mo.).
Epimastigotes (EPI) from the CL strain were obtained by inoculation of 1.0 × 10⁷ bloodstream TRYPO from experimentally infected mice, in liver infusion tryptose medium (LIT) 8 with 10% FBS at 28°C. After serial passages in vitro, the parasites were harvested during the log phase of growth. The organisms were washed three times with PBS supplemented with 3% FBS (1,000 × g for 15 min at 4°C), resuspended immediately in equal volumes of PBS and FACS fix solution, and stored at 4°C until use. The suspension of parasites was adjusted to 5 × 10⁶/ml and pure TRYPO (live), TRYPO (fixed), or EPI preparations were used separately in parallel immunofluorescence assays.
Immunofluorescence by flow cytometry.
The parasite immunofluorescence staining was carried out as described by Martins-Filho et al. 18, modified for U-bottom 96-well plate (LINBRO; ICN Biomedicals, Inc. Aurora, Ohio). Briefly, 500,000 parasites/well were incubated at 37°C for 30 min in the presence of different dilutions (1:16 to 1:32,768) of pooled or individual serum from all patients and controls selected for this study. After incubation with sera, the parasites were washed twice with 150 μl of PBS–10% FBS (1,000 × g for 10 min at 4°C) and reincubated at 37°C for 30 min in the dark, in the presence of fluorescein isothiocyanate (FITC)-conjugated anti-human IgG antibody or with biotin-conjugated anti-human IgG subclass antibody (Sigma Chemical Corp.) (Table 1). After a second wash procedure the FITC-labeled parasites were fixed for 30 min with a FACS fix solution before analysis in the cytometer. The biotin-labeled parasites were incubated with 10 μl of streptavidin-phycoerythrin (PE) (GIBCO) at 37°C for 30 min in the dark. After being stained, the PE-labeled parasites were washed twice with PBS–10% FBS and fixed on ice for 30 min with FACS fix solution. Stained parasites were stored at 4°C up to 24 h before cytofluorometric analysis.
TABLE 1.
Antibodies used for flow cytometry
| Antibody | Clone | Dilution |
|---|---|---|
| Anti-human IgG (FC specific) FITC conjugate | 1:400 | |
| MAba anti-human IgG1 biotin conjugate | 8c/6-39 | 1:6,400 |
| MAb anti-human IgG2 biotin conjugate | HP-6014 | 1:800 |
| MAb anti-human IgG3 biotin conjugate | HP-6050 | 1:400 |
| MAb anti-human IgG4 biotin conjugate | HP-6025 | 1:1,600 |
MAb, monoclonal antibody.
FACScan data storage and analysis.
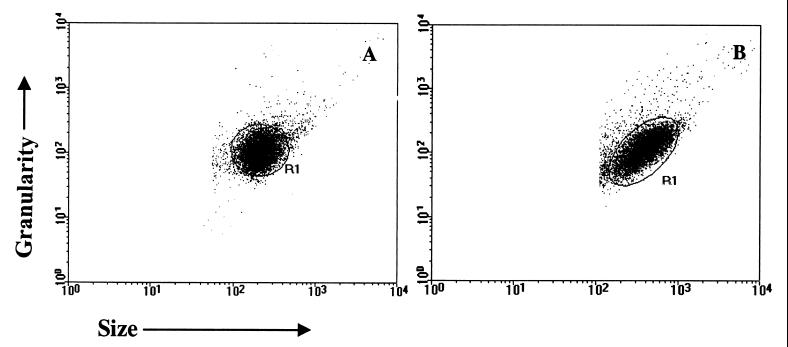
Flow-cytometric measurements were performed on a Becton Dickinson FACScan interfaced to an Apple Quadra FACStation. The Cell-Quest software package was used in both data storage and analysis. Stained parasites were run in the cytometer, and 10,000 events per sample were acquired. TRYPO (Fig. 1A) and EPI (Fig. 1B) were identified on the basis of their specific forward (FCS) and side (SSC) light-scattering properties. Parasites were selected by gating on the FCS-versus-SSC dot plot distribution. As shown in Fig. 1, parasites have a characteristic homogeneous distribution (R1) that allows selective analysis by creating a specific window over the parasite region. This profile was obtained by adjusting size and granularity gains, on a log scale, with values of 10 and 300, respectively. The relative FITC or PE fluorescence intensity for each parasite preparation was analyzed using a single histogram representation. A marker was set on the internal control for unspecific binding of FITC- or PE-conjugated antibody and used to determine for each serum sample the percentage of positive fluorescent parasites (PPFP). Data analysis was performed by establishing 20% as the cutoff between positive and negative results as described by Martins-Filho et al. 18 and 50% as an edge between high and low values of PPFP.
FIG. 1.
Dot plot analysis of a representative TRYPO (A) and EPI (B) distribution in FSC (size) versus SSC (granularity).
Statistical analysis.
Statistical analysis was performed using the Minitab 9.2 software package. One-way analysis of variance was used for the comparative study between groups. Student's t test was used to determine the differences between the groups averages. Comparison of anti-TRYPO IgG1 reactivity between chagasic groups was done by using the chi-square test. The differences were considered significant when the probabilities of equality, P values, were ≤0.05.
RESULTS
Comparative analysis of PPFP for IgG using different parasite preparations.
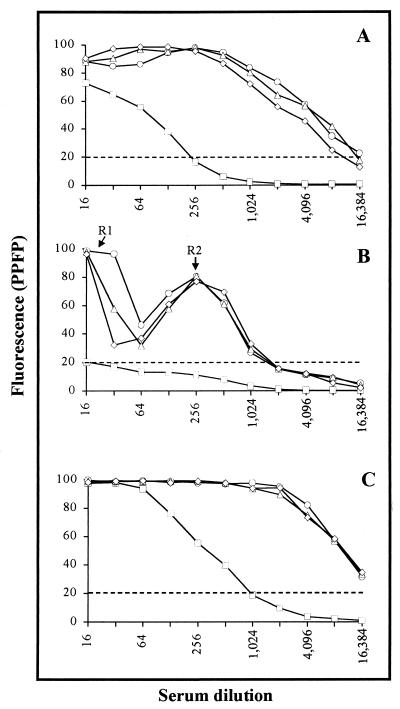
The PPFP for different dilutions of pooled sera from chagasic patients, previously classified by clinical forms, and pooled sera from noninfected individuals was determined using three different T. cruzi preparations (Fig. 2). The data show that anti-T. cruzi IgG titration curves have distinct patterns, with profiles dependent on the parasite preparation used. It was interesting that, when fixed parasites were used as targets (Fig. 2A and C), a higher PPFP was observed for all pooled serum samples analyzed, including NC. The most remarkable feature was observed in IgG binding to live TRYPO (Fig. 2B), which showed a bimodal curve for chagasic samples, with two regions of higher reactivity at 1:16 (R1) and 1:256 (R2) dilutions. Using a PPFP of 20% as a cutoff between negative and positive results, we observed that pooled sera from all chagasic patients showed positive results up to 1:8,192 for EPI (Fig. 2A), 1:1,024 for live TRYPO (Fig. 2B), and 1:16,384 for fixed TRYPO (Fig. 2C). Statistical analysis demonstrated that, irrespective of the parasite preparation used, the mean values of PPFP for the IgG titration curve was higher for chagasic pooled sera in comparison to NC (P ≤ 0.05). A similar mean value of PPFP was observed for IND, CARD, and DIG, making chagasic samples clustered in most tests with all parasite preparations tested. Sera from NC individuals showed negative results when incubated with live TRYPO in any dilution. On the other hand, a broad range of positive results was observed for NC when incubated with fixed parasites (up to 1:128 for EPI and 1:512 for TRYPO). Since live TRYPO and fixed EPI are the choice to search for LA and CSA, respectively, they were used in this study for further investigation.
FIG. 2.
Titration curve of total IgG anti-fixed EPI (A), -live TRYPO (B), and -fixed TRYPO (C) for pooled sera from chagasic patients (○, IND; ▵, CARD; ◊, DIG) and nonchagasic individuals (□, NC). The fluorescence is expressed as PPFP. The dotted line represents the cutoff between negative and positive PPFPs.
Profile of IgG subclasses anti-fixed EPI.
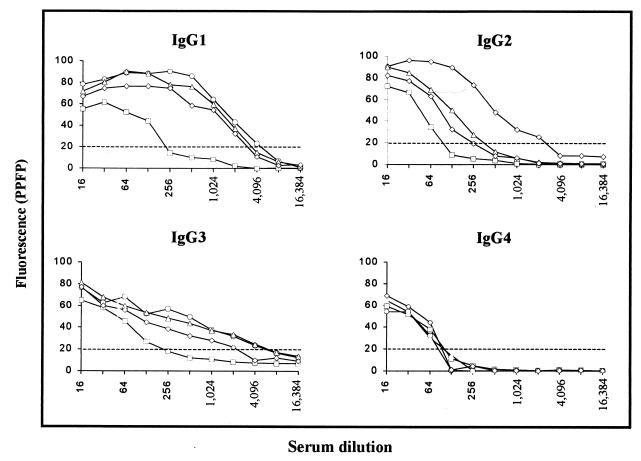
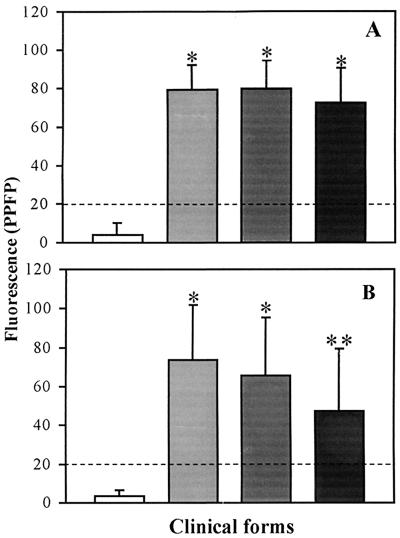
To determine whether the antibody binding to EPI was restricted to any of the four IgG subclasses, pooled sera from chagasic and nonchagasic individuals were subjected to analysis of anti-EPI IgG subclasses by flow cytometry. As shown in Fig. 3, IgGs from NC strongly bind to fixed EPI independent of the IgG subclass. When pooled sera were titrated for IgG1 anti-EPI, we observed an interval ranging from 1:256 to 1:2,048, which was able to distinguish chagasic patients from nonchagasic individuals. Analysis of PPFP for IgG1 anti-EPI, on individual samples at a dilution of 1:256 (Fig. 4A), demonstrated that chagasic but not NC serum strongly binds to fixed EPI (P ≤ 0.05). However, no significant differences were observed between the clinical forms. Although at dilutions of 1:128 for IgG2 and 1:256 for IgG3 we observed positive PPFP for chagasic patients and negative PPFP for NC, statistical analysis of the mean PPFP for the titration curve did not show any significant difference between the groups analyzed (Fig. 3). However, analysis of IgG2 anti-EPI, using individual samples at a dilution of 1:128 (Fig. 4B), demonstrated that chagasic but not NC serum can bind to fixed EPI, with lower PPFPs observed for patients with gastrointestinal disease in comparison to IND and CARD (P ≤ 0.05). The mean values of PPFP for IgG3 anti-EPI tested on individual samples showed negative results for all groups evaluated (data not shown). The titration curve for IgG4 binding to fixed EPI did not demonstrate differences of PPFP between chagasic and nonchagasic individuals (Fig. 3).
FIG. 3.
Titration curve of IgG subclasses anti-fixed T. cruzi EPI in pooled sera of chagasic patients (○, IND; ▵, CARD; ◊, DIG) and nonchagasic individuals (□, NC). The fluorescence is expressed as PPFP. The dotted line represents the cutoff between negative and positive PPFPs.
FIG. 4.
IgG1 (A) and IgG2 (B) reactivity anti-fixed T. cruzi EPI in individual serum samples from chagasic patients (IND, n = 20 [light shaded bars]; CARD, n = 27 [dark shaded bars]; DIG, n = 29 [black bars]) and nonchagasic individuals (NC, n = 20 [white bars]). The individual serum was used at a dilution of 1:256 for IgG1 and 1:128 for IgG2. The fluorescence is expressed as PPFP. The dotted line represents the cutoff between negative and positive PPFPs. ∗, P ≤ 0.05 in comparison to NC; ∗∗, P ≤ 0.05 in comparison to NC, IND, and CARD.
Determination of anti-live TRYPO specific IgG subclasses.
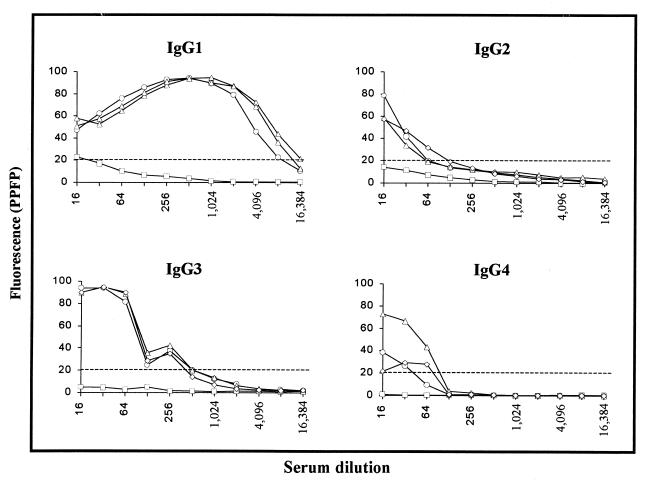
A two-step IFA assay based on the streptavidin-PE-biotin system was applied to live TRYPO to determine the reactivity of IgG subclasses from pooled sera from chagasic and nonchagasic individuals. Figure 5 shows that based on PPFP values, almost no binding of IgG subclasses to live TRYPO was observed for pooled sera from NC. On the other hand, all four IgG subclasses from chagasic patients can recognize live TRYPO with different profiles for each IgG subclass (Fig. 5). Positive PPFP for IgG2 and IgG4 were clustered around dilutions 1:16 and 1:64, whereas for IgG1 PPFP values were widely spread, from dilutions 1:16 to 1:8,192. Interestingly, the titration curve for IgG3, likely that observed for total IgG, showed a bimodal pattern with higher PPFP values around dilution 1:16 to 1:64 and increased PPFPs around dilution 1:256. Statistical analysis was performed using one-way analysis of variance, where all PPFPs along the titration curve were used to compare the profile of different groups included in the study. Our data demonstrated that only IgG1 and IgG3 titration curves presented mean PPFPs that allowed us to differentiate between chagasic and nonchagasic individuals (Fig. 5). The mean values of PPFP for IgG2 and IgG4 anti-live TRYPO did not differentiate chagasic from nonchagasic patients, even when individual samples were tested (data not shown).
FIG. 5.
Titration curve of IgG subclasses anti-live T. cruzi TRYPO in pooled sera from chagasic patients (○, IND; ▵, CARD; ◊, DIG) and nonchagasic individuals (□, NC). The results are expressed as PPFP. The dotted line represents the cutoff between negative and positive PPFPs.
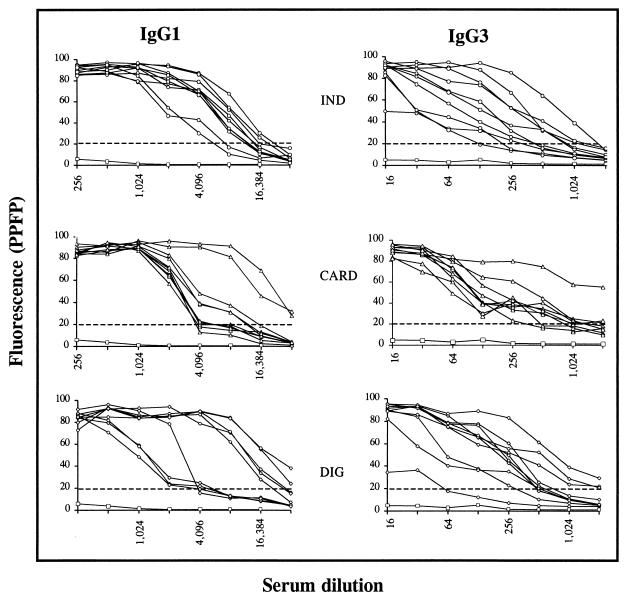
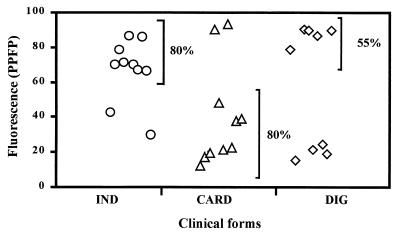
Analysis of the PPFP titration curve for IgG1 and IgG3 anti-live TRYPO, using individual samples is shown in Fig. 6. It was confirmed that serum from chagasic patients binds strongly to live TRYPO in a broad range of dilutions. Positive PPFP for IgG1 could be detected up to the dilution 1:2,048 for all chagasic patients. The shift of the titration point for IND patients to higher dilutions suggested that higher levels of IgG1 are observed for this group of patients. Analysis of IgG3 demonstrated that at dilutions lower than 1:32, IgG3 from chagasic serum binds strongly to live TRYPO (PPFP > 50%). A broad range of PPFP was observed for chagasic samples from dilutions of 1:64 to 1:2,048. At dilution 1:256 the majority of the CARD patients were concentrated at PPFPs of <50% (Fig. 6). By establishing a cutoff line of 50% for PPFPs for the IgG1 analysis, we observed important differences between CARD and IND patients. Using the chi-square statistical analysis we demonstrated, at a 1:4,096 dilution, significant differences (P ≤ 0.05) between CARD and IND clinical forms, where 80% of IND and only 20% of CARD patients presented PPFPs of >50% (Fig. 7).
FIG. 6.
IgG1 and IgG3 titration curves anti-live T. cruzi TRYPO in individual serum samples from chagasic patients (○, IND, n = 10; ▵, CARD, n = 10; ◊, DIG, n = 9) and pooled sera from nonchagasic individuals (□, NC, n = 20). The results are expressed as PPFP for each tested dilution. The dotted line represents the cutoff between negative and positive PPFPs.
FIG. 7.
IgG1 reactivity anti-live T. cruzi TRYPO in individual serum samples from chagasic patients at a 1:4,096 serum dilution (○, IND, n = 10; ▵, CARD, n = 10; ◊, DIG, n = 9). The results are expressed as PPFP. Comparisons of anti-TRYPO IgG1 reactivities between chagasic groups were done by using the chi-square test.
DISCUSSION
A well-known feature of the immune response to parasitic infections, including T. cruzi, is the production of specific antibodies involved in the resistance to infection and the morbidity associated with the chronic phase of the disease 5. We have previously demonstrated the applicability of flow cytometry in the investigation of anti-live TRYPO antibody and its use for assessing the efficacy of specific therapy in human T. cruzi infection 18. In this work we examined the applicability of flow cytometry to further characterize both LA and CSA anti-T. cruzi antibodies in patients in the chronic phase of Chagas' disease. Besides its sensitivity, the capacity of flow cytometry to detect 10,000 fluorescent parasites per assay and the possibility of using whole parasites as a source of antigen and not only soluble antigens improved the importance of this methodology over other techniques. For this purpose, we analyzed 76 samples from T. cruzi chronically infected patients and 20 samples from nonchagasic individuals.
Our results demonstrated that the titration curves for IgG have different profiles, depending on the parasite preparation used. The fixation process leads to a shift on the titration points to higher dilutions, with similar results for fixed TRYPO and EPI. Moreover, pooled sera from uninfected individuals bound strongly to fixed parasites but not to live parasites. It is interesting to observe that fixed TRYPO did not show the same bimodal profile observed for live TRYPO. It is possible that the fixation induced conformational changes on the parasite membrane antigens that led to its recognition by other immunoglobulins. It has been demonstrated that several membrane molecules present on live TRYPO are lost or denatured by fixation, as observed for the members of the 160-kDa protein family, the main target of lytic antibodies 17, 25. These findings confirm previous reports that live TRYPO or their in nature membrane-derived antigens should be the choice for further investigation in the field of serology for Chagas' disease 1, 14, 17. The observation that, after fixation, the parasites become more reactive with IgG from nonchagasic individuals suggests that epitopes responsible for cross-reactivity are also exposed after fixation.
Analyses of the reactivity of IgG subclasses in human T. cruzi infections remain scarce. As Chagas' disease manifests itself in a wide diversity of clinical forms, there is even less information evaluating the possibility that differences in antibody subclasses secreted during the infection may influence the pathologic manifestation. In this study, fixed and live parasites were used to detect IgG subclasses in sera from chagasic patients as well as from uninfected individuals.
In spite of the fact that IFA remains the most-used serological method for Chagas' disease diagnosis 15, our study has demonstrated the possible use of flow cytometry in future serological diagnosis of Chagas' disease. Although total IgG or IgG1 anti-EPI showed a better discrimination between chagasic and nonchagasic individuals, we suggest the use of IgG1 for diagnostic purposes. Since IgG2 antibodies bind preferentially to carbohydrate epitopes, widely expressed by other microorganisms, this subclass could account for unspecific binding when using total IgG. The validating of the use of IgG1 for diagnostic purposes requires further investigation focusing on the cross-reactivity of IgG subclasses anti-T. cruzi in other infections.
Despite the risk of infection during manipulation of live TRYPO, the striking advantage of using this preparation as the antigenic source for serological tests is that only epitopes on the outside membrane are available for IgG binding. This property of live parasite avoids the binding of IgG to intracellular components widely distributed on other trypanosomatids that accounts for cross-reactivity when using fixed parasites 2, 11, 16. Unspecific binding of IgG subclasses to live TRYPO was not observed for pooled sera from nonchagasic individuals. However, based on the mean PPFP for the titration curve, only IgG1 and IgG3 reactivity showed significant differences between chagasic and nonchagasic individuals. It was interesting to observe that, as in total IgG, IgG3 was the only subclass with a bimodal titration curve. Our data suggest that the bimodal pattern of the IgG titration curve could be a consequence of the differential profiles obtained for each subclass of IgG anti-live TRYPO. We speculated that IgG3, followed by IgG1, IgG2, and IgG4, contributed to the reactivity in R1. On the other hand, IgG1, followed by IgG3, was more relevant for the reactivity in R2. Studies focusing on the observed phenomena of bimodal profile for IgG and IgG3 titration curve anti-live TRYPO are under evaluation in our laboratory.
It is important to report that membrane antigens in their native conformation were more reliable to detect differences between clinical forms. Using live parasites, lower levels of IgG1 and IgG3 antibodies were found in chagasic patients with the CARD form of the disease. These findings emphasize the protective role of anti-live TRYPO immunoglobulins 14 and suggest the potential use of these subclasses for prognostic purposes, for monitoring the progression of chronic Chagas' disease, and for predicting the risk of CARD damage.
Taken together, these results open two important fields of investigation, including the use of anti-EPI IgG subclasses in screening diagnostic tests for epidemiological studies of chronic T. cruzi infection, as well as the use of anti-live TRYPO antibodies to monitor the progression of chronic Chagas' disease.
ACKNOWLEDGMENTS
We acknowledge Elenice Moreira Lemos, Juliana de Assis Silva Gomes Estaneslau, and Andréa Teixeira Carvalho for their assistance during the development of this study and Larisa Alonso for critical review of the manuscript.
This work was supported by the Conselho Nacional de Desenvolvimento Científico e Tecnológico and Fundação Oswaldo Cruz, (Brazil); and NIH grant AI 26505.
REFERENCES
- 1.Almeida I C, Krautz G M, Krettli A U, Travassos L R. Glycoconjugates of Trypanosoma cruzi: a 74 kD antigen of trypomastigotes specifically reacts with lytic anti-alpha-galactosyl antibodies from patients with chronic Chagas disease. J Clin Lab Anal. 1993;7:307–316. doi: 10.1002/jcla.1860070603. [DOI] [PubMed] [Google Scholar]
- 2.Andrade C R, Andrade P P, Wright E P. Leishmania donovani donovani antigens recognized by Kala-azar patient sera and identification of cross-reacting antigens to Chagas' disease. Braz J Med Biol Res. 1988;21:511–515. [PubMed] [Google Scholar]
- 3.Andrade Z A. Pathogenesis of Chagas' disease. Res Immunol. 1991;142:126–129. doi: 10.1016/0923-2494(91)90021-a. [DOI] [PubMed] [Google Scholar]
- 4.Bertelli M S, Golgher R R, Brener Z. Intraspecific variation in Trypanosoma cruzi: effect of temperature on the intracellular differentiation in tissue culture. J Parasitol. 1977;63:434–437. [PubMed] [Google Scholar]
- 5.Brener Z, Gazzinelli R T. Immunological control of Trypanosoma cruzi infection and pathogenesis of Chagas' disease. Int Arch Allergy Immunol. 1997;114:103–110. doi: 10.1159/000237653. [DOI] [PubMed] [Google Scholar]
- 6.Brener Z. Pathogenesis and immunopathology of chronic Chagas disease. Mem Inst Oswaldo Cruz. 1987;82:205–213. doi: 10.1590/s0074-02761987000400010. [DOI] [PubMed] [Google Scholar]
- 7.Brener Z, Chiari E. Variações morfológicas observadas em diferentes amostras de Trypanosoma cruzi. Rev Inst Med Trop São Paulo. 1963;5:220–224. [PubMed] [Google Scholar]
- 8.Camargo E P. Growth and differentiation in Trypanosoma cruzi. I. Origin of metacyclic trypanosomes in liquid media. Rev Inst Med Trop São Paulo. 1964;6:93–100. [PubMed] [Google Scholar]
- 9.Camargo M E. Fluorescent antibody test for the serodiagnosis of American trypanosomiasis. Technical modification employing preserved culture forms of Trypanosoma cruzi in a slide test. Rev Inst Med Trop São Paulo. 1966;8:227–235. [PubMed] [Google Scholar]
- 10.Camargo M E, Hoshino S, Correa N S, Peres B A. Hemagglutination test for Chagas' disease with chromium chloride, formalin-treated erythrocytes, sensitized with Trypanosoma cruzi extracts. Rev Inst Med Trop São Paulo. 1971;13:45–50. [PubMed] [Google Scholar]
- 11.Chiaramonte M G, Zwirner N W, Caropresi S L, Heredia V, Taranto N J, Malchiodi E L. Study of cases of leishmaniasis in the Province of Salta: evidences of mixed infection with Trypanosoma cruzi and Leishmania spp. Medicina. 1996;56:259–268. [PubMed] [Google Scholar]
- 12.Kierszenbaum F, Howard J G. Mechanisms of resistance against experimental Trypanosoma cruzi infection: the importance of antibodies and antibody-forming capacity in the Biozzi high and low responder mice. J Immunol. 1976;116:1208–1211. [PubMed] [Google Scholar]
- 13.Krettli A U, Brener Z. Protective effects of specific antibodies in Trypanosoma cruzi infections. J Immunol. 1976;116:755–760. [PubMed] [Google Scholar]
- 14.Krettli A U, Brener Z. Resistance against Trypanosoma cruzi associated to anti-living trypomastigote antibodies. J Immunol. 1982;128:2009–2012. [PubMed] [Google Scholar]
- 15.Luquetti A O, Rassi A. Diagnóstico laboratorial da infecção pelo Trypanosoma cruzi. In: Brener Z, Andrade Z, Barral-Neto M, editors. Trypanosoma cruzi e doença de Chagas. 2nd ed. Rio de Janeiro, Brazil: Guanabara Koogan; 2000. pp. 344–378. [Google Scholar]
- 16.Malchiodi E L, Chiaramonte M G, Taranto N J, Zwirner N W, Margni R A. Cross-reactivity studies and differential serodiagnosis of human infections caused by Trypanosoma cruzi and Leishmania spp; use of immunoblotting and ELISA with a purified antigen (Ag163B6) Clin Exp Immunol. 1994;97:417–423. doi: 10.1111/j.1365-2249.1994.tb06104.x. [DOI] [PMC free article] [PubMed] [Google Scholar]
- 17.Martins M S, Hudson L, Krettli A U, Cançado J R, Brener Z. Human and mouse sera recognize the same polypeptide associated with immunological resistance to Trypanosoma cruzi infection. Clin Exp Immunol. 1985;61:343–350. [PMC free article] [PubMed] [Google Scholar]
- 18.Martins-Filho O A, Pereira M E S, Carvalho J F, Cançado J R, Brener Z. Flow cytometry, a new approach to detect anti-live trypomastigote antibodies and monitor the efficacy of specific treatment in human Chagas' disease. Clin Diagn Lab Immunol. 1995;2:569–573. doi: 10.1128/cdli.2.5.569-573.1995. [DOI] [PMC free article] [PubMed] [Google Scholar]
- 19.Morgan J, Dias J C P, Gontijo E D, Bahia-Oliveira L, Correa-Oliveira R, Colley D G, Powell M R. Anti-Trypanosoma cruzi antibody isotype profiles in patients with different clinical manifestations of Chagas' disease. Am J Trop Med Hyg. 1996;55:355–359. doi: 10.4269/ajtmh.1996.55.355. [DOI] [PubMed] [Google Scholar]
- 20.Morgan J, Colley D G, Pinto Dias J C, Gontijo E D, Bahia-Oliveira L, Correa-Oliveira R, Powell M R. Analysis of anti-Trypanosoma cruzi antibody isotype specificities by Western blot in sera from patients with different forms of Chagas' disease. J Parasitol. 1998;84:641–643. [PubMed] [Google Scholar]
- 21.Motran C C, Serra H M, Gea S E, Vullo C M, Vottero-Cima E. Antibody isotype profiles against Trypanosoma cruzi acidic antigens in two Amerindian populations from a Chagas' disease endemic area. Acta Trop. 1994;58:105–114. doi: 10.1016/0001-706x(94)90050-7. [DOI] [PubMed] [Google Scholar]
- 22.Pinto Dias J C. História natural. In: Cançado J R, Chuster M, editors. Cardiopatia chagásica. Belo Horizonte, Brazil: Fundação Carlos Chagas; 1985. pp. 99–113. [Google Scholar]
- 23.Powell M R, Wasson D L. Host genetics and resistance to acute Trypanosoma cruzi infection in mice. I. Antibody isotype profiles. Parasite Immunol. 1993;15:215–221. doi: 10.1111/j.1365-3024.1993.tb00603.x. [DOI] [PubMed] [Google Scholar]
- 24.Tanowitz H B, Kirchhoff L V, Simon D, Morris S A, Weiss L M, Wittner M. Chagas' disease. Clin Microbiol Rev. 1992;5:400–419. doi: 10.1128/cmr.5.4.400. [DOI] [PMC free article] [PubMed] [Google Scholar]
- 25.Umekita L F, Barbaro K C, Mota I. Specificity and role of anti-Trypanosoma cruzi clearance antibodies. Braz J Med Biol Res. 1996;29:25–31. [PubMed] [Google Scholar]
- 26.World Health Organization. Control of Chagas' disease. WHO Tech Rep Ser. 1991;811:1–91. [PubMed] [Google Scholar]


