

Abstract
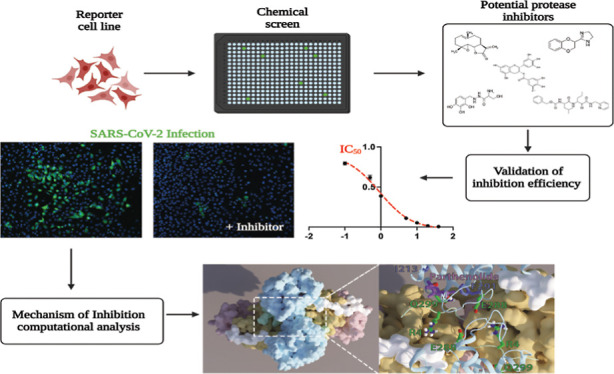
The SARS-CoV-2 pandemic is an ongoing threat to global health, and the continuing emergence of contagious variants highlights the urgent need for additional antiviral therapy to attenuate COVID-19 disease. The SARS-CoV-2 main protease (3CLpro) presents an attractive target for such therapy due to its high sequence conservation and key role in the viral life cycle. In this study, we designed a fluorescent–luminescent cell-based reporter for the detection and quantification of 3CLpro intracellular activity. Employing this platform, we examined the efficiency of known protease inhibitors against 3CLpro and further identified potent inhibitors through high-throughput chemical screening. Computational analysis confirmed a direct interaction of the lead compounds with the protease catalytic site and identified a prototype for efficient allosteric inhibition. These developments address a pressing need for a convenient sensor and specific targets for both virus detection and rapid discovery of potential inhibitors.
Keywords: SARS-CoV-2, main protease, antiviral, genetic reporter, chemical screen, computational modeling, allosteric inhibition
Coronaviruses (CoVs) are single-stranded positive-sense RNA viruses with a genome size ranging between 27 and 32 kb.1 The viral replication and maturation processes are highly dependent on a complex cascade of proteolytic cleavages of precursor polypeptides (pp1a and pp1ab) by the viral-encoded papain-like protease (PLpro) and the 3-chymotrypsin-like protease (3CLpro, main protease, Mpro, NSP5), which result in the release of 16 non-structural proteins (1–16 NSPs)2 and the formation of a functional viral RNA replication complex. PLpro is responsible for the proteolytic cleavage and the release of NSP1-3. The 3CLpro processes at least 11 sites, including its own N- and C-terminii, recognizing a general sequence of Leu–Gln↓Ser/Ala/Gly (↓cleavage site). The ∼33 kDa severe acute respiratory syndrome coronavirus 2 (SARS-CoV-2) 3CLpro consists of three structural domains: Domains I and II (residues 8–101 and 102–184, respectively) fold into an antiparallel β-barrel conformation and contains the substrate binding and catalytic sites (Cys145/His41 catalytic dyad). Domain III (residues 201–303) consists of five α-helices which are essential for self-assembly to form an enzymatic active homodimer.3−6 Due to its importance in the viral life cycle, β-coronavirus 3CLpro enzymes share this fold with a sequence identity of greater than 80% within the same genus (SARS-CoV and SARS-CoV-2 have 96% sequence identity)5 and a high degree of sequence conservation in the enzymatic site domain.7
Proteases have been the focus of intense research which resulted in the successful development of multiple inhibitors targeting diverse cellular and viral proteases. For example, protease inhibitors are currently being administrated as a part of direct-acting antiviral combination therapy which was able to transition human immunodeficiency virus (HIV) infections from an acute fatal disease to a manageable chronic condition and offer above 90% cure rates for long-lasting hepatitis C viral (HCV) infections.8 Moreover, treatment with the SARS-CoV-2 3CLpro inhibitor PF-07321332 (along with the CYP3A4 inhibitor ritonavir) is highly effective in reducing the risk of developing severe illness in high-risk patients.9 Nonetheless, many potential compounds identified through in vitro assays are less effective when examined in situ or in vivo either due to poor cell permeability, lack of specificity, short half-life, or cytotoxicity. Moreover, in vitro conditions often fail to fully recapitulate the salt concentration, viscosity, pH, and local protein concentrations in the cellular milieu which can affect protein–protein interactions, stability, and activity. Here, we report the construction of a transcriptional assay which provides a sensitive fluorescent–luminescent activatable sensor capable of detecting and quantifying intracellular SARS-CoV-2 3CLpro activity, enabling the detection of viral infection and providing a platform for detection and validation of potential SARS-CoV-2 3CLpro inhibitors. Employing this platform, we examined the efficiency of known protease inhibitors and identified potent 3CLpro inhibitors from several chemical libraries. We conducted a comprehensive computational analysis of the lead compounds’ mechanism of inhibition and showed the correlation between the extent of catalytic dyad occlusion and the experimental enzyme inhibition. Amino acid substitutions in positions predicted to interact with specific ligands confirmed the computational simulations and their effects on occlusion of the catalytic site. The occlusion-based mechanistic criterion for predicting inhibition further enabled us to resolve the question of whether some of the inhibitors act by binding at the allosteric site rather than the catalytic site and enabled the identification of a heretofore unrecognized allosteric ligand binding site suitable for inhibitor design.
Results and Discussion
Construction and Validation of a SARS-CoV-2 3CLpro Genetic Reporter
To generate a reproducible cell-based assay, 3CLpro protease activity was linked to the release of a membrane-tethered transcription factor (TF) leading to the upregulation of reporter genes. Figure 1 illustrates the general protease reporter design: TF GAL4 was fused to dopamine receptor D1 (DRD1) with an 18 amino acid linker corresponding to SARS-CoV-2 3CLpro protease recognition and cleavage site. Following proteolytic cleavage, GAL4 translocates to the nucleus and activates the transcription of a Citrine-T2A-Gaussia luciferase (Gluc) reporter cassette. First, the sensitivity and specificity of the reporter cells was evaluated, and more than a ∼70-fold increase in the luminescent signal was detected after 3CLpro expression. In contrast, using a catalytically inactive 3CLproC145A,10 a linker peptide containing the tobacco mosaic virus (TMV), or a protease cleavage site instead did not result in significant luminescence increase (Figure 2A). The fluorescent signal presented a similar trend with significant activation observed during protease expression with the corresponding cleavage site compared to other control samples (Figure 2B), suggesting that transcription activation is strictly dependent on intracellular 3CLpro proteolytic activity.
Figure 1.

Dual live-cell reporter for the detection of SARS-CoV-2 3CLpro. Schematic of the live-cell reporter design; GAL4 is fused to membrane-localized receptor DRD1 with a 3CLpro cleavable linker and expressed in cells with a genomic integrated UAS::Citrine-T2A-GLuc reporter cassette.
Figure 2.
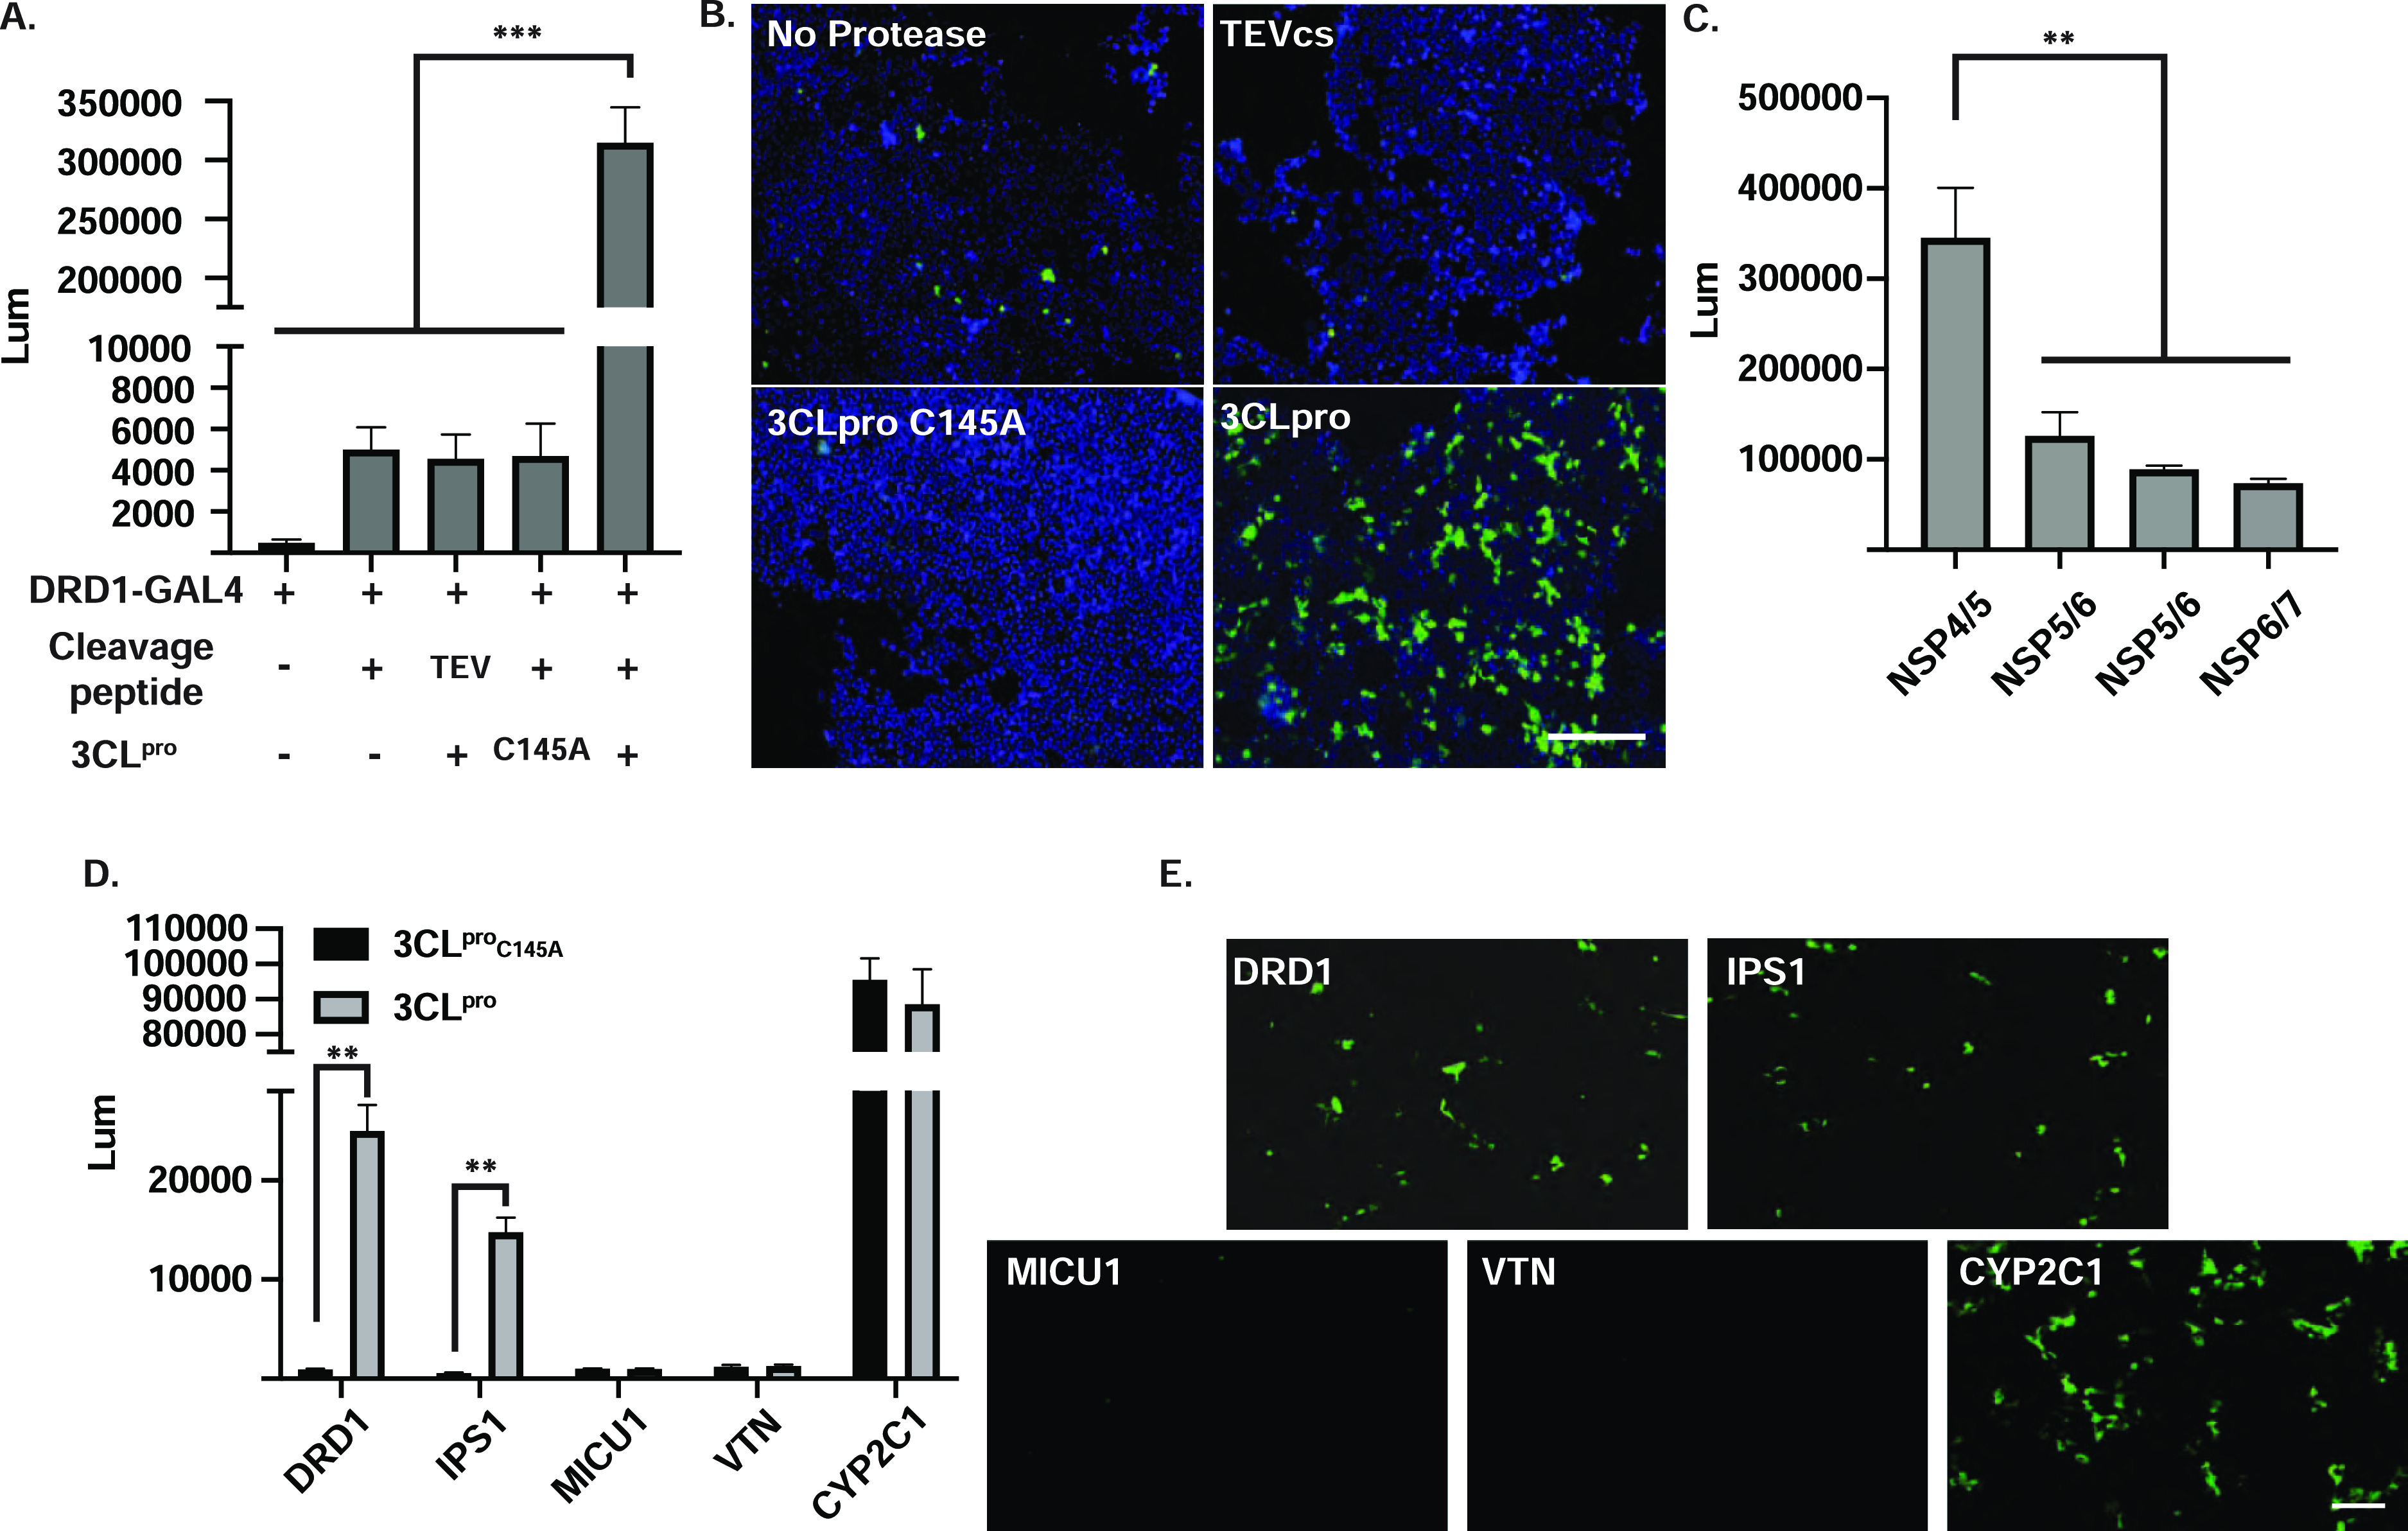
Validation of the SARS-CoV-2 3CLpro live-cell reporter. (A) HEK293T cells were transfected with reporter components as stated in the panel, and luciferase activity was quantified 48 h after transfection. Significant increase was detected only in cells that expressed catalytically active 3CLpro together with the corresponding cleavage site. Data was plotted as mean ± SD. Statistical analysis was performed using a two-tailed Student’s t-test, N = 3, *** = p ≤ 0.005. (B) Representative fluorescence images of citrine expression in HEK293T cells 48 h after transfection. Scale bar, 100 μm. (C) HEK293T cells were transfected with GAL4-DRD1 fusion with different 3CLpro linkers corresponding to the viral NSP’s junction sites as stated in the panel. Luciferase activity was quantified 48 h after transfection. N = 3, data was plotted as mean ± SD. (D) 3CLpro cleavage efficiency was evaluated with different GAL4 fusion proteins as stated in the graph (NSP4/5 linker was used in all the constructs) and compared to the catalytically inactive 3CLproC145A. N = 3, data was plotted as mean ± SD. (E) Representative fluorescence images of citrine expression in HEK293T cells 48 h after transfection 3CLpro and different GAL4 fusion proteins. Scale bar, 100 μm.
To further evaluate whether the proteolytic efficiency is directly correlated to the reporter cassette transcription, we tested additional linkers corresponding to different SARS-CoV-2 protease cleavage sites (NSP junctions). The NSP4/5 cleavage site exhibited the highest activation with ∼70-fold signal increase (Figures 2C and S1), while a lower signal was observed by the other cleavage sites (NSP5/6 ∼ 26 fold, NSP6/7 ∼ 18 fold, and NSP7/8 ∼ 15 fold). This is consistent with previous work demonstrating the SARS-CoV 3CLpro, which shares a 96% sequence identity with SARS-CoV-2 3CLpro,11 preferentially cleaves the NSP4/5 junction, while NSP5/6, NSP6/7, and NSP7/8 junctions are less efficiently processed.12,13 Next, we examined the proteolytic cleavage efficiency dependence on intracellular location and fusion partners. To this end, transcription activation was evaluated with different GAL4-fusion partners with and without catalytically active 3CLpro. As shown in Figure 2D,E, GAL4 fusion to either vimentin (cytoplasm) or MICU1 (mitochondria) did not result in significant signal activation, while fusion to the N-terminus of cyp2c1 (endoplasmic reticulum) exhibited protease-independent signal activation. 3CLpro-dependent activation was observed with GAL4 fusion to the DRD1 receptor (cell membrane) and to the C-terminus of IFN-β promoter stimulator protein 1 (IPS-1, MAVS, located in the mitochondria, peroxisomes, and endoplasmic reticulum). We decided to focus on the DRD1 fusion protein since it displayed the highest activation with a ∼1.6-fold difference in luminescent signal compared to the IPS-1 construct. To further validate the 3CLpro reporter design, we examined signal change following infection with SARS-CoV-2 (Figure 3). Reporter cells expressing the viral entry receptor ACE2 were infected at different multiplicities of infection (MOI) and examined 24 h post-infection (hpi). Immunostaining showed a detectible activation of Gluc in SARS-CoV-2 spike protein (S) positive cells (Figure 3B). Additionally, the percentage of (S)+ (GLuc)+ cells increased in correlation to the virus MOI (Figure 3C). Immunostaining results were further validated by quantitative real-time polymerase chain reaction (qRT-PCR), demonstrating a direct correlation between signal levels and the viral load (Figure 3D).
Figure 3.

SARS-CoV-2 infection activates the live-cell reporter. (A) Schematic of SARS-CoV-2 cell infection activating the reporter signal. Representative immunofluorescence staining for SARS-CoV-2 spike and GLuc in infected cells 24 hpi. Scale bar—20 μm. (B) Reporter cells were infected with SARS-CoV-2 using different MOI, and 24 hpi cells were immunostained for SARS-CoV-2 spike and GLuc. (C) The staining intensity of GLuc was compared between SARS-CoV-2 positive and negative cells in four random fields. Data was plotted as mean ± SD. Analysis was performed using a two-tailed Student’s t-test, N = 4, ** = p ≤ 0.01. (D) Relative GLuc expression levels in SARS-CoV-2 infected cells normalized to 18s ribosomal RNA (18s rRNA), 24 hpi. Data was plotted as mean ± SD. Statistical analysis was performed using a two-tailed Student’s t-test, N = 3, *** = p ≤ 0.005.
Inhibitor Analysis Using the SARS-CoV-2 3CLpro Genetic Reporter
To examine whether the reporter system can be used to evaluate potential viral protease inhibitors, first, we reviewed previously reported 3CLpro inhibitors. Compounds were added to the reporter cells at multiple concentrations, and the luminescent signal was measured and normalized to the vehicle-treated group after 48 h. Rupintrivir, an irreversible inhibitor of human rhinovirus (HRV) 3C protease,14 showed the lowest impact with a ∼20% reduction in GLuc signal measured only at the highest concentration tested (40 μM, Figure 4A) and no detectable effect at lower concentrations. This is in agreement with former reports showing that rupintrivir is an ineffective inhibitor of SARS-CoV15 or SARS-CoV-2 3CLpro activity.16 The HCV NS3/4A protease inhibitor boceprevir17 showed a dose-dependent inhibition with a calculated IC50 of 34.52 μM. Similarly, dose-dependent effects were detected with the broad spectrum 3C protease inhibitor GC37315 with an IC50 of 20.5 μM. The antineoplastic compound carmofur was recently shown to directly interact with the catalytic site of SARS-CoV-2 3CLpro18 and was also able to inhibit protease activity with a calculated IC50 of 8.66 μM. Calpain inhibitor II19 exhibited the strongest inhibition with a reduction of GLuc signal by more than 90% and an IC50 of 5.81 μM. Considering the strong inhibitory effect of calpain inhibitor II, we further evaluated the effect of other known calpain inhibitors on SARS-CoV-2 3CLpro activity (Figure S2). While calpain inhibitor VI did not display a significant effect, we observed a dose-dependent signal reduction by other calpain inhibitors. ALLN, a calpain I inhibitor, was found to be the most effective, inhibiting the protease activity almost completely with a calculated IC50 of 1.27 μM. Calpain inhibitors have previously been shown to inhibit 3CLpro activity of both SARS-CoV20 and SARS CoV-2,16 inhibit spike-mediated membrane fusion,21 and decrease virus-induced apoptosis.22 Calpain activation has also been implicated in multiple inflammatory-associated diseases23 and in a variety of human pathological conditions.24 However, further chemical and structural optimizations are required due to their relatively low specificity toward different cysteine proteases.
Figure 4.

Live-cell reporter enables high-throughput chemical screening for SARS-CoV-2 3CLpro inhibition. (A) 3CLpro inhibitor efficiency was evaluated in the reporter cells. Compounds were added at the indicated concentrations and incubated for 48 h, and inhibition was calculated as the percentage of luminescence signal relative to the vehicle-treated group. Data was plotted as mean ± SD, and statistical analysis was performed using a two-tailed Student’s t-test, N = 3, ** = p ≤ 0.01. (B) Schematic of the chemical screen methodology; cells were plated in 384 poly-lysine coated plates and incubated overnight. The following day, compounds were added at a concentration of 10 μM together with 100 ng/mL of doxycycline to induce 3CLpro expression. (C) Chemical screen result summary, the luminescence signal of treated cells was measured 48 h post-doxycycline induction, and signal percentage was calculated relative to the vehicle-treated group. Top leads were compounds that decreased the signal by 80% and more. (D) Inhibition efficacy and cell toxicity curves of PRT, EGCG, MND, IDX, and BEN. Each compound was tested at multiple concentrations, and compound toxicity and luminescent signal reduction was evaluated 48 h after addition. Data was plotted as mean ± SD, N = 3 for each concentration point, and nonlinear correlation analysis was used to evaluate compounds’ IC50.
Next, we used the 3CLpro reporter cell line to screen three chemical libraries (Prestwick FDA-approved drug library, Lopac library, and MicroSource bioactive chemical library) to identify compound candidates capable of inhibiting SARS-CoV-2 3CLpro activity. To this end, a doxycycline-inducible vector was used to control both time and 3CLpro expression levels. Library compounds and doxycycline were added to the reporter cells in 384-well plates [10 μM and 100 ng/ml, respectively (Figure 4B)]. 48 h post induction, GLuc activity was measured and compared to vehicle-treated cells (Figure 4C). Compounds that displayed 80% or more signal reduction with low cytotoxicity were considered as primary lead compounds. Five compounds were identified as lead compounds and further tested for their capacity to inhibit 3CLpro activity in a dose-dependent manner. As shown in Figure 4D, we observed concentration-dependent protease inhibition without significant impact on cell viability with the following compounds: parthenolide (PRT, IC50 = 0.66 μM), epigallocatechin gallate (EGCG, IC50 = 9.61 μM), mundulone (MND, IC50 = 0.407 μM), idazoxan (IDX, IC50 = 17.38 μM), and benserazide (BEN, IC50 = 63.78 μM). Several of the compounds identified in this screen were previously suggested as potential viral inhibitors, for example, EGCG was shown to inhibit SARS-CoV 3CLpro in vitro25,26 and has been suggested as a potential SARS-CoV-2 3CLpro inhibitor by in silico molecular docking studies.27,28 IDX hydrochloride was recently identified as a potential SARS-CoV-2 inhibitor in an in vitro chemical screen.29 BEN hydrochloride was identified as a potent Coxsackievirus 3C protease (3Cpro) inhibitor,30 and MND acetate was identified in an in vitro chemical screen targeting Middle East respiratory syndrome coronavirus (MERS-CoV).31 To further confirm the compounds’ specificity, a FRET-based assay was used to quantify the 3CLpro activity,32 recombinant SARS-CoV 3CLpro was incubated with the compounds in different concentrations followed by the addition of a FRET peptide substrate, and relative protease activity levels were calculated in comparison to the vehicle-treated protease (Figure S3). We detected a concentration-dependent inhibition with IC50 values comparable to the levels observed in the 3CLpro cell reporter, which suggest the genetic reporter can not only detect potential inhibitors but also anticipate to a certain degree the efficiency of a potential compound. Nonetheless, it is important to highlight that 3CLpro enzymatic activity and the levels of a potential inhibitor were previously shown to be sensitive to the condition used in the assay, and effects such as protein conformational changes and monomer–dimer equilibrium can significantly influence the results,33 which emphasize the importance of examining compounds also in a cellular setting to avoid non-specific effects.
Identified Compounds Inhibit SARS-CoV-2 Infection
Next, we examined whether the identified compounds are efficient inhibitors in the context of SARS-CoV-2 infection and can help reduce the viral load. To this end, lung epithelial cells (A549-ACE2) were infected with SARS-CoV-2 (USA-WA1/2020) at an MOI of 0.1 in the presence or absence of chemical compounds (Figure 5A). Immunostaining targeting SARS-CoV-2 spike protein revealed approximately ∼30% of infected cells in the vehicle cells, while in the treated group, we observed a statistically significant reduction of infected cells. PRT, idazoxan hydrochloride, and MND acetate were able to inhibit virus propagation almost completely, reducing the number of infected cells by more than 90% compared to the vehicle-treated group at a concentration of 10 μM. Furthermore, MND acetate was able to maintain strong inhibitory effect also at a lower concentration of 1 μM (Figure 5B), in excellent agreement with the ranking by both the SARS-CoV-2 3CLpro genetic reporter and the computational findings of the largest occlusion of the catalytic site. Quantification of viral nucleocapsid sgRNA levels (as a measure for active viral genome replication) across multiple concentrations was evaluated by qRT-PCR, and IC50 values were calculated, showing similar trends with a significant decrease of vRNA in the treated groups compared to the control samples (Figure 5C).
Figure 5.
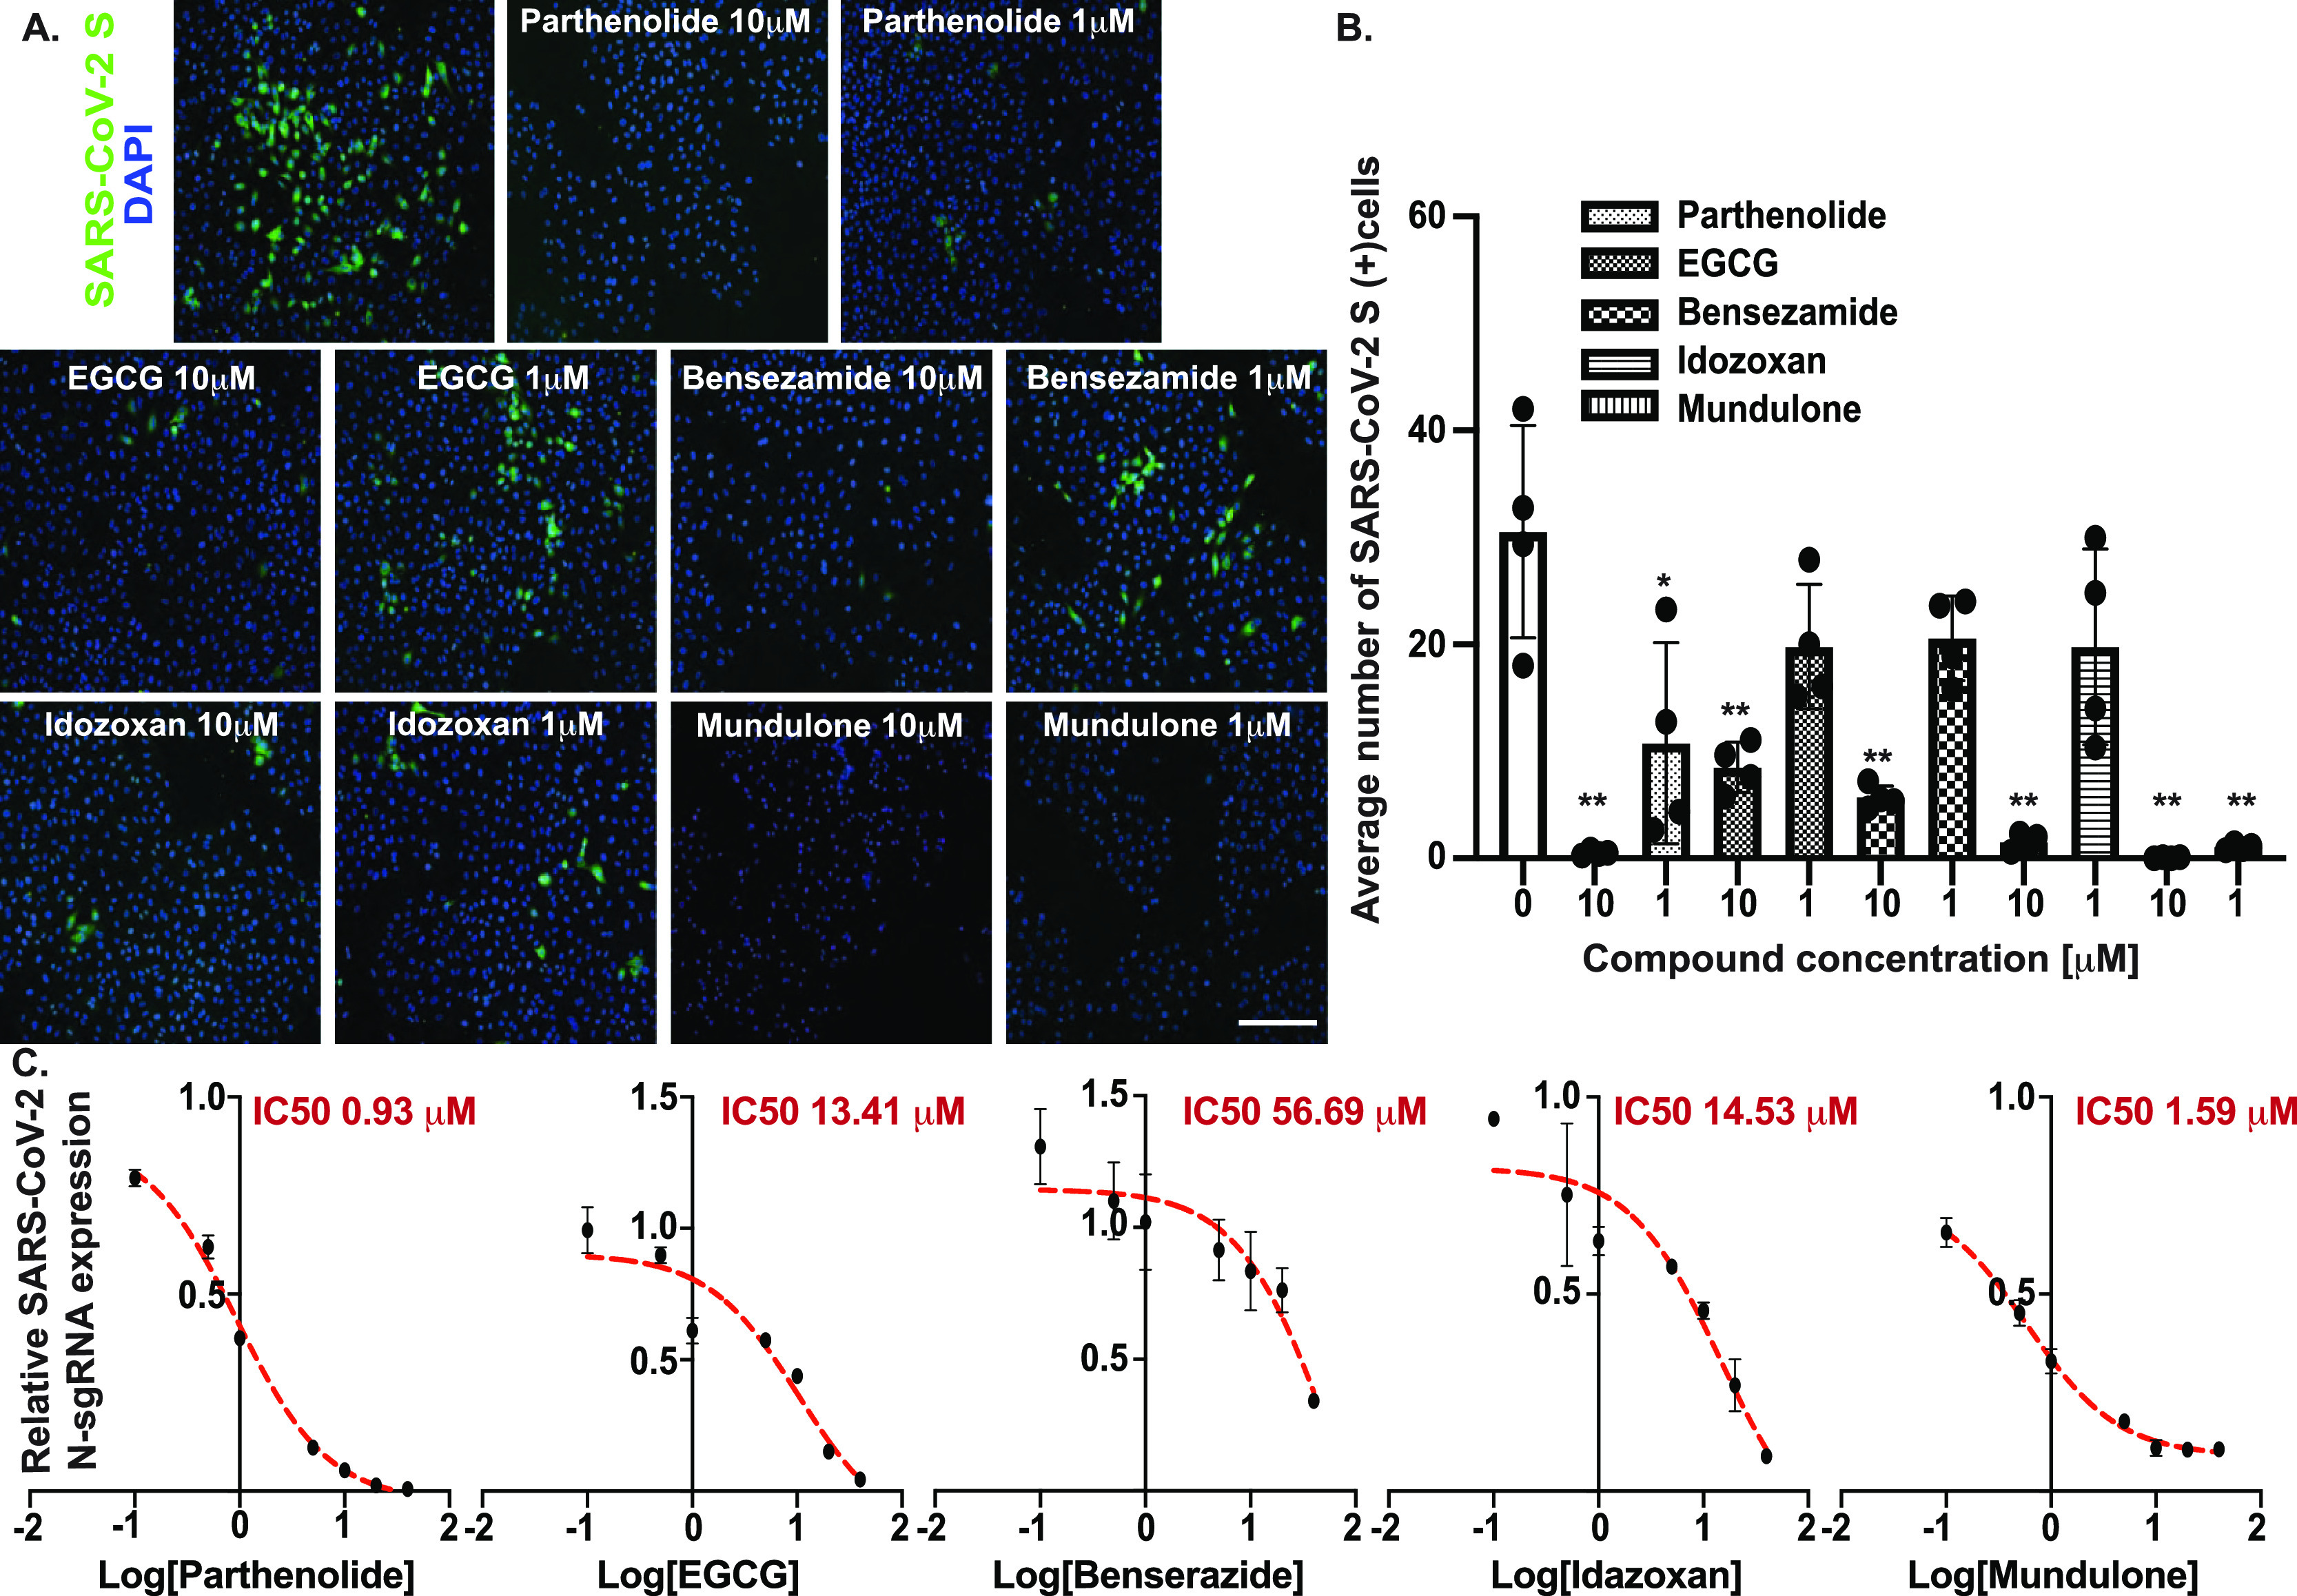
Identified compounds SARS-CoV-2 inhibition evaluation in lung epithelial cells. (A) A549-ACE2 cells were infected with SARS-CoV-2 (MOI = 0.1) and treated with the identified compounds in the indicated concentrations or with vehicle; 24 hpi cells were immuno-stained for SARS-CoV-2 spike protein (SARS-S). Scale bar = 100 μm. (B) Quantification summary of the percentage SARS-CoV-2 positive cells; images from four random fields were analyzed, and the percentage of SARS-S+ cells was determined. Data was plotted as mean ± SD, N = 3. Analysis was performed using a two-tailed Student’s t-test, N = 3, ** = p ≤ 0.01. (C) Relative SARS-CoV-2 viral RNA expression in A549-ACE2-infected cells (24 hpi) treated with the identified compounds in the indicated concentrations. Total extracted RNA was evaluated for the presence of SARS-CoV-2 subgenomic N transcripts, and the expression level was calculated relative to the vehicle-treated group. Data was plotted as mean ± SD, N = 3. Analysis was performed using a two-tailed Student’s t-test, N = 3, ** = p ≤ 0.01.
Computational Analysis of the Mechanism of Inhibition
Similar to previously reported 3CLpro inhibitors, the lead compounds identified in this work can interact with the enzyme active site (orthosteric binding) as shown in Figure 6, blocking the access of substrates to the Cys145/His41 catalytic residues.5,34−37 However, some repurposed drugs38−41 and compound fragment hits42−44 have been reported to favor binding at the interface of the 3CLpro protomers (dimerization interface) along domains II and III. Inhibition by binding to a region distal to the active site would be considered to involve an allosteric mechanism45−47 that has remained unidentified. To reveal the mechanisms of inhibition of the various compounds, we investigated the apo- and ligand-bound forms of the 3CLpro dimer with all-atom molecular dynamics (MD) simulations. Computational docking experiments described in Methods were used as the starting points for the analysis, and the MD simulations were carried out for the best docking results for each ligand in the catalytic (orthosteric) site and in the individual docking (putative allosteric) site at the dimerization interface of the enzyme.
Figure 6.
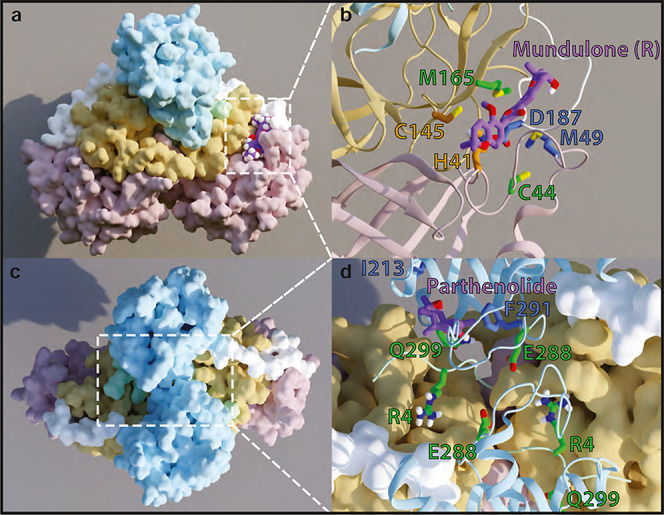
Illustration of the mode of inhibitor binding to 3CLpro in the catalytic site and the dimerization interface site. The figure panels obtained from representative frames from the MD simulation trajectories show preferred modes of binding for the MND-R that prefers the catalytic site (panels A,B) and for PRT which prefers the dimerization interface site (panels C,D). Panels (A,C) present the protein domains in different colors (domain 1 in pink; 2 in yellow; 3 in light blue; N-finger in mint; and linker loop in white). Panels (B,D) zoom into the binding site regions showing the inhibitors in purple, the residues probed by mutagenesis in green, and residues with the largest contributions to the BFE in blue.
Inhibitor Binding Modes at the 3CLpro Orthosteric and Allosteric Sites
To evaluate the binding of the identified inhibitors at the 3CLpro orthosteric and allosteric sites, we modeled the results of the MD simulations of each of the 3CLpro inhibitors starting from the docked poses at the two sites explored for each were ranked by the calculated binding free energies (BFEs) from the corresponding MD trajectories using the MM-PB/GBSA approach (see Methods). The protein–ligand total BFE values calculated for each compound (Table S4) indicate the preferences of each ligand for the sites and modes of binding. Thus, we found that both BEN enantiomers have stronger interaction energies with the catalytic site over the dimerization interface region (by ∼10 kcal/mol). In contrast, the S enantiomer of MND, (MND)-S, and PRT are more likely to bind at the dimerization site, with a BFE ∼ 7 kcal/mol lower than at the catalytic site. The rest of the compounds (EGCG, R and S enantiomers of IDX—(IDX)-R/S, and R-enantiomer of MND—MND-R) have comparable binding energies at the catalytic and dimerization interface sites, indicating no preference between orthosteric and allosteric binding modes. Preferred modes of binding at the two sites are illustrated in Figure 6 for MND-R (catalytic site—Figure 6A,B) and PRT (dimerization interface—Figure 6C,D), and the poses for all other compounds at the two sites are presented in Figures S3 and S4, respectively. Notably, MND and PRT have the highest calculated binding affinity among the identified inhibitors at the catalytic and dimerization sites, respectively (Table S4). For each inhibitor, we identified the residues that contribute most to the BFE in their corresponding binding sites. These were determined from the decomposition of the free energies obtained with the MM-PB/GBSA approach into contributions from individual residues (see detailed formalism in Methods). The top two contributors to the specific BFE for at least two compounds at one of the sites are highlighted in Table S4. Some of these residues—including C44, M49, and M165 at the catalytic site; and R4, F284, and S291 at the dimerization interface—have been reported to be involved in the binding of a variety of ligands with predicted and measured inhibitory.5,34,35,38,42,44 As shown in Table S5, the mutagenesis studies have highlighted M165 and R4 as key residues for BEN inhibition, resulting in a complete loss of inhibition in the alanine variants. Moreover, we were able to validate the predictions for the role of M165 in the inhibitory activity of MND, by a significant decrease of MND IC50 in the M165A compared to the WT enzyme. Similarly, the inhibition efficiency of PRT was reduced in the M165A and Q299A mutants compared to WT. The nature of the direct involvement we identified for Q299 in the inhibition of 3CLpro is consistent with the importance of this region for inhibition by glutathionylation at C300.48
Inhibitors Binding at the Catalytic Site Occlude the Access to the C145/H41 Dyad to Different Extents
The extent of occlusion of the catalytic residues by the binding of the inhibitors was quantified from the results of the MD simulations by comparing the calculated solvent accessible surface area (SASA) of the catalytic residues in the trajectories of the complexes, with the SASA in the apo 3CLpro dimer trajectory. Results in Figure 7A show that the extents of occlusion indicated by this comparison for C145 and for the combined C145/H41 dyad differ among the inhibitors. The largest effect of orthosteric site binding is calculated for MND-R and EGCG, which reduce the SASA of both C145 and C145/H41 SASA to very low values compared to apo (see green and purple bars, respectively, relative to the axis on the right). In contrast, IDX and BEN are not as effective. Catalytic site occlusion by each compound was also compared with the corresponding experimental inhibitory efficacy, quantified by the luminescence assay at the highest concentration (100 μM). The comparison of occluding effects with their relative effects on the luminescence-based indicator of inhibitory activity (blue bars in Figure 7A relative to left axis) shows good agreement between these measures. Thus, a 2–3 times higher efficacy in signal reduction by both MND-R and EGCG compared to the other two ligands corresponds to their relative ranking by occlusion of the catalytic residues.
Figure 7.

Relation between the extents of occlusion of the catalytic residues by inhibitor binding and the inhibitory efficiency measured by luminescence. The SASA of the catalytic residues (C145 alone, green bars; the combined C145/H41 dyad, maroon bars) was calculated in the trajectories of the 3CLpro dimer complexes with inhibitor bound at the orthosteric (catalytic) site (left panel) and at a dimerization interface site (right panel). The occlusion was quantified by comparing the SASA calculated in the presence of each inhibitor to the SASA values in the apo simulation trajectory. The rank order of occlusion is seen to agree with the ranking of the experimentally measured inhibitory efficiency quantified by the reduction in luminescence produced by each inhibitor.
Overall, this analysis shows that all the ligands predicted to prefer binding at the orthosteric site can inhibit 3CLpro by direct occlusion of the catalytic residues with efficiencies that correspond to their effect measured by the SARS-CoV-2 3CLpro genetic reporter.
Inhibitor Binding at the 3CLpro Dimer Interface Can Occlude Access to the C145/H41 Dyad through an Allosteric Mechanism
Unlike the catalytic site binding poses, inhibitor binding at the dimer interface cannot directly occlude the accessibility to the catalytic site. Nevertheless, the same SASA-based indicators show that PRT binding at the dimerization site leads to a large reduction in H41 + C145 SASA (29 Å2) compared to the apo simulation result (55 Å2) (Figure 7B, purple bars). This shows that binding at this allosteric site can occlude access to the catalytic residue pair C145 + H41. Among the other ligands, only IDX-S appears to elicit a SASA reduction relative to apo by binding in this region.
PRT as a Prototypical Allosteric Inhibitor
Analysis of the MD trajectories for the PRT-3CLpro dimer complex at the dimerization interface reveals major conformational rearrangements in the catalytic site. We used NbIT49—an information theory-based analysis framework for analysis of allosteric pathways (see Methods)—to examine how much information is shared in the dynamics between the binding site of PRT in the dimer interface site (DBS) and the active site residues that occlude C145/H41 (occluding residues—OR). This is expressed in the coordination information (CI) component calculated with the DBS as a “coordinator” site, and all heavy atoms of the OR as the “coordinated” site. As a control for the significance readout of the calculated CI values for the functional sites, we compare the magnitude of the CI values calculated for the functional sites with values obtained for a set of arbitrarily chosen groups of residues (“decoy” sites) distributed throughout the 3CLpro (as background control groups, we used the set D1–D3 detailed in Supporting Information and Figure S5). The results shown in Figure 8C,D quantify the CI values and the normalized CI (NCI) values between DBS, and the OR_apo and OR_holo groups of residues in the active site. The residues in these OR groups were identified to occlude the catalytic dyad in the apo/holo simulations, respectively (Figure 8A,B). In the apo 3CLpro dimer structure, the NCI values for DBS/OR_apo and DBS/OR_holo coordination (22 and 24%, respectively, Figure 8C) are much higher than for those with the background control group DBS/D1–D3 (6–12%, see Table S6A in Supporting Information). The high NCI indicates a large mutual information connection between the active site and the allosteric binding pocket in the apo state of the enzyme dimer. By contrast, with PRT bound in this pocket, the NCI values are drastically reduced to low levels (11 and 16%, Figure 8D) that do not differ from the non-significant NCI values of the background controls DBS/D1–D3 (5–11% in Table S6). The strong allosteric effect of PRT binding is thus found to stabilize the catalytic site in a new conformation that shields sterically the catalytic dyad from interactions with substrates and disrupts the mutual information connection between the binding region and the active site as shown in Figure 8D by the reduction in NCI values. Notably, this major reduction of coordinating information in the PRT-bound 3CLpro pertains to both directions of communication, as the NCI values are drastically reduced even if the occluding residues were considered as coordinators (Figure 8C,D). The occluding rearrangement of the residues surrounding the C145/H41 is evident in the comparison between panels (A,B) in Figure 8. Notably, the same NbIT-based analysis of the MD trajectories for the IDX-S bound in the dimer interface region shows no change in NCI values between the DBS composed of specific IDX-binding residues and the OR sets compared to the apo state, indicating that the allosteric connection is not operative from the IDX binding site in the dimerization interface region (see Table S7). This underscores the specific allosteric interaction capability of binding in the PRT site. Indeed, unlike the substantial occlusion produced by PRT, the small occlusion observed from the SASA calculations for IDX (Figure 6B) is likely due to a local rearrangement because the information connection between the catalytic site and the IDX binding site is not affected (Table S7). Thus, our information theory-based analyses have revealed a site-specific allosteric mechanism of inhibition by PRT. With the specific identity of the residues involved in the CI between the catalytic site and this locus at the dimer interface, our findings identify a heretofore unrecognized site for allosteric inhibition of 3CLpro that should be useful for the development of allosteric SARS-CoV-2 3CLpro inhibitors, and a detailed account of the allosteric mechanism of inhibition.
Figure 8.

PRT disrupts the allosteric communication between the DBS and the catalytic site of 3CLpro. (A) Apo structure, with the residues in the dimeric binding site shown in a blue surface and residues that occlude the catalytic dyad shown in a gray surface. (B) In the complex with PRT (in purple) bound in the DBS, the residue groups are shown in the same colors as in A. Note the dramatic reduction in accessibility to the catalytic dyad. (C) Values of the TC. CI and NCI (in parentheses) are shown for apo 3CLpro, calculated with the DBS as the coordinator and the occluding residues defined from the apo and holo trajectories (OR_apo/OR_holo) as coordinated (values highlighted in red). For comparison, values from the corresponding reversed calculation (DBS is coordinated; occluding residue groups are coordinating) are highlighted in green. (D) Results from the same calculations as in (C), from the PRT-bound 3CLpro trajectories.
It has become clear that 3CLpro, the main protease of SARS-CoV-2, is an attractive target for the development of effective antiviral therapies. Amino acid homology and atomic structural analysis indicates a high degree of similarity and conservation of the active site among CoVs,50,51 which emphasizes its critical role during the viral life cycle and further suggests that an effective inhibitor potentially could serve as a pan-coronavirus therapeutic. In this study, we constructed a live-cell reporter which is dependent on the cleavage and release of a membrane-tethered TF (a protease substrate) by SARS-CoV-2 3CLpro, leading to the transcriptional activation of a fluorescent-luminescent reporter cassette. We observed a direct correlation between the degree of signal activation and the protease activity by comparing different cleavage sites that were previously shown to have different turnover numbers (kcat). Moreover, reporter cells infected with SARS-CoV-2 resulted in activation of the reporter cassette corresponding to the viral load, suggesting that it can also be a useful live-cell reporter to study viral infection and propagation without the need for a genetically modified virus. This is especially valuable, since rescue systems for CoVs are challenging to develop due to their large genome size and the risk of altering the virus fitness due to genomic manipulation. Several cell-based assays were previously developed to measure 3CLpro intracellular activity, and techniques such as Flip-GFP,52 Flip-Firefly luciferase,53 reverse nano-luciferase54 were shown to be useful to conduct chemical screen and identify potential new inhibitors.55,56 The ability to measure 3CLpro activity in cells using a reporter with high sensitivity and a wide dynamic range is a powerful tool for chemical compound screens. Moreover, other factors such as cell integrity, permeability, and compound toxicity can be simultaneously evaluated, providing a more comprehensive and accurate analysis of potential candidate compounds. Utilizing the live-cell reporter, we evaluated both compounds that were recently reported to inhibit 3CLpro and executed a chemical screen to generate new therapeutic leads. Using MD simulations, we were able to characterize the compounds’ interactions with 3CLpro and the mechanism of inhibition. Moreover, information theory-based analyses identified PRT as an allosteric inhibitor, interacting with the 3CLpro dimerization domain which result in occlusion of the enzyme catalytic dyad C145/H41. This live-cell reporter and the computational analysis presented in this study provide a robust platform to identify, characterize, validate, and further optimize potential compounds targeting the main virus protease, a key enzyme in the viral life cycle, which can hinder viral propagation and possibly mitigate disease severity.
Methods
Plasmid Cloning
Gal4 fusion constructs were generated using the pAAV-DRD1-NNES-eLOV-TEVcs-Flag-Gal4-V5 vector (Addgene 125227, Alice Ting); NSP cleavage sites were generated using a codon-optimized gBlock (IDT) and cloned into the NheI-BamHI digested plasmid to generate pAAV-DRD1-NSPcs-Flag-Gal4-V5. MICU1, vimentin, and cyp2c1 sequences were PCR-amplified from the Addgene plasmids 79057, 66170, and 79055 (Alice Ting) and cloned into HindIII-NheI-digested pAAV-DRD1-NSPcs-Flag-Gal4-V5 replacing the DRD1 gene. The IPS-1 (residues 462–520) fragment was generated using a codon-optimized gBlock (IDT), and Flag-Gal4-V5-NSPcs-IPS1 fusion was PCR-assembled and cloned into the HindIII-PspXI-digested plasmid to generate pAAV-Flag-Gal4-V5-NSPcs-IPS1. The reporter cassette was created using pFPGW-UAS-Citrine (Addgene 125232, Alice Ting), Gaussia luciferase was amplified from the pMCS-Gaussia Luc vector (Thermo Fisher), a T2A sequence was incorporated on the 5′ end by PCR, and the fragment was cloned into the BsrGI AscI-digested plasmid to create pFPGW-UAS-Citrine-T2A-GLuc. Inducible NSP5 was made using the pSBtet-Hyg plasmid (Addgene 60508, Eric Kowarz), and NSP5 and the catalytically inactive C145A mutant were amplified using pLVX-EF1alpha-SARS-CoV-2-nsp5-2xStrep-IRES-Puro and pLVX-EF1alpha-SARS-CoV-2-nsp5-C145A-2xStrep-IRES-Puro as templates (Addgene 141370 and 141371, Nevan Krogan) and cloned into the SfiI-digested plasmid to generate pSBtet-NSP5-Hyg and pSBtet-NSP5c145a-Hyg. All the cloning ligations were executed using the In-Fusion method (Takada Bio) and were transformed into Stellar competent cells (Takada Bio) according to the manufacturer’s instructions.
Cell Lines
HEK293T (human [Homo sapiens] fetal kidney) and Vero E6 (African green monkey [Chlorocebus aethiops] kidney) cells were obtained from ATCC (https://www.atcc.org/). A549 lung epithelial cells stably expressing ACE-2 development is described elsewhere.57 Cells were cultured in Dulbecco’s modified Eagle’s medium (DMEM) supplemented with 10% FBS and 100 IU/mL penicillin and 100 μg/mL streptomycin. All cell lines were incubated at 37 °C with 5% CO2.
Lentivirus Production
HEK293T cells were grown in a 10 cm plate to ∼90% confluency and were transfected with 6.2 μg of pFPGW-UAS-Citrine-T2A-GLuc, 4.6 μg of pPAX2, and 3.1 μg of pMD2.G using Lipofectamine 3000 (Thermo Fisher) according to the manufacturer’s instructions; cell media was collected 48 and 72 h after transfection and filtered through a 0.45 μm syringe (Nest Scientific).
Reporter Imaging and Quantification
Cells were stained in a 1:10,000 diluted Hoescht 33342 (Thermo Fisher) in cell media for 20 min, 37 °C with 5% CO2. Images were obtained using an EVOS Cell Imaging System (Thermo Fisher). For Gaussia luciferase measurements, native coelenterazine (GoldBio) was dissolved in acidified methanol (1 mg/mL) and was further diluted 1:100 in GLuc buffer: 0.1% disodium phosphate, 5% glycerol, 150 mM sodium bromide, 1 mM EDTA, 25 mM Tris–HCL pH 8, and 2 mM ascorbic acid. Luciferase activity was measured intracellularly; to this end, media was removed, and cells were lysed in GLuc buffer supplement with 0.1% Triton X-100 for 5 min at room temperature. The cell lysate was added to Gluc buffer with coelenterazine at a ratio of 1:5. Measurements were done in a 96- or 384-well white plate using a Spectramax M5 plate reader (Molecular Devices).
High-Throughput Chemical Screening
Stable HEK293T UAS:Citrine-T2A-Gaussia cells cultured in 10 cm plates were transfected with pSBtet-NSP5-Hyg and pAAV-DRD1-NSP4/5cs-Flag-Gal4-V5 using Lipofectamine 3000 (Thermo Fisher) according to the manufacturer’s instructions. Five hours after transfection, cells were washed and dissociated with trypsin–EDTA solution (Thermo Fisher) and re-plated into 0.01% poly-lysine-coated 384-well plates at 6000 cells/40 μL media/well. After overnight incubation, the cell media was changed, and 100 ng/mL doxycycline was added together with compounds from an in-house library of FDA-approved drugs (Prestwick), Lopac (Sigma Aldrich) and MicroSource (MicroSource discovery systems) at 10 μM concentration. DMSO treatment was used as a vehicle reference. After 48 hours, cells were harvested for luciferase quantification as described above.
Cytotoxicity Assay
HEK293T cells were plated in 0.01% poly-lysine-coated 96-clear bottom black plates (Corning) at 20,000 cells per well. After an overnight incubation, cell media was replaced and the examined compounds and vehicle were added in varying concentrations for 48 h. Cell viability was evaluated using PrestoBlue reagent (Thermo Fisher) according to the manufacturer’s instructions.
3CLpro In Vitro FRET Activity Assay
3CLpro (0.1 μM, BPS Bioscience) was incubated with the examined compounds at the indicated concentrations or with vehicle for 1 h at 25 °C (50 mM HEPES pH 6.5). The reaction was initiated by the addition of the peptide. The FRET substrate was added (1.25 μM, Anaspec), and each well was incubated at 25 °C for 2 h. Fluorescence was measured using a black 96-well plate on a SpectraMax M5 plate reader (Molecular Devices).
SARS-CoV-2 Virus
SARS-CoV-2 isolate USA-WA1/2020 (NR-52281) was deposited at the Center for Disease Control and Prevention and obtained through BEI Resources, NIAID, NIH. SARS-CoV-2 was propagated in Vero E6 cells in DMEM supplemented with 2% FBS, 4.5 g/L d-glucose, 4 mM l-glutamine, 10 mM non-essential amino acids, 1 mM sodium pyruvate, and 10 mM HEPES as described previously.28 Virus stock was purified using a 100 kDa MWCO Amicon filtration device, as described previously. All work involving live SARS-CoV-2 was performed in the CDC/USDA-approved BSL-3 facility of the Global Health and Emerging Pathogens Institute at the Icahn School of Medicine at Mount Sinai in accordance with institutional biosafety requirement.
SARS-CoV-2 Virus Infection Inhibition
The viral inhibition efficiency of the identified compounds was evaluated in A549-ACE2 cells. Cells were treated with the examined compounds at the indicated concentrations for 1 h at 37 °C. Subsequently, cells were infected with SARS-CoV-2 for 24 h at an MOI of 0.1 in DMEM supplemented with 2% FBS while maintaining compounds’ concentrations. Infected cells were either lysed in TRIzol (Thermo Fisher) for RNA analysis or fixed in 5% formaldehyde for 24 h for immunofluorescence staining, prior to safe removal from the BSL-3 facility.
Immunostaining
Fixed cells were washed three times with PBS and permeabilized using PBS 0.5% Triton X-100. Cells were blocked with 1% donkey serum (Sigma-Aldrich) in PBS 0.1% Triton X-100 for 1 h and stained with primary antibody diluted in 1% donkey serum, PBS 0.1% Triton X-100 at 4 °C overnight and secondary antibodies at RT for 1 h. Information regarding primary and secondary antibodies is provided in Table S3. Nuclei were counterstained using DAPI. Images were obtained using an epifluorescence microscope (Nikon TI-E Eclipse) using an 20× objective and a Zyla 5.5 sCMOS camera (Andor, Belfast, United Kingdom).
qRT-PCR
Total RNA samples were extracted using TRIzol reagent (Thermo Fisher) and the Direct-zol RNA Miniprep Plus kit (Zymo Research) according to the manufacturer’s instructions. cDNA was prepared using the LunaScript RT SuperMix Kit (New England Biolabs), and qRT-PCR was performed using Luna Universal qPCR Master Mix (New England Biolabs) on a cfx384 qPCR instrument (Bio-Rad) with primers specific for the TRS-L and TRS-B sites for the N gene as well as 18s rRNA as an internal reference.29 Delta–delta-cycle threshold (ΔΔCT) was determined relative to the 18s rRNA and mock infected/treated samples. Error bars indicate the standard deviation of the mean from three biological replicates.
Computational Procedures
Molecular Model of 3CLpro
The molecular structure of the SARS-CoV-2 main protease (3CLpro) used in this work is from the joint neutron/X-ray in PDB ID 7JUN, acquired at room temperature (resolution: 2.5 Å).6 This structure includes all 3CLpro residues, and importantly hydrogen atoms were resolved; thus, additional modeling of the 3CLpro structure was not needed (e.g., no missing loops, no need to predict protonation states, etc.).
Structural Models of 3CLpro Inhibitors
The initial 3D models of BEN, EGCG, IDX, MND, and PRT were downloaded from PubChem (https://pubchem.ncbi.nlm.nih.gov/).58 Both the R- and S-enantiomers were modeled for BEN, IDX, and MND. Schrodinger’s LigPrep protocol was used to assign initial OPLSe3 force field (FF) atom types, FF parameters, FF partial charges, as well as protonation states.59 These initial OPLS3e partial charges and parameters were refined using Schrodinger’s FFBuilder tool. These optimized partial charges and parameters were used in the inhibitor docking calculations. Note: The initial conformation used for each compound is inconsequential, as the modeling procedure (described below) robustly samples inhibitor conformation.
Identifying the Region of Putative Dimer Interface Binding Sites
A list of residues that compose the putative allosteric inhibitor binding site at the 3CLpro dimer interface (between the domain III regions of the two protomers) were identified from two sources:6 a collection of residues found in previous studies38,42,60,61 that bind with the inhibitors or fragments near the 3CLpro dimer interface; and58 residues predicted to belong to a ligand binding pocket near the 3CLpro dimer interface by two binding site prediction servers—ISMBLab-LIG62 and FTSite.63 The residues from both predictions were included in the list. The resulting list of residues at the DBS includes:
Protomer A: Residue 2–5, 126–127, 131, 137–139, 170, 172, 197, 207, 281–291
Protomer B: Residue 1–5, 126–127, 131, 137–138, 197, 207, 214, 281–291
Protocols for inhibitor docking and MD simulations Schrodinger’s Induced Fit protocol66 was used to dock the inhibitors at both the catalytic site and the putative dimer interface binding site. Briefly, this protocol consists of three stages: (1) flexible docking and scoring of ligands at the proposed binding site, (2) refinement of protein side chain conformations for the poses generated in stage 1, and (3) re-docking of ligands to the side chain-refined structures. To identify binding poses at the catalytic site, the inhibitors were docked (using this three-stage protocol) in a 30 Å box; the center of this box was defined as the centroid of the coordinates of the two catalytic residues, H41 and C145. Similarly, to identify binding poses at the putative DBS, the inhibitors were docked in a 30 Å box; the center of this box was defined as the centroid of the coordinates of the dimer site residues defined above. Other than the requirement that the inhibitors were docked in the defined boxes described above, no other constraints were used.
MD simulations were performed to improve exploration of inhibitor binding at the two proposed 3CLpro sites. CHARMM-GUI’s Solution Builder67 was used to construct each simulation system, with the best three poses ranked by the Schrodinger Emodel score were used as the starting points. Each 3CLpro inhibitor complex was solvated in a K+Cl– ionic solution, resulting in a system size of ∼180,000 atoms. The optimized partial charges described above were used for the ligands, and the ParamChem server68 was used to assign CHARMM36 atom types, as well as to generate bonded parameters (e.g., bonds, angles, and dihedrals). Parameters with high penalty values (e.g., >10) were optimized using the Force Field Toolkit69 within VMD.70 System equilibration was performed using openMM 7.5.071 and the CHARMM-GUI-defined equilibration protocol. The apo-3CLpro system was constructed analogously.
For the production of MD simulations, three replica simulations with openMM 7.5.0 were run for each equilibrated system. The simulations were run under the NPT ensemble (T = 310 K); particle-mesh-Ewald (PME) was used for electrostatics, switched Lennard-Jones interactions with a cutoff of 10–12 Å; additionally, the Monte Carlo barostat and Langevin Middle Integrator (i.e., Langevin dynamics with LFMiddle discretization) were used. A 4 fs time step was enabled by standard procedure of hydrogen mass repartitioning. Each of the 150 replicas (144 3CLpro-inhibitor replicas + 6 apo-3CLpro replicas) was run for 725 ns.
Calculation of the Free Energy of Inhibitor Binding to 3CLpro with an MM-GBSA Approach
First, solvent and ions were removed from the all-atom MD simulation trajectories, so that only the protein and inhibitor coordinates remain. On each of these frames, we calculated an approximate expression for the free energy of binding, G defined as
| 1 |
where EMM is the molecular energy calculated by the molecular mechanics algorithm, and Gsolv is the free energy of solvation. Complete formulation also includes an additional term, −TSSMM, accounting for the protein conformational entropy, which is neglected in MM-PB/GBSA implementations.72 This approximation is justified by the use of the calculated values as relative free energy of binding between each frame rather than the absolute free energy of binding. In addition, −TSSMM is typically much smaller than either EMM or Gsolv,72,75 and the standard error of this term has been reported to be larger than the standard error of EMM or Gsolv,74−76 offering only a minor improvement in the correlation between experimental and calculated free energies.72,75,77,78
Gsolv in eq 1 can be expressed as
| 2 |
where Gpolar and Gnonpolar refer to the electrostatic and the nonpolar contributions to the free energy of solvation, respectively. Gpolar is estimated by solving the generalized Born equation; here, we use CHARMM’s generalized Born using Molecular Volume (GBMV) Solvation Energy and Forces Module, model II79−82 and express Gpolar as
| 3 |
where k = −166.0(ϵsolute–1 – ϵsolvent), ϵ refers to the dielectric constant (1 and 80 for the solute and solvent, respectively); rij2 is the square of the distance between atoms i and j; the charges on atoms i and j are given by qi and qj, respectively. The Born radii of atoms i and j, noted αi and αj, respectively, are calculated by the GBMV method based on the molecular environment of the atoms in each frame.83,84
Gnonpolar is calculated using a semi-empirical method, in which Gnonpolar is a linear function of SASA29,30
| 4 |
with a representing a coefficient related to the solvent’s surface tension, and b is a fitting parameter related to solute–solvent interaction energy; here, we set a = 0.0072 kcal/Å2 and b = 0.82,85
Here, we adapted an implementation previously used for protein–protein interactions73,86,87 to treat protein–inhibitor interactions. Starting from an MD trajectory, the code uses CHARMM modules to calculate EMM, the Born radii, and the SASA. With the formalism mentioned above, the free energy of binding for the 3CLpro inhibitor complex is given by
| 5 |
where Gcomplex is the free energy of the 3CLpro inhibitor complex; GNSP5 is the free energy of 3CLpro alone; and Ginhibitor is the free energy of the inhibitor alone. We used a one-trajectory approach, in which each term in eq 5 was calculated using subsets of atoms from the same all-atom simulation of the 3CLpro inhibitor complex; this results in the cancelation of many intramolecular terms in G, and consequently more stable results overall.87
Residue-Based Decomposition of the Free Energy
The residue-based decomposition of the free energy (on selected frames, see Clustering on the MM-GBSA Free Energy of Binding) was performed as described in refs (86) and (87). Briefly, each individual atom’s contribution to Eelectrostatic was defined as
| 6 |
Likewise, each individual atom’s contribution to EvdWwas defined as
 |
7 |
The decomposition of Gnonpolar is given by
| 8 |
where SASAcomplexi refers to atom i’s contribution to the SASA of the entire complex, whereas SASANSP5 and SASAinhibitori refer to atom i’s contribution to the SASA of 3CLpro and the inhibitor, respectively. The decomposition of Gpolar is given by
| 9 |
The individual contributions of each atom within each side chain were summed to calculate each side chain’s contribution to ΔG.
Clustering on the MM-GBSA Free Energy of Binding
To identify sets of frames with the lowest free energy of binding (which are used in the residue-based energy decomposition), we first calculated the free energy of binding for every simulation frame as described above. All frames were aligned based on 3CLpro backbone atoms, to the frame with the lowest free energy of binding (highest affinity). The RMSD of the inhibitor atoms was calculated for the aligned trajectories using the inhibitor coordinates from the lowest free energy frame as reference. Finally, the subset of frames with inhibitor RMSD ≤ 4.0 Å was selected for the subsequent residue-based decomposition of the free energy of binding. This energy decomposition identifies residues that are important for the inhibitor interaction in the energetically most probable pose.
NbIT Analysis of MD Trajectories
Definition of Functional Sites for NbIT Analysis
The following sites on 3CLpro were defined for NbIT analyses. The residues in the PRT binding site at the dimer interface, termed DBS, were defined as those placing an atom within 4 Å from the ligand in at least 40% of frames in the MD trajectories of the complex. The same definition criteria were applied to define the residues surrounding the catalytic residue dyad, C145/H41 in the active site. These residue groups are termed “Apo Occluding Residues (OR_apo)” and “Holo Occluding Residues (OR_holo)” when identified from the respective MD simulation trajectories. Additionally, three “decoy” sites that do not overlap with any of the other sites were chosen arbitrarily on both protomers and termed D1_A-D3_A and D1_B-D3_B, respectively. The residue lists for the sites defined in this manner are
DBS: Protomer A Residue 2–5, 210, 213–214, 282, 291, 295, 296, 299, 300
OR_apo: Protomer A Residues 27–28, 38–40, 42–44, 143–144, 146–147, 163–164
OR_holo: Protomer A Residues 27–28, 38–40, 42–43, 52–55, 58, 60, 143–144, 146–147, 163–164. In each protomer, D1–D3 residues include D1 Residues 69–75; D2 Residues 151–157; D3 Residues 235–241. Note that all NbIT analyses were performed on the heavy atoms.
Calculation of CI
The CI is defined in NbIT64 from the total correlation (TC) which is the total amount of information shared among all residues in a “coordinated site” S1 (TC(S1)) that is not shared with another “coordinator site” S2. In the definition of TC(S1)
The  term is the configurational entropy of
residue ri, defined and
calculated as described together with other detailed procedures in
NbIT analyses in the original paper.49
term is the configurational entropy of
residue ri, defined and
calculated as described together with other detailed procedures in
NbIT analyses in the original paper.49
Denoting the coordinated site as S1 and the coordinator site as S2, the CI(S1,S2) is defined as
where TC(S1|S2) is the TC of S1 conditioned by S2
The normalization of CI values with respect to the TC in S1 is defined as
3Clpro Alanine Substitutions
Specific residue substitutions were accomplished by inverse PCR. Primers carrying the specific exchanges were used to amplify the entire 3Clpro plasmid (Q5, New England Biolabs). PCR products were treated with FastDigest DpnI (Thermo Fisher) at 37 °C overnight to remove template plasmid and separated by electrophoresis. Correct size amplicons were purified (Zymo Research) and treated with T4 Polynucleotide Kinase and T4 Ligase (New England Biolabs) and transformed into Stellar competent cells (Takada Bio), according to the manufacturer’s instructions. All plasmids were sequenced to validate correct substitution.65
Quantification and Statistical Analysis
N = 3 independent biological replicates were used for all experiments unless otherwise indicated. P-values were calculated by unpaired two-tailed Student’s t-test unless otherwise indicated. *p < 0.05, **p < 0.005.
Acknowledgments
This work was supported by the National Institute of Diabetes and Digestive and Kidney Diseases (NIDDK) (R01DK121072 and 1RO3DK117252), NIAID (2R01AI107301), Department of Medicine, Weill Cornell Medicine (R.E.S.), (DP3DK111907, R01DK116075, R01DK119667, and R01 DK124463 to S.C.), Department of Surgery, Weill Cornell Medicine (S.C.), the Defense Advanced Research Projects Agency (DARPA-16-35-INTERCEPT-FP-006 to B.R.T.), and NYSTEM (DOH01-STEM5-2016-00300-C32599GG to S.C.). S.C. and R.E.S. are supported as Irma Hirschl Trust Research Award Scholars. The computational work was performed using the resources, services, and support provided at the RPI Artificial Intelligence Multiprocessing Optimized System (AiMOS) accessed through an award from the COVID-19 HPC Consortium (https://covid19-hpc-consortium.org/), which is a unique private-public effort to bring together government, industry, and academic leaders volunteering free compute time and resources in support of COVID-19 research. The authors gratefully acknowledge, as well, the use of COVID-19 High Performance Computing Consortium resources of the Oak Ridge Leadership Computing Facility, which is a DOE Office of Science User Facility supported under contract DE-AC05-00OR22725, and of the in-house computational resources of the David A. Cofrin Center for Biomedical Information in the Institute for Computational Biomedicine at Weill Cornell Medical College.
Supporting Information Available
The Supporting Information is available free of charge at https://pubs.acs.org/doi/10.1021/acsbiomedchemau.2c00034.
Protease inhibitors used in this study; 3Clpro inhibitors identified in the cell reporter chemical screen; sequences of primers used for qRT-PCR in this study; inhibitors’ BFE; 3Clpro alanine substitution inhibition analysis; CI of decoy sites; IDX-S′ CI; fluorescence images of the 3CLpro cell-reporter with different NSP junction sequences; 3CLpro cell reporter activity quantification with calpain inhibitors; chemical screen lead compounds’ IC50 quantification using an in vitro FRET assay; inhibitors’ interactions with the 3CLpro catalytic site; inhibitors’ interactions with the 3CLpro dimerization site; and structural definition of 3CLpro arbitrary sites used for comparison (PDF)
Author Present Address
⊥ Department of Microbiology, New York University, New York, NY 10016, USA
Author Present Address
# TWINCORE Centre for Experimental and Clinical Infection Research, Institute for Experimental Virology, 30625 Hannover, Germany.
Author Contributions
¶ Y.B, X.D., B.E.N, H.W, and D.S. contributed equally. CRediT: Yaron Bram conceptualization (lead), data curation (lead), formal analysis (lead), investigation (lead), methodology (lead), project administration (lead), software (lead), supervision (lead), validation (lead), visualization (lead), writing-original draft (lead), writing-review & editing (lead); Xiaohua Duan investigation (equal); Benjamin E. Nilsson-Payant investigation (equal), validation (equal), writing-review & editing (equal); Vasuretha Chandar data curation (supporting), investigation (supporting); Hao Wu conceptualization (equal), formal analysis (equal), investigation (equal), methodology (equal); Derek M Shore conceptualization (equal), data curation (equal), investigation (equal), methodology (equal); Alvaro Fajardo investigation (supporting); Saloni Sinha investigation (supporting), writing-review & editing (supporting); Nora Hassan investigation (supporting), writing-review & editing (supporting); Harel Weinstein data curation (equal), funding acquisition (equal), investigation (equal), methodology (equal), resources (equal), software (equal), supervision (equal), writing-original draft (equal), writing-review & editing (equal); Shuibing Chen funding acquisition (equal), investigation (equal), methodology (equal), resources (equal), supervision (equal); Robert E. Schwartz conceptualization (equal), data curation (equal), funding acquisition (equal), investigation (equal), methodology (equal), project administration (equal), resources (equal), supervision (equal), validation (equal), writing-original draft (equal), writing-review & editing (equal).
The authors declare the following competing financial interest(s): R.E.S. is on the scientific advisory board of Miromatrix Inc, and a speaker and consultant for Alnylam Pharmaceuticals.
Notes
∇ Lead contact.
Supplementary Material
References
- Cui J.; Li F.; Shi Z. L. Origin and evolution of pathogenic coronaviruses. Nat. Rev. Microbiol. 2019, 17, 181–192. 10.1038/s41579-018-0118-9. [DOI] [PMC free article] [PubMed] [Google Scholar]
- V’kovski P.; Kratzel A.; Steiner S.; Stalder H.; Thiel V. Coronavirus biology and replication: implications for SARS-CoV-2. Nat. Rev. Microbiol. 2020, 19, 155–170. 10.1038/s41579-020-00468-6. [DOI] [PMC free article] [PubMed] [Google Scholar]
- Anand K.; Ziebuhr J.; Wadhwani P.; Mesters J. R.; Hilgenfeld R. Coronavirus main proteinase (3CLpro) Structure: Basis for design of anti-SARS drugs. Science 2003, 300, 1763–1767. 10.1126/science.1085658. [DOI] [PubMed] [Google Scholar]
- Yang H.; et al. The crystal structures of severe acute respiratory syndrome virus main protease and its complex with an inhibitor. Proc. Natl. Acad. Sci. U.S.A. 2003, 100, 13190–13195. 10.1073/pnas.1835675100. [DOI] [PMC free article] [PubMed] [Google Scholar]
- Zhang L.; et al. Crystal structure of SARS-CoV-2 main protease provides a basis for design of improved α-ketoamide inhibitors. Science 2020, 368, 409–412. 10.1126/science.abb3405. [DOI] [PMC free article] [PubMed] [Google Scholar]
- Kneller D. W.; et al. Unusual zwitterionic catalytic site of SARS-CoV-2 main protease revealed by neutron crystallography. J. Biol. Chem. 2020, 295, 17365–17373. 10.1074/jbc.ac120.016154. [DOI] [PMC free article] [PubMed] [Google Scholar]
- Roe M. K.; Junod N. A.; Young A. R.; Beachboard D. C.; Stobart C. C. Targeting novel structural and functional features of coronavirus protease nsp5 (3CLpro, Mpro) in the age of COVID-19. J. Gen. Virol. 2021, 102, 001558. 10.1099/jgv.0.001558. [DOI] [PMC free article] [PubMed] [Google Scholar]
- Zeuzem S.; et al. Glecaprevir-Pibrentasvir for 8 or 12 Weeks in HCV Genotype 1 or 3 Infection. N. Engl. J. Med. 2018, 378, 354–369. 10.1056/nejmoa1702417. [DOI] [PubMed] [Google Scholar]
- Hammond J.; et al. Oral Nirmatrelvir for High-Risk, Nonhospitalized Adults with Covid-19. N. Engl. J. Med. 2022, 386, 1397–1408. 10.1056/nejmoa2118542. [DOI] [PMC free article] [PubMed] [Google Scholar]
- Muramatsu T.; et al. SARS-CoV 3CL protease cleaves its C-terminal autoprocessing site by novel subsite cooperativity. Proc. Natl. Acad. Sci. U.S.A. 2016, 113, 12997–13002. 10.1073/pnas.1601327113. [DOI] [PMC free article] [PubMed] [Google Scholar]
- Dömling A.; Gao L. Chemistry and Biology of SARS-CoV-2. Chem 2020, 6, 1283–1295. 10.1016/j.chempr.2020.04.023. [DOI] [PMC free article] [PubMed] [Google Scholar]
- Fan K.; et al. The substrate specificity of SARS coronavirus 3C-like proteinase. Biochem. Biophys. Res. Commun. 2005, 329, 934–940. 10.1016/j.bbrc.2005.02.061. [DOI] [PMC free article] [PubMed] [Google Scholar]
- Grum-Tokars V.; Ratia K.; Begaye A.; Baker S. C.; Mesecar A. D. Evaluating the 3C-like protease activity of SARS-Coronavirus: Recommendations for standardized assays for drug discovery. Virus Res. 2008, 133, 63–73. 10.1016/j.virusres.2007.02.015. [DOI] [PMC free article] [PubMed] [Google Scholar]
- Dragovich P. S.; et al. Structure-based design, synthesis, and biological evaluation of irreversible human rhinovirus 3C protease inhibitors. 4. Incorporation of P1 lactam moieties as L-glutamine replacements. J. Med. Chem. 1999, 42, 1213–1224. 10.1021/jm9805384. [DOI] [PubMed] [Google Scholar]
- Kim Y.; et al. Broad-Spectrum Antivirals against 3C or 3C-Like Proteases of Picornaviruses, Noroviruses, and Coronaviruses. J. Virol. 2012, 86, 11754–11762. 10.1128/jvi.01348-12. [DOI] [PMC free article] [PubMed] [Google Scholar]
- Ma C.; et al. Boceprevir, GC-376, and calpain inhibitors II, XII inhibit SARS-CoV-2 viral replication by targeting the viral main protease. Cell Res. 2020, 30, 678–692. 10.1038/s41422-020-0356-z. [DOI] [PMC free article] [PubMed] [Google Scholar]
- Howe A. Y. M. The Discovery and Development of Boceprevir: A Novel, First-generation Inhibitor of the Hepatitis C Virus NS3/4A Serine Protease. J. Clin. Transl. Hepatol. 2013, 1, 22–32. 10.14218/JCTH.2013.002XX. [DOI] [PMC free article] [PubMed] [Google Scholar]
- Jin Z.; et al. Structural basis for the inhibition of SARS-CoV-2 main protease by antineoplastic drug carmofur. Nat. Struct. Mol. Biol. 2020, 27, 529–532. 10.1038/s41594-020-0440-6. [DOI] [PubMed] [Google Scholar]
- Sacco M. D.; et al. Structure and inhibition of the SARS-CoV-2 main protease reveal strategy for developing dual inhibitors against Mpro and cathepsin L. Sci. Adv. 2020, 6, 50. 10.1126/sciadv.abe0751. [DOI] [PMC free article] [PubMed] [Google Scholar]
- Schneider M.; et al. Severe Acute Respiratory Syndrome Coronavirus Replication Is Severely Impaired by MG132 due to Proteasome-Independent Inhibition of M-Calpain. J. Virol. 2012, 86, 10112–10122. 10.1128/jvi.01001-12. [DOI] [PMC free article] [PubMed] [Google Scholar]
- Simmons G.; et al. Inhibitors of cathepsin L prevent severe acute respiratory syndrome coronavirus entry. Proc. Natl. Acad. Sci. U.S.A. 2005, 102, 11876–11881. 10.1073/pnas.0505577102. [DOI] [PMC free article] [PubMed] [Google Scholar]
- DeBiasi R. L.; Edelstein C. L.; Sherry B.; Tyler K. L. Calpain Inhibition Protects against Virus-Induced Apoptotic Myocardial Injury. J. Virol. 2001, 75, 351–361. 10.1128/jvi.75.1.351-361.2001. [DOI] [PMC free article] [PubMed] [Google Scholar]
- Ji J.; Su L.; Liu Z. Critical role of calpain in inflammation. Biomed. Rep. 2016, 5, 647–652. 10.3892/br.2016.785. [DOI] [PMC free article] [PubMed] [Google Scholar]
- Potz B. A.; Abid M. R.; Sellke F. W. Role of Calpain in Pathogenesis of Human Disease Processes. J. Nat. Sci. 2016, 2, 9. [PMC free article] [PubMed] [Google Scholar]
- Chen C. N.; et al. Inhibition of SARS-CoV 3C-like protease activity by theaflavin-3,3′- digallate (TF3). Evidence-based Complement. Altern. Med. 2005, 2, 209–215. 10.1093/ecam/neh081. [DOI] [PMC free article] [PubMed] [Google Scholar]
- Nguyen T. T. H.; et al. Flavonoid-mediated inhibition of SARS coronavirus 3C-like protease expressed in Pichia pastoris. Biotechnol. Lett. 2012, 34, 831–838. 10.1007/s10529-011-0845-8. [DOI] [PMC free article] [PubMed] [Google Scholar]
- Das S.; Sarmah S.; Lyndem S.; Singha Roy A. An investigation into the identification of potential inhibitors of SARS-CoV-2 main protease using molecular docking study. J. Biomol. Struct. Dyn. 2021, 39, 3347–3357. 10.1080/07391102.2020.1763201. [DOI] [PMC free article] [PubMed] [Google Scholar]
- Ghosh R.; Chakraborty A.; Biswas A.; Chowdhuri S. Evaluation of green tea polyphenols as novel corona virus (SARS CoV-2) main protease (Mpro) inhibitors - an in silico docking and molecular dynamics simulation study. J. Biomol. Struct. Dyn. 2020, 39, 4362–4374. 10.1080/07391102.2020.1779818. [DOI] [PMC free article] [PubMed] [Google Scholar]
- Touret F.; Gilles M.; Barral K.; Nougairède A.; Van Helden J.; Decrolyde Lamballerie E. X.; Coutard B. In Vitro Screening of a FDA Approved Chemical Library Reveals Potential Inhibitors of SARS-CoV-2 Replication. Sci. Rep. 2020, 10, 13093. 10.1038/s41598-020-70143-6. [DOI] [PMC free article] [PubMed] [Google Scholar]
- Kim B. K.; et al. Benserazide, the first allosteric inhibitor of Coxsackievirus B3 3C protease. FEBS Lett. 2015, 589, 1795–1801. 10.1016/j.febslet.2015.05.027. [DOI] [PMC free article] [PubMed] [Google Scholar]
- Ko M.; et al. Screening of FDA-approved drugs using a MERS-CoV clinical isolate from South Korea identifies potential therapeutic options for COVID-19. Viruses 2021, 13, 651. 10.3390/v13040651. [DOI] [PMC free article] [PubMed] [Google Scholar]
- Fu L.; et al. Both Boceprevir and GC376 efficaciously inhibit SARS-CoV-2 by targeting its main protease. Nat. Commun. 2020, 11, 4417. 10.1038/s41467-020-18233-x. [DOI] [PMC free article] [PubMed] [Google Scholar]
- Behnem M. A. M. Inhibitor potency and assay conditions: A case study on SARS-CoV-2 main protease. Proc. Natl. Acad. Sci. U.S.A. 2021, 118, e2106095118 10.1073/pnas.2106095118. [DOI] [PMC free article] [PubMed] [Google Scholar]
- Dai W.; et al. Structure-based design of antiviral drug candidates targeting the SARS-CoV-2 main protease. Science 2020, 368, 1331–1335. 10.1126/science.abb4489. [DOI] [PMC free article] [PubMed] [Google Scholar]
- Jin Z.; et al. Structure of Mpro from SARS-CoV-2 and discovery of its inhibitors. Nature 2020, 582, 289–293. 10.1038/s41586-020-2223-y. [DOI] [PubMed] [Google Scholar]
- Qiao J.; et al. SARS-CoV-2 M pro inhibitors with antiviral activity in a transgenic mouse model. Science 2021, 371, 1374–1378. 10.1126/science.abf1611. [DOI] [PMC free article] [PubMed] [Google Scholar]
- Drayman N.; et al. Masitinib is a broad coronavirus 3CL inhibitor that blocks replication of SARS-CoV-2. Science 2021, 373, 931–936. 10.1126/science.abg5827. [DOI] [PMC free article] [PubMed] [Google Scholar]
- Liang J.; et al. Site mapping and small molecule blind docking reveal a possible target site on the SARS-CoV-2 main protease dimer interface. Comput. Biol. 2020, 89, 107372. 10.1016/j.compbiolchem.2020.107372. [DOI] [PMC free article] [PubMed] [Google Scholar]
- Menéndez C. A.; Byléhn F.; Perez-Lemus G. R.; Alvarado W.; Pablo J. J. de. Molecular characterization of ebselen binding activity to SARS-CoV-2 main protease. Sci. Adv. 2020, 6, eabd0345 10.1126/sciadv.abd0345. [DOI] [PMC free article] [PubMed] [Google Scholar]
- Günther S.; et al. X-ray screening identifies active site and allosteric inhibitors of SARS-CoV-2 main protease. Science 2021, 372, 642–646. 10.1126/science.abf7945. [DOI] [PMC free article] [PubMed] [Google Scholar]
- Jiménez-Avalos G.; et al. Comprehensive virtual screening of 4.8 k flavonoids reveals novel insights into allosteric inhibition of SARS-CoV-2 MPRO. Sci. Rep. 2021, 11, 15452. 10.1038/s41598-021-94951-6. [DOI] [PMC free article] [PubMed] [Google Scholar]
- Douangamath A.; et al. Crystallographic and electrophilic fragment screening of the SARS-CoV-2 main protease. Nat. Commun. 2020, 11, 5047. 10.1038/s41467-020-18709-w. [DOI] [PMC free article] [PubMed] [Google Scholar]
- El-Baba T. J.; et al. Allosteric Inhibition of the SARS-CoV-2 Main Protease: Insights from Mass Spectrometry Based Assays. Angew. Chem., Int. Ed. 2020, 59, 23544–23548. 10.1002/anie.202010316. [DOI] [PMC free article] [PubMed] [Google Scholar]
- Sencanski M.; et al. Drug Repurposing for Candidate SARS-CoV-2 Main Protease Inhibitors by a Novel In Silico Method. Molecules 2020, 25, 3830. 10.3390/molecules25173830. [DOI] [PMC free article] [PubMed] [Google Scholar]
- Dubanevics I.; McLeish T. C. B. Computational analysis of dynamic allostery and control in the SARS-CoV-2 main protease. J. R. Soc., Interface 2021, 18, 20200591. 10.1098/rsif.2020.0591. [DOI] [PMC free article] [PubMed] [Google Scholar]
- Sztain T.; Amaro R.; McCammon J. A. Elucidation of Cryptic and Allosteric Pockets within the SARS-CoV-2 Main Protease. J. Chem. Inf. Model. 2021, 61, 3495–3501. 10.1021/acs.jcim.1c00140. [DOI] [PMC free article] [PubMed] [Google Scholar]
- Carli M.; Sormani G.; Rodriguez A.; Laio A. Candidate Binding Sites for Allosteric Inhibition of the SARS-CoV-2 Main Protease from the Analysis of Large-Scale Molecular Dynamics Simulations. J. Phys. Chem. Lett. 2020, 12, 65–72. 10.1021/acs.jpclett.0c03182. [DOI] [PMC free article] [PubMed] [Google Scholar]
- Davis D. A.; et al. Regulation of the Dimerization and Activity of SARS-CoV-2 Main Protease through Reversible Glutathionylation of Cysteine 300. mBio 2021, 12, e0209421 10.1128/mBio.02094-21. [DOI] [PMC free article] [PubMed] [Google Scholar]
- LeVine M. V.; Weinstein H. NbIT - A New Information Theory-Based Analysis of Allosteric Mechanisms Reveals Residues that Underlie Function in the Leucine Transporter LeuT. PLoS Comput. Biol. 2014, 10, e1003603 10.1371/journal.pcbi.1003603. [DOI] [PMC free article] [PubMed] [Google Scholar]
- Pathak N.; et al. Uncovering Flexible Active Site Conformations of SARS-CoV-2 3CL Proteases through Protease Pharmacophore Clusters and COVID-19 Drug Repurposing. ACS Nano 2021, 15, 857–872. 10.1021/acsnano.0c07383. [DOI] [PubMed] [Google Scholar]
- Ullrich S.; Nitsche C. The SARS-CoV-2 main protease as drug target. Bioorg. Med. Chem. Lett. 2020, 30, 127377. 10.1016/j.bmcl.2020.127377. [DOI] [PMC free article] [PubMed] [Google Scholar]
- Froggatt H. M.; Heaton B. E.; Heaton N. S. Development of a Fluorescence-Based, High-Throughput SARS-CoV-2 3CLpro Reporter Assay. J. Virol. 2020, 94, 22. 10.1128/JVI.01265-20. [DOI] [PMC free article] [PubMed] [Google Scholar]
- O’Brien A.; et al. Detecting SARS-CoV-2 3CLpro expression and activity using a polyclonal antiserum and a luciferase-based biosensor. Virology 2021, 556, 73. 10.1016/j.virol.2021.01.010. [DOI] [PMC free article] [PubMed] [Google Scholar]
- Chen K. Y.; et al. A highly sensitive cell-based luciferase assay for high-throughput automated screening of SARS-CoV-2 nsp5/3CLpro inhibitors. Antiviral Res. 2022, 201, 105272. 10.1016/j.antiviral.2022.105272. [DOI] [PMC free article] [PubMed] [Google Scholar]
- Ma C.; Tan H.; Choza J.; Wang Y.; Wang J. Validation and invalidation of SARS-CoV-2 main protease inhibitors using the Flip-GFP and Protease-Glo luciferase assays. Acta Pharm. Sin. B 2022, 12, 1636–1651. 10.1016/j.apsb.2021.10.026. [DOI] [PMC free article] [PubMed] [Google Scholar]
- Li X.; et al. Ethacridine inhibits SARS-CoV-2 by inactivating viral particles. PLoS Pathog. 2021, 17, e1009898 10.1371/journal.ppat.1009898. [DOI] [PMC free article] [PubMed] [Google Scholar]
- Blanco-Melo D.; et al. Imbalanced Host Response to SARS-CoV-2 Drives Development of COVID-19. Cell 2020, 181, 1036–1045. 10.1016/j.cell.2020.04.026. [DOI] [PMC free article] [PubMed] [Google Scholar]
- Kim S.; et al. PubChem in 2021: new data content and improved web interfaces. Nucleic Acids Res. 2021, 49, D1388–D1395. 10.1093/nar/gkaa971. [DOI] [PMC free article] [PubMed] [Google Scholar]
- Harder E.; et al. OPLS3: A Force Field Providing Broad Coverage of Drug-like Small Molecules and Proteins. J. Chem. Theory Comput. 2016, 12, 281–296. 10.1021/acs.jctc.5b00864. [DOI] [PubMed] [Google Scholar]
- Sencanski M.; et al. Drug repurposing for candidate SARS-CoV-2 main protease inhibitors by a novel in silico method. Molecules 2020, 25, 3830. 10.3390/molecules25173830. [DOI] [PMC free article] [PubMed] [Google Scholar]
- Menéndez C. A.; Byléhn F.; Perez-Lemus G. R.; Alvarado W.; de Pablo J. J. Molecular characterization of ebselen binding activity to SARS-CoV-2 main protease. Sci. Adv. 2020, 6, eabd0345 10.1126/sciadv.abd0345. [DOI] [PMC free article] [PubMed] [Google Scholar]
- Jian J. W.; et al. Predicting Ligand Binding Sites on Protein Surfaces by 3-Dimensional Probability Density Distributions of Interacting Atoms. PLoS One 2016, 11, e0160315 10.1371/journal.pone.0160315. [DOI] [PMC free article] [PubMed] [Google Scholar]
- Kozakov D.; et al. The FTMap family of web servers for determining and characterizing ligand-binding hot spots of proteins. Nat. Protoc. 2015, 10, 733–755. 10.1038/nprot.2015.043. [DOI] [PMC free article] [PubMed] [Google Scholar]
- LeVine M.; Perez-Aguilar J. M.; Weinstein H.. N-Body Information Theory (NbIT) Analysis of Rigid-Body Dynamics in Intracellular Loop 2 of the 5-HT2A Receptor. Proceedings Iwbbio—International Work-Conference on Bioinformatics and Biomedical Engineering, 2014; Vol. 1–2, pp 1190–1201.
- Sherman W.; Day T.; Jacobson M. P.; Friesner R. A.; Farid R. Novel procedure for modeling ligand/receptor induced fit effects. J. Med. Chem. 2006, 49, 534–553. 10.1021/jm050540c. [DOI] [PubMed] [Google Scholar]
- Jo S.; Kim T.; Iyer V. G.; Im W. CHARMM-GUI: a web-based graphical user interface for CHARMM. J. Comput. Chem. 2008, 29, 1859–1865. 10.1002/jcc.20945. [DOI] [PubMed] [Google Scholar]
- Vanommeslaeghe K.; Raman E. P.; MacKerell A. D. Jr. Automation of the CHARMM General Force Field (CGenFF) II: assignment of bonded parameters and partial atomic charges. J. Chem. Inf. Model. 2012, 52, 3155–3168. 10.1021/ci3003649. [DOI] [PMC free article] [PubMed] [Google Scholar]
- Mayne C. G.; Saam J.; Schulten K.; Tajkhorshid E.; Gumbart J. C. Rapid Parameterization of Small Molecules Using the Force Field Toolkit. J. Comput. Chem. 2013, 34, 2757–2770. 10.1002/jcc.23422. [DOI] [PMC free article] [PubMed] [Google Scholar]
- Humphrey W.; Dalke A.; Schulten K. VMD: visual molecular dynamics. J. Mol. Graphics 1996, 14, 33–38. 10.1016/0263-7855(96)00018-5. [DOI] [PubMed] [Google Scholar]
- Eastman P.; et al. OpenMM 7: Rapid development of high performance algorithms for molecular dynamics. PLoS Comput. Biol. 2017, 13, e1005659 10.1371/journal.pcbi.1005659. [DOI] [PMC free article] [PubMed] [Google Scholar]
- Kumari R.; Kumar R.; Lynn A.; g_mmpbsa-A GROMACS Tool for High-Throughput MM-PBSA Calculations. J. Chem. Inf. Model. 2014, 54, 1951–1962. 10.1021/ci500020m. [DOI] [PubMed] [Google Scholar]
- Kollman P. A.; et al. Calculating structures and free energies of complex molecules: Combining molecular mechanics and continuum models. Acc. Chem. Res. 2000, 33, 889–897. 10.1021/ar000033j. [DOI] [PubMed] [Google Scholar]
- Homeyer N.; Gohlke H. Free Energy Calculations by the Molecular Mechanics Poisson–Boltzmann Surface Area Method. Mol. Inf. 2012, 31, 114–122. 10.1002/minf.201100135. [DOI] [PubMed] [Google Scholar]
- Yang T. Y.; et al. Virtual screening using molecular simulations. Proteins 2011, 79, 1940–1951. 10.1002/prot.23018. [DOI] [PMC free article] [PubMed] [Google Scholar]
- Spiliotopoulos D.; Spitaleri A.; Musco G. Exploring PHD Fingers and H3K4me0 Interactions with Molecular Dynamics Simulations and Binding Free Energy Calculations: AIRE-PHD1, a Comparative Study. PLoS One 2012, 7, e46902 10.1371/journal.pone.0046902. [DOI] [PMC free article] [PubMed] [Google Scholar]
- Rastelli G.; Del Rio A.; Degliesposti G.; Sgobba M. Fast and Accurate Predictions of Binding Free Energies Using MM-PBSA and MM-GBSA. J. Comput. Chem. 2010, 31, 797–810. 10.1002/jcc.21372. [DOI] [PubMed] [Google Scholar]
- Genheden S.; Ryde U. The MM/PBSA and MM/GBSA methods to estimate ligand-binding affinities. Expert Opin. Drug Discovery 2015, 10, 449–461. 10.1517/17460441.2015.1032936. [DOI] [PMC free article] [PubMed] [Google Scholar]
- Brown S. P.; Muchmore S. W. Corrections to Large-Scale Application of High-Throughput Molecular Mechanics with Poisson–Boltzmann Surface Area for Routine Physics-Based Scoring of Protein–Ligand Complexes. J. Med. Chem. 2009, 52, 4549. 10.1021/jm900663a. [DOI] [PubMed] [Google Scholar]
- Brooks B. R.; et al. CHARMM: The biomolecular simulation program. J. Comput. Chem. 2009, 30, 1545–1614. 10.1002/jcc.21287. [DOI] [PMC free article] [PubMed] [Google Scholar]
- Lee M. S.; Feig M.; Salsbury F. R.; Brooks C. L. New analytic approximation to the standard molecular volume definition and its application to generalized born calculations. J. Comput. Chem. 2003, 24, 1821. 10.1002/jcc.10367. [DOI] [PubMed] [Google Scholar]
- Lee M. S.; Salsbury F. R.; Brooks C. L. Novel generalized Born methods. J. Chem. Phys. 2002, 116, 10606–10614. 10.1063/1.1480013. [DOI] [Google Scholar]
- Still W. C.; Tempczyk A.; Hawley R. C.; Hendrickson T. Semianalytical Treatment of Solvation for Molecular Mechanics and Dynamics. J. Am. Chem. Soc. 1990, 112, 6127–6129. 10.1021/ja00172a038. [DOI] [Google Scholar]
- Hermann R. B. Theory of Hydrophobic Bonding .2. Correlation of Hydrocarbon Solubility in Water with Solvent Cavity Surface-Area. J. Phys. Chem. 1972, 76, 2754–2759. 10.1021/j100663a023. [DOI] [Google Scholar]
- Amidon G. L.; Yalkowsky S. H.; Anik S. T.; Valvani S. C. Solubility of Nonelectrolytes in Polar-Solvents .5. Estimation of Solubility of Aliphatic Monofunctional Compounds in Water Using a Molecular Surface-Area Approach. J. Phys. Chem. 1975, 79, 2239–2246. 10.1021/j100588a008. [DOI] [Google Scholar]
- Jayaram B.; Sprous D.; Beveridge D. L. Solvation free energy of biomacromolecules: Parameters for a modified generalized born model consistent with the AMBER force field. J. Phys. Chem. B 1998, 102, 9571–9576. 10.1021/jp982007x. [DOI] [Google Scholar]
- Zoete V.; Irving M. B.; Michielin O. MM-GBSA binding free energy decomposition and T cell receptor engineering. J. Mol. Recognit. 2010, 23, 142–152. 10.1002/jmr.1005. [DOI] [PubMed] [Google Scholar]
- Zoete V.; Meuwly M.; Karplus M. Study of the insulin dimerization: Binding free energy calculations and per-residue free energy decomposition. Proteins 2005, 61, 79–93. 10.1002/prot.20528. [DOI] [PubMed] [Google Scholar]
Associated Data
This section collects any data citations, data availability statements, or supplementary materials included in this article.