

Abstract
Muscle, bone, and fat segmentation of CT thigh slice is essential for body composition research. Voxel-wise image segmentation enables quantification of tissue properties including area, intensity and texture. Deep learning approaches have had substantial success in medical image segmentation, but they typically require substantial data. Due to high cost of manual annotation, training deep learning models with limited human labelled data is desirable but also a challenging problem. Inspired by transfer learning, we proposed a two-stage deep learning pipeline to address this issue in thigh segmentation. We study 2836 slices from Baltimore Longitudinal Study of Aging (BLSA) and 121 slices from Genetic and Epigenetic Signatures of Translational Aging Laboratory Testing (GESTALT). First, we generated pseudo-labels based on approximate hand-crafted approaches using CT intensity and anatomical morphology. Then, those pseudo labels are fed into deep neural networks to train models from scratch. Finally, the first stage model is loaded as initialization and fine-tuned with a more limited set of expert human labels. We evaluate the performance of this framework on 56 thigh CT scans and obtained average Dice of 0.979,0.969,0.953,0.980 and 0.800 for five tissues: muscle, cortical bone, internal bone, subcutaneous fat and intermuscular fat respectively. We evaluated generalizability by manually reviewing external 3504 BLSA single thighs from 1752 thigh slices. The result is consistent and passed human review with 150 failed thigh images, which demonstrates that the proposed method has strong generalizability.
Keywords: thigh slice, intensity segmentation, pseudo label, fine-tune
1. INTRODUCTION
Estimating volumes and masses of total body components is important for the research, cancer, joint replacement and exercise physiology[1]. Full body CT scans can be used to calculate whole body composition directly. However, full body CT scan is also hard to acquire in medical context. Mourtzakis et al. proposed body components measured on abdomen or thigh slices are highly correlated with mass of whole-body tissues [2]. Thus, accurate segmentation of thigh slice can quantify tissue area properties to estimate body composition without requiring additional irradiation or examinations. The aim of this paper is to segment muscle, fat and bones shown in Figure 1 from 2D thigh CT slices.
Figure 1.

The left image represents low-dose single CT slice of middle thigh. The right represents the targeted tissue segmentation with corresponding legend that we need to extract from left slice. Each tissue has different spatial scale of the area. The intermuscular fat is the smallest component with the highest resolution texture features.
Some techniques have been proposed in the literature to address thigh segmentation on CT images. Senseney et al. proposed an automatic region growing method using morphology operation and threshold to extract bone, fat and muscle in CT images[3]. Tan et al. proposed to use a variational Bayesian Gaussian mixture model to cluster regions of interest including fat, marrow, muscle, bone and air on 3D CT scans[4]. Felinto et al. proposed to use Gaussian mixture modeling to cluster similar tissues and achieve pixel classification based on their relative position and finally achieving segmentation of intermuscular fat and muscles[5]. All those methods are traditional model-based methods depending on parameter choice. Recently, deep learning methods have obtained impressive performance in medical image segmentation without fine-tuning parameters when compared with traditional model-based method.
Even though deep learning methods have produced very good performance in segmentation mask, the cost of impressive performance is sufficient human annotation[6]. In medical imaging, human annotation needs professional knowledge and is very time-consuming and expensive. Many researchers use data augmentation including rotation, intensity shift, and scaling to artificially enhance the size and diversity of the training data without collecting and labelling new data[7]. Generative adversarial networks[8] also have been utilized to synthesize new labelled data for segmentation. Leveraging the power of unannotated data is another solution instead of directly applying data augmentation on labelling data. Chen et al. proposed to use self-supervised learning with image context restoration to achieve brain tumor segmentation with a limited dataset[9]. Instead of self-supervised learning, transfer learning is another way to train with limited label data. First, model is trained from scratch on a large-scale dataset with similar task. Then the model is fine-tuned with human annotated data. Tajbakhsh et al. showed that a fine-tuned network could outperform networks that were trained from scratch and show better robustness[10]. In this paper, we proposed a two stage deep learning framework. We use an approximate hand-crafted method to generate pseudo labels and train the model in the first stage. Then, the model from first stage is regarded as starting point and fine-tuned with human labelled data to achieve thigh segmentation.
2. MATERIAL AND METHODS
The aim of this study is to achieve thigh segmentation on low-dose CT slice with deep learning. To do this, we split a CT thigh slice into two single thigh images. Then, we perform an approximate hand-crafted pipeline to segment targeted tissue from thigh image and regard results as pseudo labels fed into deep neural network from scratch. Finally, the model is loaded as initialization and fine-tuned with limited human annotated data.
2.1. Preprocessing
The field of view of CT thigh slice includes the left thigh, right thigh, table, and phantom. First, we use threshold of −500 Hounsfield unit (HU) to binarize the input thigh slice. We use a square kernel 25 × 25 to erode binary image and create three independent eroded masks. Then, we choose the left thigh and right thigh according to area size (the area of table mask should be smaller compared with thigh mask) and center position (the center of left thigh mask and right thigh mask should be at approximate horizontal axis). After picking the eroded mask of two thighs, we dilate the chosen mask with same kernel size. Based on those two masks, we find the maximal bounding box for each thigh and crop original CT slice from 512 × 512 to 256 × 256 without changing pixel resolution of the whole CT slice. We keep the intensity range from original CT slice. Finally, we manually review all the thighs and exclude cropped thigh image including other tissue. We apply this preprocessing procedure to all CT slices.
2.2. Coarse segmentation
Each CT slice has specific intensity units for each tissue. We use a CT window of [−190, −30] HU for fat, [30,80] HU for muscle, and [1000,∞] HU for bones[11]. We proposed the following pipeline to extract five targeted tissues in coarse way by using CT intensity and morphology. After preprocessing, we have cropped thigh images instead of two thigh CT slices. We perform following procedures to create pseudo labels. (1)We create a binary image with a threshold 1000 HU to create cortical bone mask. (2) Internal bone is surrounded by cortical bone. Based on this property, we inverse result (1) and find internal bone. (3) We use threshold of 0 HU to binarize thigh image and create a muscle mask. (4) We fill the holes and remove bones using results from (1) and (2). (5)We subtract the muscle mask from result (4) to create intermuscular fat mask based on the assumption that intermuscular fat is within muscle. (6) We binarize the input image with threshold −500 HU. (7) We subtract result (4) from result (6) to create subcutaneous fat mask. The complete procedure, which creates a pseudo label mask is shown Figure 2. Five coarse approximate segmentation masks are fused before fed into deep neural network.
Figure 2.

The pipeline of intensity classifier is based on morphology and specific CT intensity unit. The whole pipeline includes three branches. The first one (showed in blue line) extracts cortical bone and internal bone based on threshold 1000 HU. The second one (showed in red line) extracts muscle and intermuscular fat based on threshold 0 HU. The third one (showed in black line) segments subcutaneous fat based on obtained muscle and threshold −500 HU.
2.3. Two stage training
Unet++[12] is an encoder-decoder network where the encoder and decoder are connected through a series of nested, dense skip connections. The nested skip connections can help to bridge the semantic gap between the feature maps of the encoder and decoder, which is helpful to segment fine-grain details of targeted tissue like intermuscular fat in our case. Thus, we use Unet++ as our backbone to inference segmentation result. Transfer learning refers to reusing a model developed for a task as the starting point for a model on a second task, which alleviates the challenge of limited training data. In first stage, we use approximate pseudo labels generated from Figure 2 pipeline to train Unet++ from scratch and choose best model according to performance on validation dataset. Then, the optimal model is loaded as initialization. We feed human expert labeled data to fine-tune model from first stage until the model converges. The whole pipeline is shown in Figure 3.
Figure 3.

The proposed hierarchical coarse-to-fine thigh segmentation including two stages: 1) Feeding pseudo labels generated by classifier into deep learning model and train the model from scratch. 2) Using the optimized model from previous stage as initialization, we fine labels. The coarse– and refined- model are end-to-end optimized separately.
The Unet[13] has obtained impressive results for performing medical image segmentation, which is widely used and can be considered as alternative architecture.
2.4. Data distribution
We use 2836 de-identified CT thigh slices from the BLSA dataset and 121 de-identified thigh slices from GESTALT dataset. All data were under Institute Review Board approval. The pixel resolution of BLSA and Gestalt is 0.976mm × 0.976mm and corresponding image size is 512 × 512. In the preprocessing and quality assurance stages, 7 images are discarded since they include other structures (e.g. the table). Note that for some thigh slices, only left thigh is manually labelled instead of both thighs. We divide labelled thigh slices into training, validation and testing cohort for second stage. No subject had images in both the training, and validation or testing sets.
2.5. Implementation details
Our experiments are implemented in Python 3.7 with PyTorch 1.7. The max-training-epoch is set to 200. The batch size is 8. We apply soft window of [−150, 100] HU to normalize each input image. In the first stage, the initial learning rate for U-net is 0.002 and 0.0002 for U-net++. In the fine-tune stage, the initial learning rate for both U-net and U-net ++ is 0.0001. The learning rate decayed to 0 linearly until end of training epoch in both training from scratch stage and fine-tune stage. The optimizer used in the training is stochastic gradient descent (SGD)
2.6. Metrics
To evaluate the accuracy of our proposed method, we compare the segmentation results against the ground truth provided by expert labels. To quantify the agreement between segmentation and truth, we use the Dice Similarity Coefficient (DSC) as the main evaluation measurement for inferenced result by comparing each binary tissue against the ground truth voxel-by-voxel:
where R represents the segmentation result generated by the deep learning model and T represents the corresponding ground-truth.
3. RESULTS
Figure 4 compares DSC of the muscle, cortical bone, inner bone, subcutaneous fat and intermuscular fat between Unet in stage 2 and Unet++ in stage 1 and stage 2 respectively. The boxplots presented are evaluated across 56 single thighs Overall, the performance of Unet++ in stage 2 is significantly better compared with Unet in stage 2 across all five targeted tissues marked with ‘*’ (Wilcoxon signed-rank test). Compared with U-Net, the Unet++ makes largest improvement in median DSC for cortical bone from 0.951 to 0.971. Unet++ increase median DSC from 0.786 to 0.799 for sparse and small intermuscular fat.
Figure 4.
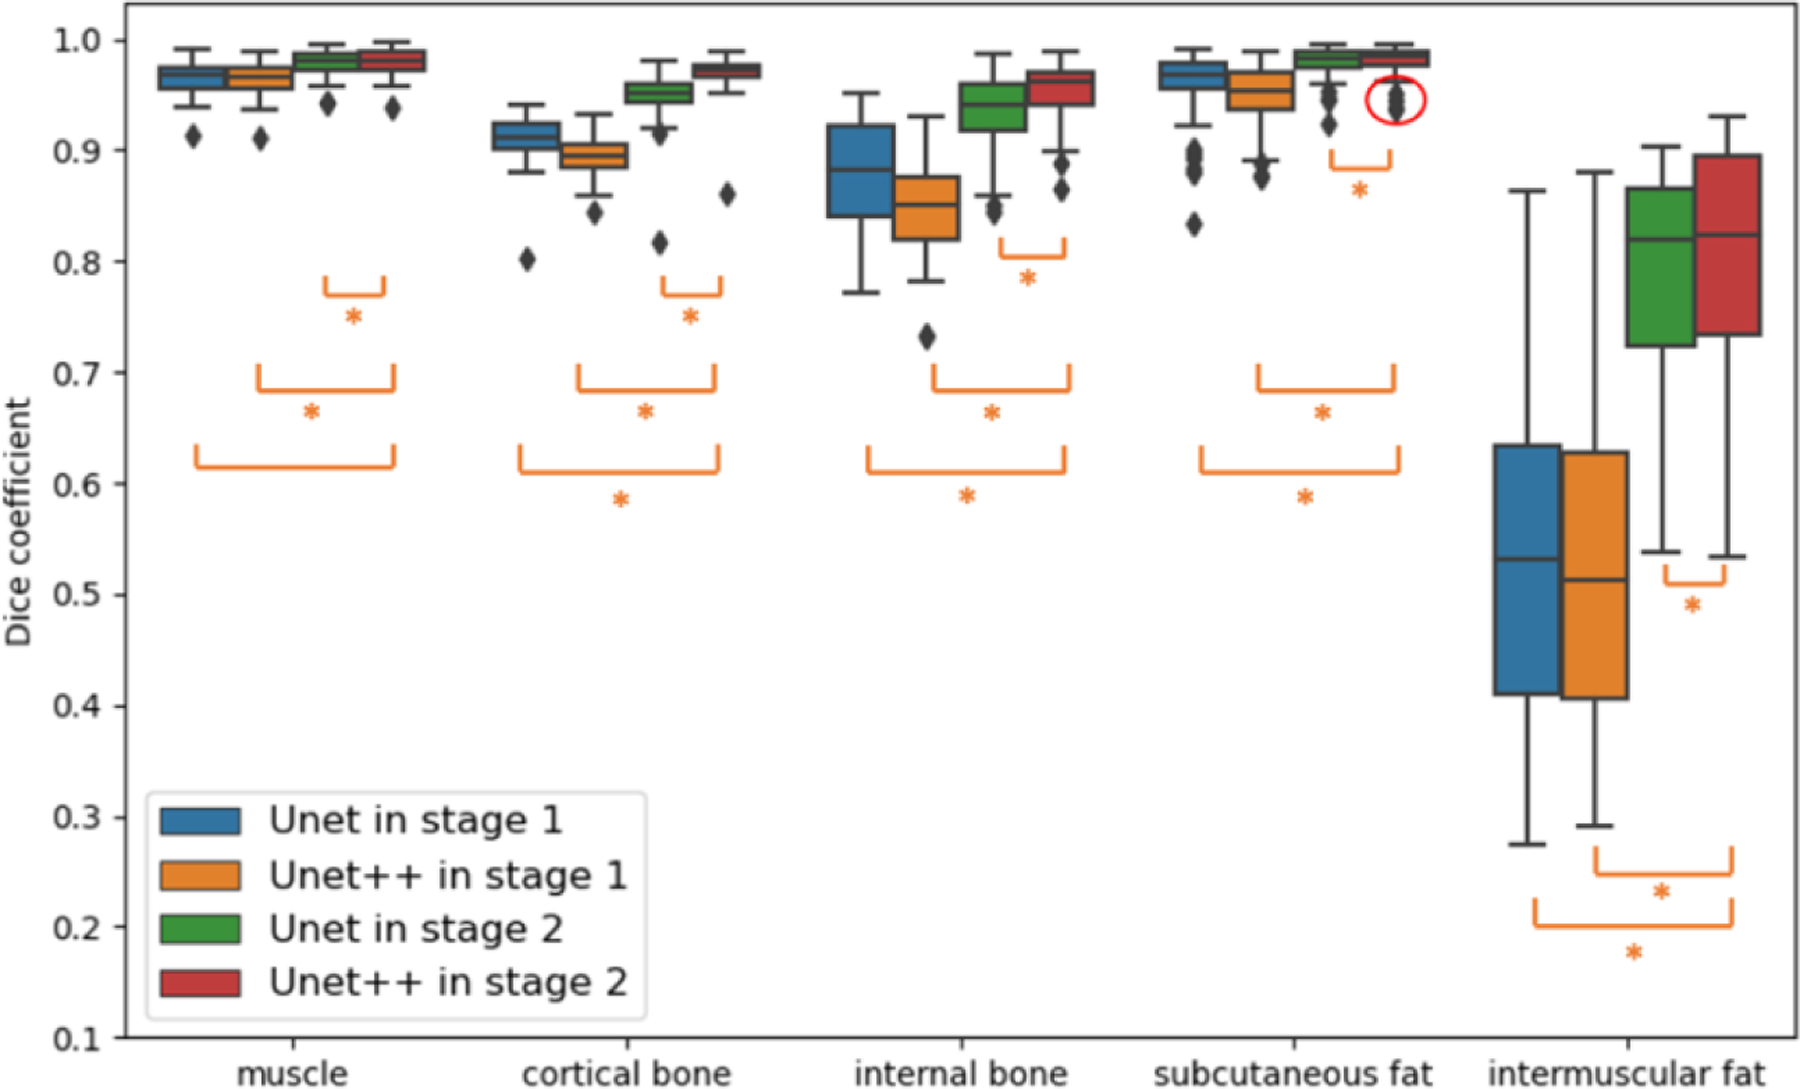
The fig shows the performance comparison among using Unet in stage 1, Unet in stage 2, Unet++ in stage 1 and Unet++ in stage 2 in box plots of five targeted tissue. The * indicates statistically significant (p < 0.01 from Wilcoxon signed-rank test)
Figure 5 compares the qualitative result inferenced by Unet in stage 1, Unet in stage 2, Unet++ in stage 1 and Unet++ in stage 2. Compared with Unet in stage 2, the Unet++ in stage 2 yields superior performance and segments more details of intermuscular fat.
Figure 5.

The plot shows qualitative representation of the thigh slice segmentation result with using Unet in stage 1, Unet in stage 2, Unet++ in stage 1, Unet++ in stage 2 and the ground truth. The three subjects are chosen based on large difference of DSC of intermuscular fat between Unet in stage 2 and Unet++ in stage 2. The yellow rectangle represents large difference across from those four methods and ground truth. The text below each image is intermuscular fat DSC.
Finally, we applied our pipeline on 3504 thigh images. We manually reviewed all those thigh slices to see the result of performance since we do not have ground-truth for those slices. If bad segmentations were located and regarded CT artifact as targeted tissue, the result is coded with no pass. The representation of no pass result is shown in Figure 6. The 150 single thigh images did not pass human review.
Figure 6.

The representative examples during human review. The first one is coded as no pass since intermuscular fat is in outside of the muscle. The second one is also regarded as no pass because the artifact is segmented as bones or intermuscular fat.
4. CONCLUSION AND DISCUSSION
Herein, we utilize a transfer learning strategy to achieve accurate and robust thigh tissue segmentation. The proposed framework can achieve accurate segmentation on thigh CT slice with limited human labels. Compared with Unet, Unet++ can recover more details, and effective in sparse and small tissue segmentation. However, as shown in Figure 7, one limitation of the proposed framework is that it is difficult for the fine-tune model to recognize intermuscular fat from subcutaneous fat around muscle boundary. We think lacking of 3D medical context might be the source of this problem.
Figure 7.

The above two images are outliers according to DSC from subcutaneous fat in Figure 4 (shown in red circle), The position marked by yellow rectangle is hard for model to classify subcutaneous fat from intermuscular fat.
Table 1.
The number of slices, thighs and labelled thighs for cohort in two stages
| Study Name | Cohort | Slices | All thighs | Labelled thighs |
|---|---|---|---|---|
| BLSA | First stage training | 1006 | 1003 L and 1002 R | 0 |
| BLSA & Gestalt | Second stage training | 117 | 117 L and 8 R | 125 |
| BLSA & Gestalt | Second stage validation | 26 | 26 L and 5 R | 31 |
| BLSA & Gestalt | Second stage testing | 56 | 49 L and 7 R | 56 |
| BLSA | External testing | 1752 | 1752 L and 1752 R | 0 |
5. ACKNOWLEDGEMENT
This research is supported by NSF CAREER 1452485 and the National Institutes of Health (NIH) under award numbers R01EB017230, R01EB006136, R01NS09529, T32EB001628, 5UL1TR002243–04, 1R01MH121620–01, and T32GM007347; by ViSE/VICTR VR3029; and by the National Center for Research Resources, Grant UL1RR024975–01, and is now at the National Center for Advancing Translational Sciences, Grant 2UL1TR000445–06. This project was also supported by the National Science Foundation under award numbers 1452485 and 2040462. This research was conducted with the support from the Intramural Research Program of the National Institute on Aging of the NIH. The content is solely the responsibility of the authors and does not necessarily represent the official views of the NIH. This study was in part using the resources of the Advanced Computing Center for Research and Education (ACCRE) at Vanderbilt University, Nashville, TN. The identified datasets used for the analysis described were obtained from the Research Derivative (RD), database of clinical and related data.
6 REFERENCE
- [1].Jeanson AL, Dupej J, Villa C, and Bržek J, “Body composition estimation from selected slices: equations computed from a new semi-automatic thresholding method developed on whole-body CT scans,” PeerJ, vol. 5, p. e3302, 2017. [DOI] [PMC free article] [PubMed] [Google Scholar]
- [2].Mourtzakis M, Prado CMM, Lieffers JR, Reiman T, McCargar LJ, and Baracos VE, “A practical and precise approach to quantification of body composition in cancer patients using computed tomography images acquired during routine care,” Appl. Physiol. Nutr. Metab, vol. 33, no. 5, pp. 997–1006, 2008. [DOI] [PubMed] [Google Scholar]
- [3].Senseney J, Hemler PF, and McAuliffe MJ, “Automated segmentation of computed tomography images,” in 2009 22nd IEEE International Symposium on Computer-Based Medical Systems, 2009, pp. 1–7. [Google Scholar]
- [4].Tan C et al. , “An automated and robust framework for quantification of muscle and fat in the thigh,” in 2014 22nd International Conference on Pattern Recognition, 2014, pp. 3173–3178. [Google Scholar]
- [5].de Carvalho Felinto J et al. , “Automatic segmentation and quantification of thigh tissues in CT images,” in Lecture Notes in Computer Science (including subseries Lecture Notes in Artificial Intelligence and Lecture Notes in Bioinformatics), 2018, vol. 10960 LNCS, pp. 261–276, doi: 10.1007/978-3-319-95162-1_18. [DOI] [Google Scholar]
- [6].Philbrick KA et al. , “RIL-contour: a medical imaging dataset annotation tool for and with deep learning,” J. Digit. Imaging, vol. 32, no. 4, pp. 571–581, 2019. [DOI] [PMC free article] [PubMed] [Google Scholar]
- [7].Shorten C and Khoshgoftaar TM, “A survey on image data augmentation for deep learning,” J. Big Data, vol. 6, no. 1, pp. 1–48, 2019. [DOI] [PMC free article] [PubMed] [Google Scholar]
- [8].Goodfellow I et al. , “Generative adversarial nets,” Adv. Neural Inf. Process. Syst, vol. 27, 2014. [Google Scholar]
- [9].Chen L, Bentley P, Mori K, Misawa K, Fujiwara M, and Rueckert D, “Self-supervised learning for medical image analysis using image context restoration,” Med. Image Anal, vol. 58, p. 101539, 2019. [DOI] [PMC free article] [PubMed] [Google Scholar]
- [10].Tajbakhsh N et al. , “Convolutional neural networks for medical image analysis: Full training or fine tuning?,” IEEE Trans. Med. Imaging, vol. 35, no. 5, pp. 1299–1312, 2016. [DOI] [PubMed] [Google Scholar]
- [11].Engelke K, Museyko O, Wang L, and Laredo JD, “Quantitative analysis of skeletal muscle by computed tomography imaging—State of the art,” Journal of Orthopaedic Translation, vol. 15. Elsevier (Singapore) Pte Ltd, pp. 91–103, Oct. 01, 2018, doi: 10.1016/j.jot.2018.10.004. [DOI] [PMC free article] [PubMed] [Google Scholar]
- [12].Zhou Z, Rahman Siddiquee MM, Tajbakhsh N, and Liang J, “Unet++: A nested u-net architecture for medical image segmentation,” in Lecture Notes in Computer Science (including subseries Lecture Notes in Artificial Intelligence and Lecture Notes in Bioinformatics), 2018, vol. 11045 LNCS, pp. 3–11, doi: 10.1007/978-3-030-00889-5_1. [DOI] [PMC free article] [PubMed] [Google Scholar]
- [13].A. and L. S. S. and B. T. and Çiçek Özgünand Abdulkadir RO, “3D U-Net: Learning Dense Volumetric Segmentation from Sparse Annotation,” in Medical Image Computing and Computer-Assisted Intervention – MICCAI 2016, 2016, pp. 424–432.