Abstract
Certain body composition phenotypes, like sarcopenia, are well established as predictive markers for post-surgery complications and overall survival of lung cancer patients. However, their association with incidental lung cancer risk in the screening population is still unclear. We study the feasibility of body composition analysis using chest low dose computed tomography (LDCT). A two-stage fully automatic pipeline is developed to assess the cross-sectional area of body composition components including subcutaneous adipose tissue (SAT), muscle, visceral adipose tissue (VAT), and bone on T5, T8 and T10 vertebral levels. The pipeline is developed using 61 cases of the VerSe’20 dataset, 40 annotated cases of NLST, and 851 inhouse screening cases. On a test cohort consisting of 30 cases from the inhouse screening cohort (age 55 - 73, 50% female) and 42 cases of NLST (age 55 - 75, 59.5% female), the pipeline achieves a root mean square error (RMSE) of 7.25 mm (95% CI: [6.61, 7.85]) for the vertebral level identification and mean Dice similarity score (DSC) 0.99 ± 0.02, 0.96 ± 0.03, and 0.95 ± 0.04 for SAT, muscle, and VAT, respectively for body composition segmentation. The pipeline is generalized to the CT arm of the NLST dataset (25,205 subjects, 40.8% female, 1,056 lung cancer incidences). Time-to-event analysis for lung cancer incidence indicates inverse association between measured muscle cross-sectional area and incidental lung cancer risks (p < 0.001 female, p < 0.001 male). In conclusion, automatic body composition analysis using routine lung screening LDCT is feasible.
Keywords: Body Composition Analysis, LDCT, Lung Cancer Screening, Lung Cancer Risk, Sarcopenia
1. INTRODUCTION
Body composition analysis, which characterizes the mass of muscle and adipose tissue, can provide valuable markers for clinical outcomes, including cardiovascular diseases, type 2 diabetes, and advanced lung diseases [1]-[3]. For lung cancer patients who have undergone lobectomy or lung transplant, abnormal body composition phenotypes such as low fat-free mass (FFM) and high fat mass (FM) or combined are significantly associated with high incidence rate of postoperative complications, long hospital length of stay, and worsen overall survival [4], [5]. In addition to its prognostic value for post-surgery outcome evaluation, extreme body composition conditions like sarcopenia are shown to have high baseline prevalence in lung cancer patients [6]. Moreover, recent studies have shown emphysema quantified on chest CT can serve as an independent risk factor for lung cancer incidence [12], [13], which suggests that certain gross body phenotypes can provide additional predictive information to the lung nodule risk evaluation [9]-[11]. These findings indicate the possibility of body composition as a potential biomarker for lung cancer risk stratification in screening population.
Although body mass index (BMI) is the most commonly used body composition assessment, studies have shown its insufficiency in obesity classification [12] and poor correlation with body muscle mass [13]. This suggests alternative assessment methods should be taken to provide accurate characterization of distinct body components. Several studies have evaluated the feasibility of body composition analyses based on a single cross-sectional image extracted from computed tomography (CT) or magnetic resonance imaging (MRI) volume at certain anatomical landmarks, such as T5, T12 or L3 vertebral bodies, and have demonstrated high correlation with whole body evaluation results in both abdominal and thoracic space [14]-[16]. Low dose computed tomography (LDCT) is the routine clinical practice in lung cancer screening, which makes it attractive as a source for body composition evaluation without any additional cost or radiation exposure. However, body composition analysis using screening chest LDCT is challenging due to known pitfalls [17]. Namely, the limitation of field-of-view (FoV) can cause tissue cropping which reduces the effectiveness of body composition assessment. Several works choose to measure regional tissues, i.e. pectorals or psoas for muscle evaluation, which are covered by the FoV of the images [18]-[20]. However, studies have pointed out that the regional tissue mass is less correlated with whole body analysis baseline compared to full tissue mass assessment [21]. In addition, breast implants and dense breast tissue in females are potentially confounding with body composition assessment, which will limit the generalizability to the target population if simply ignored [15].
As estimated in [22], generating manual annotation for body composition analysis can take on average 15 minutes per case for expert readers. Thus, automatic body composition pipeline is a necessity to facilitate application to high-volume contexts such as in the context of lung cancer screening as manual annotation is time intensive. Multiple studies have aimed to develop automatic body composition pipelines. [23] develops a UNet based segmentation model for pre-identified slices corresponding to the L3 from abdominal CT. In addition to the segmentation model, [24] introduces a slice selection model to make the pipeline fully automatic. Both studies achieve a mean Dice similarity score above 0.95 for both muscle and adipose tissue on the test dataset with manual segmentation. In the chest space, [20], [25] develop a fully automatic paraspinous muscle area measurement model at T12 level using 2084 exams of an older subgroup with age 70 years or older at enrollment from the CT arm of National Lung Screening Trail (NLST) and study the relationship between measured muscle area and overall survival. However, none of these studies address the task of full tissue body composition analysis using lung cancer screening LDCT.
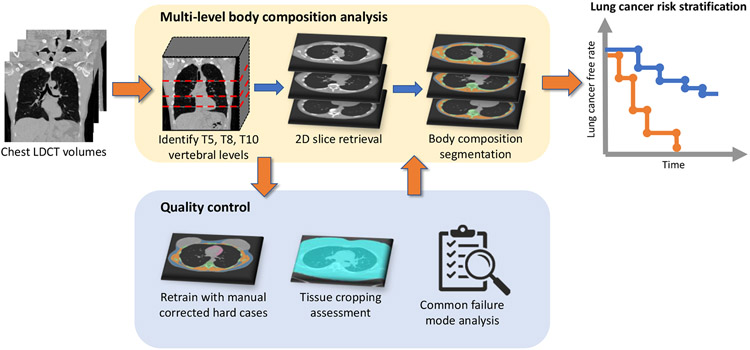
In this paper, we study the feasibility of body composition assessment using lung cancer screening LDCT with the target for incidental lung cancer risk stratification. We adapt the multilevel approach by [22] to reduce the variation for a single location and develop a two-stage pipeline for fully automatic multi-level body composition evaluation for chest LDCT. We identify the FoV caused body tissue cropping issues and develop a Tissue Cropping Index (TCI) based on body boundary analysis for automatic assessment of tissue cropping severity. The pipeline is iteratively refined by retraining with manually corrected difficult cases, including females with breast implants and dense breast tissues. To evaluate the application validity of the approach, we generalize the pipeline on the CT arm of the NLST. Cases under None or Mild tissue cropping levels are used to evaluate the association between measured muscle area and incidental lung cancer risks with time-to-event analysis. The general design of the study is shown in Figure 1.
Figure 1.
The multi-level body composition analysis pipeline takes 3D chest LDCT volume as input, identifies the 2D axial slices corresponding to T5, T8 and T10 vertebral levels, and segments cross-sectional region of each BC components on each level. For quality control, we design procedures to improve segmentation quality, assess tissue cropping and automatically identify failure cases. Time-to-event analysis on lung cancer incidence shows association between measured body composition components and lung cancer risks.
2. METHODS AND RESULTS
2.1. Dataset
Our inhouse study cohort is selected from the Vanderbilt Lung Screening Program (VLSP) [26]. 1,490 LDCT study sessions performed between 2013 and 2019 are collected from 881 de-identified subjects, with mean age 64.9 ± 5.6 years. The de-identified data usage is approved by the local institutional review board. To evaluate the model’s generalizability for population-scale lung cancer screening study, we include the CT arm of NLST as a second study cohort, which consists of 70,217 chest LDCT sessions from 25,205 subjects, with mean age 62.5 ± 5.1 years. The public VerSe’20 [27] dataset provides vertebral location and segmentation annotation for 374 CT scans with various FoV. We select 61 cases with full thorax in FoV for vertebral level identification module development. Since the imaging protocol of VerSe’20 data is clinical standard for bone evaluation, which is different from LDCT protocol in screening settings, we further select 40 cases from the NLST dataset and annotate the level of T5, T8 and T10 on each LDCT scan as the fine-tuning dataset.
To evaluate model performance, we build a test cohort consisting of 30 cases from the VLSP population, with mean age 63.9 ± 5.1 years, 50% female, and 42 cases from the NLST population, with mean age 62.1 ± 5.0 years, 59.5% female. The T5, T8 and T10 vertebral levels of each case are identified using the itk-SNAP software [28]. The body composition segmentation annotations are generated by manual correction of the model prediction using itk-SNAP.
2.2. Model development
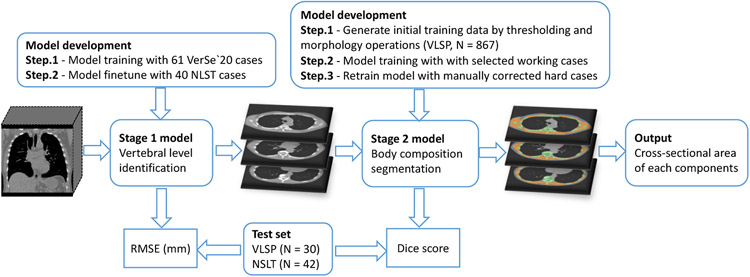
The proposed body composition analysis pipeline consists of two consecutive fully automatic stages, with a vertebral body level identification module to identify cross-sectional slices corresponding to T5, T8 and T10 vertebral levels and a 2D segmentation module for body composition measurement. The development procedure of the pipeline is summarized in Figure 2.
Figure 2.
Flowchart of the development of our two-stage multi-level body composition analysis pipeline.
2.2.1. Vertebral body level prediction
As the first stage of the pipeline, a 3D regression model with 3D ResNet-18 as backbone is developed to predict the axial slices corresponding to T5, T8 and T10 vertebral bodies. For data normalization, the input images are cropped using the 10% extended bounding box of the lung mask generated by pretrained model mentioned in [29], which is followed by an intensity window of [100, 600] Hounsfield Units (HU) to highlight the bone structure and reduce the noise introduced by other tissues. The processed images are resampled to 64 × 64 × 256 in three dimensions before sending into the model. 3D data augmentations, including random 3D translation up to 10% on each dimension and random 3D rotation up to 7 degrees, are employed to increase the generalization capability of the trained model.
The model is initially trained using the 61 VerSe’20 cases and fine-tuned with the 40 annotated NLST cases. In the initial training step, all 3D locations of the T2 to T10 vertebral body are used in the training process to help the model learn vertebral body location arrangement. While in the fine-tuning step, only the three output channels corresponding to the levels of T5, T8 and T10 are involved in the regression loss function based on the availability of the annotated information and application need.
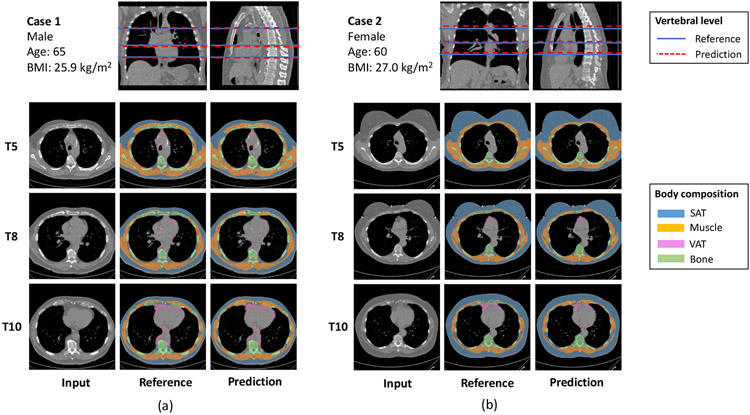
Typical outputs of the vertebral level identification model are shown in the top row of Figure 3. To quantitatively assess the accuracy of the model, we evaluate the difference between the predicted and ground truth T5, T8 and T10 levels on the testing cohort. The model achieves similar performance on two datasets, with RMSE 7.1 (95% CI: [6.0, 8.4]) mm and 7.3 (95% CI: [6.5, 8.2]) mm on the VLSP and NLST test cohort, respectively.
Figure 3.
Typical results of the proposed body composition analysis pipeline on test set. Vertebral level identification module achieves accuracy 7.25 mm (95% CI: [6.61, 7.85]) in RMSE. Body composition segmentation module achieves DSC 0.99 ± 0.02, 0.96 ± 0.03, and 0.95 ± 0.04 for SAT, muscle and VAT, respectively.
2.2.2. Cross-sectional body composition segmentation
Once the slices corresponding to T5, T8 and T10 are selected with the first stage model, body masks are identified and applied to each slice to remove ambient information like clothes and scan tables. The 2D images are resampled to 256 × 256 before passed to the model, which is followed by a Gaussian filter with standard deviation in length of 1 pixel to further normalize the input images. We use the UNet++ model as the segmentation model, as it outperformed the standard UNet in 2D medical image segmentation tasks and is well tested on LDCT images [30].
As model training require a sizable amount of annotated data and manual annotation is costly and time-intensive [22], [24], we use a human-in-the-loop strategy [31] to iteratively improve the quality of both the model and the training set to reduce the efforts for manual annotation. As the first step to generate body composition segmentation, we use the unsupervised thresholding based fuzzy c-means approach [32] to segment regions with intensity same as adipose tissue, muscle and bone. Then, the thoracic cavity is identified with a combination of thresholding and morphology operations based on fuzzy c-means output and lung mask. Using the thoracic cavity mask, we are able to separate the subcutaneous adipose tissue from thoracic visceral adipose tissue, and the skeletal muscle from other muscle tissue inside the thoracic cavity region. The outputs of the procedure are inspected, and working cases are selected to form the initial training set for the deep learning model. The training of the deep model consists of two passes. In the first pass, the model and segmentation labels are iteratively refined by retrain with inspected working cases. As the second pass, the model is retrained with the combination of inspected working cases and manually corrected hard cases.
Typical outputs are shown in the bottom row of Figure 3. Dice similarity scores (DSC) for each body composition component are calculated to quantitatively assess the agreement between model predicted and reference segmentation. The quantitative results are summarized in Table 1. The performance is consistent between two data sources and two sex groups. The performance on muscle decreased slightly from T5 to T10, which could be caused by the increasing presence of costal cartilage that misclassified as muscle due to similar intensity.
Table 1.
Performance of body composition segmentation on test data set in Dice similarity score (SD)
| SAT | Muscle | VAT | Bone | |
|---|---|---|---|---|
| Spinal level | ||||
| T5 | 0.994 (0.018) | 0.982 (0.016) | 0.903 (0.135) | 0.966 (0.024) |
| T8 | 0.994 (0.012) | 0.963 (0.025) | 0.937 (0.074) | 0.951 (0.034) |
| T10 | 0.991 (0.024) | 0.949 (0.032) | 0.966 (0.051) | 0.914 (0.048) |
| † Test dataset | ||||
| VLSP (N = 30) | 0.991 (0.027) | 0.951 (0.032) | 0.958 (0.107) | 0.924 (0.049) |
| NLST (N = 42) | 0.994 (0.010) | 0.974 (0.021) | 0.919 (0.086) | 0.957 (0.032) |
| † Sex | ||||
| Male (N = 32) | 0.989 (0.026) | 0.966 (0.029) | 0.951 (0.079) | 0.939 (0.046) |
| Female (N = 40) | 0.996 (0.008) | 0.964 (0.028) | 0.923 (0.108) | 0.947 (0.040) |
| † Overall (N = 72) | 0.993 (0.019) | 0.965 (0.029) | 0.943 (0.043) | 0.935 (0.097) |
Data are averaged across three spinal levels.
2.3. Quality control
In addition to the general QA procedure for chest CT as described in technical report [33], we take multiple measures to ensure the quality of the pipeline’s output can effectively support the downstream clinical tasks. During the pipeline development, we identify failure in the segmentation of cases within the previous iteration, then retrain the model with manually correct hard cases. The procedure has vastly improved the capability of the model to handle hard cases in the target cohort, especially in female subjects with breast implants or dense breast tissue.
FoV caused tissue cropping problems are common in lung screening LDCT images. Previous works either remove the cropping cases from the study population or measure regional tissue areas which are visible in the FoV. In this work, we take a quantitative approach to handle the problem by defining the Tissue Crop Index (TCI) to detect and further assess the severity of tissue cropping. Given a 2D slice extracted from LDCT volume, TCI is defined as the proportion of detected body boundaries that is overlapping with the boundary of FoV, with
| (1) |
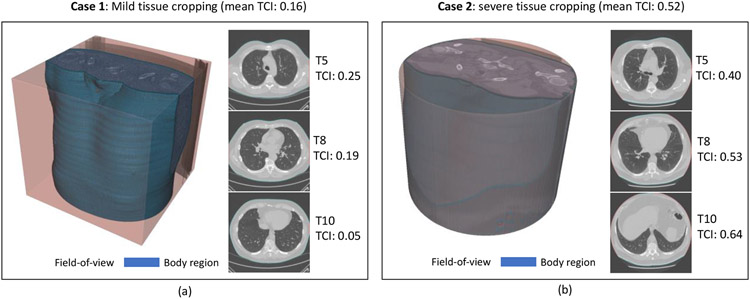
where Vbody and VFoV are the set of body boundary voxels and set of FoV boundary voxels, respectively, and ∣·∣ represent the number of elements in a set. The TCI of a LDCT session is defined as the averaged slice TCI across three vertebral levels. Empirically, we stratify each LDCT case into three tissue cropping severity levels: 1) No cropping, with TCI ≤ 0.05; 2) Mild cropping, with 0.05 < TCI ≤ 0.3; and 3) Severe cropping, with TCI > 0.3. Figure 4 demonstrates the effectiveness of this approach in differentiating typical Mild and Severe cropping cases. The tissue cropping statistics of the study cohort are summarized in Table 2. The difference between two screening datasets is significant, with 44.8% of the NLST sessions having severe tissue cropping compared to 8.9% in VLSP.
Figure 4.
Tissue cropping is a problem for body composition assessment as complete measurement of tissue of interests is not possible. (a) shows a mild cropping case with TCI as 0.16, and (b) shows a severe case with TCI as 0.52. The two cases demonstrate the effectiveness of TCI as a metric to detect and assess the severity of tissue cropping.
Table 2.
Tissue cropping assessment statistics on two datasets. Data are number of cases (%) for each group.
| Tissue cropping severity | |||
|---|---|---|---|
| Dataset | None (TCI ≤ 0.05) | Mild (0.05 < TCI ≤ 0.3) | Severe (TCI > 0.3) |
| VLSP | 455 (30.5%) | 902 (60.5%) | 133 (8.9%) |
| NLST | 2,831 (4.1%) | 35,689 (51.2%) | 31,222 (44.8%) |
To further evaluate the quality of body composition assessment results and effectively filter out failure cases in a population-scale study cohort like NLST, we design a semi-automatic quality assurance (QA) procedure based on identified common failure modes. Potential problem segmentations can be automatically detected and labeled for further manual inspection. This eliminates the necessity to evaluate each individual case, which is time intensive. On a randomly selected subset of 2,000 slices, the process reaches a sensitivity of 0.804 in terms of failure case identification, while only 3.78% segmentations in total get labeled by the process. For the labeled segmentations, we manually inspect each case to identify true failure cases. In total, 2.74% slices are identified as failed case by the semi-automatic QA process. LDCT sessions with all three slices passed the QA are considered valid for downstream clinical task.
2.4. Application to risk of lung cancer
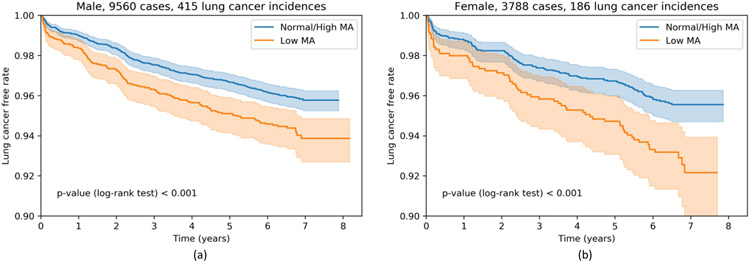
We hypothesize that the risk of developing lung cancer within the screening population is related to individual body composition. Our tissue segmentation pipeline allows us to examine the association between measured muscle area (MA) and lung cancer incidence rate in the NLST population. The study is performed under the framework of time-to-event analysis with the lung cancer diagnosis as incidence and the time to diagnosis for lung cancer case and follow-up time for lung cancer free case as duration. To ensure the effectiveness of the measurement, we only include those cases that passed our semi-automatic QA procedure and with None or Mild tissue cropping assessed by TCI, which consists of 9,560 male and 3,788 female subjects. Only the first available session of each subject is used as baseline body composition assessment. The population is stratified into Low MA group and Normal / High MA group with the 25% percentile as threshold for male and female separately. Figure 5 shows the Kaplan-Meier curves with confidence intervals of each group. Low MA groups are associated with higher incidental lung cancer risk with log-rank test derived p-value < 0.001 for both male and female population.
Figure 5.
Lung cancer risk of none or mild cropping cases stratified by measured muscle area (MA). Low MA is defined as MA less than 25th percentile of the group.
3. CONCLUSION
Herein, we study the feasibility of fully automatic body composition assessment with routine lung screening LDCT. To achieve this goal, a two-stage deep learning based body composition analysis pipeline is developed, by first identifying slices corresponding to T5, T8 and T10 vertebral levels, and then segmenting the body composition compartments on each 2D slice. The accuracy of the model is assessed using annotated data selected from both inhouse screening dataset and the NLST dataset. The prediction error of the first stage model is limited to half of the average thoracic vertebral height [34]. While the second stage achieves comparable accuracy to the state-of-the-art result of CT based body composition segmentation in literature [23], [24]. Several quality control procedures are taken to improve the assessment quality and identify failure cases. The tissue cropping problem is systematically evaluated by the automatically calculated Tissue Crop Index on the study cohort. The relationship between the measured body composition and incidental lung cancer risks is estimated with time-to-event analysis on lung cancer incidences, which reveals inverse association between the measured muscle area and the incidental lung cancer risk in both male and female population. In conclusion, the fully automatic body composition assessment with routine lung screening LDCT is feasible and can potentially add value to the early identification and treatment of lung cancer in clinical settings.
ACKNOWLEDGEMENT
This research was supported by NSF CAREER 1452485 and R01 EB017230. This study was supported in part by a UO1 CA196405 to Massion. This study was in part using the resources of the Advanced Computing Center for Research and Education (ACCRE) at Vanderbilt University, Nashville, TN. This project was supported in part by the National Center for Research Resources, Grant UL1 RR024975-01, and is now at the National Center for Advancing Translational Sciences, Grant 2 UL1 TR000445-06. The de-identified imaging dataset(s) used for the analysis described were obtained from ImageVU, a research resource supported by the VICTR CTSA award (ULTR000445 from NCATS/NIH), Vanderbilt University Medical Center institutional funding and Patient-Centered Outcomes Research Institute (PCORI; contract CDRN-1306-04869). This study was funded in part by the Martineau Innovation Fund Grant through the Vanderbilt-Ingram Cancer Center Thoracic Working Group and NCI Early Detection Research Network 2U01CA152662-06.
REFERENCES
- [1].Thibault R, Genton L, and Pichard C, “Body composition: Why, when and for who?,” Clin. Nutr, vol. 31, no. 4, pp. 435–447, 2012, doi: 10.1016/j.clnu.2011.12.011. [DOI] [PubMed] [Google Scholar]
- [2].Kenchaiah S et al. , “Pericardial Fat and the Risk of Heart Failure,” J. Am. Coll. Cardiol, vol. 77, no. 21, pp. 2638–2652, 2021, doi: 10.1016/j.jacc.2021.04.003. [DOI] [PMC free article] [PubMed] [Google Scholar]
- [3].Schols AMWJ, Broekhuizen R, Weling-Scheepers CA, and Wouters EF, “Body composition and mortality in chronic obstructive pulmonary disease,” Am. J. Clin. Nutr, vol. 82, no. 1, pp. 53–59, 2005, doi: 10.1093/ajcn/82.1.53. [DOI] [PubMed] [Google Scholar]
- [4].Prado CM et al. , “Prevalence and clinical implications of sarcopenic obesity in patients with solid tumours of the respiratory and gastrointestinal tracts: a population-based study,” Lancet Oncol., vol. 9, no. 7, pp. 629–635, 2008, doi: 10.1016/S1470-2045(08)70153-0. [DOI] [PubMed] [Google Scholar]
- [5].Kelm DJ et al. , “Pre-transplant wasting (as measured by muscle index) is a novel prognostic indicator in lung transplantation,” Clin. Transplant, vol. 30, no. 3, pp. 247–255, 2016, doi: 10.1111/ctr.12683. [DOI] [PubMed] [Google Scholar]
- [6].Yang M, Shen Y, Tan L, and Li W, “Prognostic Value of Sarcopenia in Lung Cancer: A Systematic Review and Meta-analysis,” Chest, vol. 156, no. 1, pp. 101–111, 2019, doi: 10.1016/j.chest.2019.04.115. [DOI] [PubMed] [Google Scholar]
- [7].Zulueta JJ, “Emphysema and lung cancer more than a coincidence,” Ann. Am. Thorac. Soc, vol. 12, no.8, pp. 1120–1121, 2015, doi: 10.1513/AnnalsATS.201506-360ED. [DOI] [PubMed] [Google Scholar]
- [8].Gagnat AA, Gjerdevik M, Gallefoss F, Coxson HO, Gulsvik A, and Bakke P, “Incidence of non-pulmonary cancer and lung cancer by amount of emphysema and airway wall thickness: A community-based cohort,” Eur. Respir. J, vol. 49, no. 5, 2017, doi: 10.1183/13993003.01162-2016. [DOI] [PubMed] [Google Scholar]
- [9].Gao R et al. , “Lung Cancer Risk Estimation with Incomplete Data: A Joint Missing Imputation Perspective,” Jul. 2021, [Online]. Available: http://arxiv.org/abs/2107.11882. [Google Scholar]
- [10].Gao R et al. , “Time-distanced gates in long short-term memory networks,” Med. Image Anal, vol. 65, p. 101785, Oct. 2020, doi: 10.1016/j.media.2020.101785. [DOI] [PMC free article] [PubMed] [Google Scholar]
- [11].Khawaja A et al. , “Do we need to see to believe?—radiomics for lung nodule classification and lung cancer risk stratification,” J. Thorac. Dis, vol. 12, no. 6, pp. 3303–3316, 2020, doi: 10.21037/jtd.2020.03.105. [DOI] [PMC free article] [PubMed] [Google Scholar]
- [12].Shah NR and Braverman ER, “Measuring adiposity in patients: The utility of body mass index (BMI), percent body fat, and leptin,” PLoS One, vol. 7, no. 4, 2012, doi: 10.1371/journal.pone.0033308. [DOI] [PMC free article] [PubMed] [Google Scholar]
- [13].Singer JP et al. , “Body composition and mortality after adult lung transplantation in the United States,” Am. J. Respir. Crit. Care Med, vol. 190, no. 9, pp. 1012–1021, 2014, doi: 10.1164/rccm.201405-0973OC. [DOI] [PMC free article] [PubMed] [Google Scholar]
- [14].Tong Y et al. , “Chest fat quantification via CT based on standardized anatomy space in adult lung transplant candidates,” PLoS One, vol. 12, no. 1, pp. 1–16, 2017, doi: 10.1371/journal.pone.0168932. [DOI] [PMC free article] [PubMed] [Google Scholar]
- [15].Mathur S, Rozenberg D, Verweel L, Orsso CE, and Singer LG, “Chest computed tomography is a valid measure of body composition in individuals with advanced lung disease,” Clin. Physiol. Funct. Imaging, vol. 40, no. 5, pp. 360–368, 2020, doi: 10.1111/cpf.12652. [DOI] [PubMed] [Google Scholar]
- [16].Shen W et al. , “Total body skeletal muscle and adipose tissue volumes: Estimation from a single abdominal cross-sectional image,” J. Appl. Physiol, vol. 97, no. 6, pp. 2333–2338, 2004, doi: 10.1152/japplphysiol.00744.2004. [DOI] [PubMed] [Google Scholar]
- [17].Troschel AS et al. , “Computed Tomography-based Body Composition Analysis and Its Role in Lung Cancer Care,” J. Thorac. Imaging, vol. 35, no. 2, pp. 91–100, 2020, doi: 10.1097/RTI.0000000000000428. [DOI] [PubMed] [Google Scholar]
- [18].Bak SH, Kwon SO, Han SS, and Kim WJ, “Computed tomography-derived area and density of pectoralis muscle associated disease severity and longitudinal changes in chronic obstructive pulmonary disease: A case control study,” Respir. Res, vol. 20, no. 1, pp. 1–12, 2019, doi: 10.1186/s12931-019-1191-y. [DOI] [PMC free article] [PubMed] [Google Scholar]
- [19].McDonald MLN et al. , “Chest computed tomography-derived low fat-free mass index and mortality in COPD,” Eur. Respir. J, vol. 50, no. 6, pp. 1–10, 2017, doi: 10.1183/13993003.01134-2017. [DOI] [PMC free article] [PubMed] [Google Scholar]
- [20].Lenchik L et al. , “Automated Muscle Measurement on Chest CT Predicts All-Cause Mortality in Older Adults From the National Lung Screening Trial,” J. Gerontol. A. Biol. Sci. Med. Sci, vol. 76, no. 2, pp. 277–285, 2021, doi: 10.1093/gerona/glaa141. [DOI] [PMC free article] [PubMed] [Google Scholar]
- [21].Kim EY et al. , “Evaluation of sarcopenia in small-cell lung cancer patients by routine chest CT,” Support. Care Cancer, vol. 24, no. 11, pp. 4721–4726, 2016, doi: 10.1007/s00520-016-3321-0. [DOI] [PubMed] [Google Scholar]
- [22].Best TD et al. , “Multilevel Body Composition Analysis on Chest Computed Tomography Predicts Hospital Length of Stay and Complications After Lobectomy for Lung Cancer,” Ann. Surg, vol. Publish Ah, no. Xx, 2020, doi: 10.1097/sla.0000000000004040. [DOI] [PubMed] [Google Scholar]
- [23].Weston AD et al. , “Automated Abdominal Segmentation of CT Scans for Body Composition Analysis Using Deep Learning,” Radiology, vol. 290, no. 3, pp. 669–679, 2019, doi: 10.1148/radiol.2018181432. [DOI] [PubMed] [Google Scholar]
- [24].Bridge CP et al. , “Fully-automated analysis of body composition from CT in cancer patients using convolutional neural networks,” Lect. Notes Comput. Sci. (including Subser. Lect. Notes Artif. Intell. Lect. Notes Bioinformatics), vol. 11041 LNCS, pp. 204–213, 2018, doi: 10.1007/978-3-030-01201-4_22. [DOI] [Google Scholar]
- [25].Barnard R et al. , “Machine Learning for Automatic Paraspinous Muscle Area and Attenuation Measures on Low-Dose Chest CT Scans,” Acad. Radiol, vol. 26, no. 12, pp. 1686–1694, Dec. 2019, doi: 10.1016/j.acra.2019.06.017. [DOI] [PMC free article] [PubMed] [Google Scholar]
- [26].“Vanderbilt Lung Screening Program.” .
- [27].Sekuboyina A et al. , “VerSe: A Vertebrae Labelling and Segmentation Benchmark for Multi-detector CT Images,” 2020, [Online]. Available: http://arxiv.org/abs/2001.09193. [DOI] [PubMed] [Google Scholar]
- [28].Yushkevich PA et al. , “User-guided 3D active contour segmentation of anatomical structures: Significantly improved efficiency and reliability,” Neuroimage, vol. 31, no. 3, pp. 1116–1128, 2006, doi: 10.1016/j.neuroimage.2006.01.015. [DOI] [PubMed] [Google Scholar]
- [29].Hofmanninger J, Prayer F, Pan J, Röhrich S, Prosch H, and Langs G, “Automatic lung segmentation in routine imaging is primarily a data diversity problem, not a methodology problem,” Eur. Radiol. Exp, vol. 4, no. 1, p. 50, Dec. 2020, doi: 10.1186/s41747-020-00173-2. [DOI] [PMC free article] [PubMed] [Google Scholar]
- [30].Zhou Z, Rahman Siddiquee MM, Tajbakhsh N, and Liang J, “Unet++: A nested u-net architecture for medical image segmentation,” in Lecture Notes in Computer Science (including subseries Lecture Notes in Artificial Intelligence and Lecture Notes in Bioinformatics), 2018, vol. 11045 LNCS, pp. 3–11, doi: 10.1007/978-3-030-00889-5_1. [DOI] [PMC free article] [PubMed] [Google Scholar]
- [31].Budd S, Robinson EC, and Kainz B, “A Survey on Active Learning and Human-in-the-Loop Deep Learning for Medical Image Analysis,” 2019, [Online]. Available: http://arxiv.org/abs/1910.02923. [DOI] [PubMed] [Google Scholar]
- [32].Chuang KS, Tzeng HL, Chen S, Wu J, and Chen TJ, “Fuzzy c-means clustering with spatial information for image segmentation,” Comput. Med. Imaging Graph, vol. 30, no. 1, pp. 9–15, 2006, doi: 10.1016/j.compmedimag.2005.10.001. [DOI] [PubMed] [Google Scholar]
- [33].Gao R et al. , “Technical Report: Quality Assessment Tool for Machine Learning with Clinical CT,” pp. 1–18, Jul. 2021, [Online]. Available: http://arxiv.org/abs/2107.12842. [Google Scholar]
- [34].Kunkel ME, Herkommer A, Reinehr M, Böckers TM, and Wilke HJ, “Morphometric analysis of the relationships between intervertebral disc and vertebral body heights: An anatomical and radiographic study of the human thoracic spine,” J. Anat, vol. 219, no. 3, pp. 375–387, 2011, doi: 10.1111/j.1469-7580.2011.01397.x. [DOI] [PMC free article] [PubMed] [Google Scholar]


