

Churchill and Nodal signaling, which participate in vertebrates’ germ layer induction, position a domain of Delta/Notch activity, which refines germ layer boundaries during frog gastrulation.
Abstract
In vertebrates, Nodal signaling plays a major role in endomesoderm induction, but germ layer delimitation is poorly understood. In avian embryos, the neural/mesoderm boundary is controlled by the transcription factor CHURCHILL1, presumably through the repressor ZEB2, but there is scarce knowledge about its role in other vertebrates. During amphibian gastrulation, Delta/Notch signaling refines germ layer boundaries in the marginal zone, but it is unknown the place this pathway occupies in the network comprising Churchill1 and Nodal. Here, we show that Xenopus churchill1 is expressed in the presumptive neuroectoderm at mid-blastula transition and during gastrulation, upregulates zeb2, prevents dll1 expression in the neuroectoderm, and favors neuroectoderm over endomesoderm development. Nodal signaling prevents dll1 expression in the endoderm but induces it in the presumptive mesoderm, from where it activates Notch1 and its target gene hes4 in the non-involuting marginal zone. We propose a model where Nodal and Churchill1 position Dll1/Notch1/Hes4 domains in the marginal zone, ensuring the delimitation between mesoderm and neuroectoderm.
Graphical Abstract

Introduction
Forming the three germ layers (ectoderm, mesoderm, and endoderm), which give rise to all body tissues, is one of the first steps in diversifying pluripotent cells in vertebrates (Gilbert, 2014). They segregate during gastrulation, which drives endomesoderm internalization through morphogenetic movements typical for each organism (Keller et al, 2003; Stower & Bertocchini, 2017).
Xenopus has historically provided essential knowledge about vertebrates germ layer development. Their pre-gastrula arrangement in this amphibian model can be predicted along the egg’s Animal-Vegetal (An-Veg) axis. The ectoderm and sub-blastoporal endoderm derive from the animal and vegetal hemispheres, respectively. The equatorial region or marginal zone (MZ) mainly gives rise to mesoderm but also significantly contributes to ectoderm and supra-blastoporal endoderm derivatives (Dale & Slack, 1987; Moody, 1987). In the early gastrula, the MZ consists of two concentrically arranged rings surrounding the blastopore. The involuting MZ (IMZ) animally surrounds the blastopore and contains endomesoderm precursors being internalized (Keller & Danilchik, 1988; Shook et al, 2004). The non-involuting MZ (NIMZ), composed of presumptive ectodermal cells, animally surrounds the IMZ. It progressively converges and extends, occupying the space left on the surface by the IMZ because of its internalization, ultimately forming the blastopore margin at the end of gastrulation (Keller & Danilchik, 1988). Thus, the MZ is a transition area between germ layers, where their boundaries need to be defined for a correct allocation of mesodermal, endodermal, and ectodermal cells during gastrulation. While germ layer induction and specification were thoroughly studied in Xenopus (Kiecker et al, 2016; Charney et al, 2017b), how their boundaries are established and refined during their segregation is poorly understood.
In vertebrates, Nodal members of the TGFβ superfamily of secreted proteins represent the major endomesoderm inducers (Kiecker et al, 2016). TGFβs signal through type I and II receptors, which behave as serine/threonine kinases. Upon ligand binding, the type II receptor activates the type I receptor through phosphorylation. The latter phosphorylates R-Smad proteins (Smad2 and 3 in the Nodal pathway), which in turn, bind Smad4. Upon nuclear translocation, the complex interacts with DNA-specific binding proteins (like FoxH1 in the Nodal pathway), recruiting context-dependent co-activators or co-repressors to regulate transcription (Hill, 2001; Weiss & Attisano, 2013). In Xenopus, genes encoding Nodal1/2-6 are activated during two sequential waves of initial zygotic transcription (Takahashi et al, 2000; Collart et al, 2014). At the 256-cell stage, maternal VegT (present from oogenesis in the vegetal hemisphere) triggers nodal5/6 transcription in the presumptive endoderm, which is dorsally enhanced by β-Catenin activity (Zhang & King, 1996; Takahashi et al, 2000; Skirkanich et al, 2011). An autoregulatory loop then reinforces nodal5/6 activity (Skirkanich et al, 2011), which induces nodal1/2/4 in the presumptive mesoderm (Takahashi et al, 2000). The transiently stronger Nodal cascade on the dorsal side contributes to inducing the gastrula organizer (GO) (Joseph & Melton, 1997; Agius et al, 2000; Takahashi et al, 2000; Schohl & Fagotto, 2002; Steiner et al, 2006; Zamparini et al, 2006; Kiecker et al, 2016; Reid et al, 2016). Nodal1/2-6 proteins are necessary for entire endomesoderm specification and patterning (Kiecker et al, 2016). Knockdown studies suggested that nodal5/6 are dedicated to the endomesoderm program, whereas nodal1/2 mainly control effectors of gastrulation movements, with a minor role in endomesoderm specification (Luxardi et al, 2010).
FGFs contribute to mesodermal induction and patterning in the early Xenopus embryo. Rather than true inducers, they are considered competence factors which allow mesodermal induction in response to TGFβ signaling (Kiecker et al, 2016) and also are required for neural induction by BMP antagonists (Stern, 2005). In avian embryos, FGF activity initially is involved in mesoderm induction but later promotes neural induction through the slow, indirect transcriptional activation of CHURCHILL1 (CHURC1), which encodes a zinc finger transcriptional activator (Sheng et al, 2003). At the onset of chick gastrulation, CHURC1 already is expressed in presumptive neural cells, preventing the activation of key mesodermal genes (such as TBXT and TBX6) and blocking cell ingression through the primitive streak by activating ZEB2 (zinc finger E-box binding homeobox 2; previously known as SIP1), which encodes a homeodomain/zinc finger transcriptional repressor. CHURC1 was proposed to control fate decision between neural and paraxial mesoderm, favoring neural development because cells that remain in the epiblast can receive neuralizing signals from the chicken GO (Sheng et al, 2003).
churc1 is conserved in Xenopus (Sheng et al, 2003), but its spatial expression pattern during germ layer induction, specification, and segregation has not been described. RT-PCR assays revealed the presence of churc1 transcripts at mid-gastrula (NF11.5), when it is positively regulated by the transcription factor Pou5f3.1 (formerly known as Pou91), which controls tissue competence during the transition from mesodermal to neural induction (Snir et al, 2006). In Xenopus animal caps, the induction of the pan-mesodermal marker tbxt by eFGF was blocked by churc1 overexpression or churc1VP16 mRNA (which encodes a chimeric Xenopus Churc1 protein fused to the VP16 transcriptional activating domain) but not by the dominant negative construct churc1EnR (encoding a chimeric Xenopus Churc1 protein fused to the Engrailed transcriptional repressor domain). In whole embryos, tbxt expression was suppressed from the IMZ by churc1VP16 but not by churc1EnR. These results indicated that Churc1 behaves as a transcriptional activator and that the mechanism limiting avian mesoderm specification involving Churc1 is conserved in Xenopus (Sheng et al, 2003). However, markers of the other germ layers were not analyzed in frog embryos, and it was unclear if churc1EnR could actually up-regulate tbxt, which would more strongly support the hypothesis that normally, churc1 restricts tbxt expression. Therefore, additional experiments, including a knockdown approach, were required in Xenopus to demonstrate this hypothesis. Moreover, it was not studied before if churc1 regulates zeb2 expression in Xenopus.
Notch signaling is typically initiated by interactions between neighboring cells, where the sending cell presents a transmembrane ligand belonging to the Delta and Jagged family (Dll/Jag). Once the ligand interacts with the transmembrane receptor Notch in the receiving cell, successive enzymatic cleavages release the Notch intracellular domain (NICD). Upon nuclear translocation, NICD forms a complex with the sequence-specific DNA-binding protein RBPJ, which recruits co-activators and activates Notch target genes (Bray, 2016). We have previously proposed that Dll1/Notch1 signaling is involved in neuroectoderm segregation from endomesoderm by refining germ layer boundaries in the MZ during gastrulation. Pre-involuted mesodermal cells of the IMZ present the Dll1 ligand to their neighbors on the other side of the limit of involution, thus preventing them to adopt the same fate (mesoderm). This is achieved by triggering the Notch pathway, which promotes neuroectoderm over mesoderm specification in the receiving cells, thus refining the limit of involution (Revinski et al, 2010).
Many genes of the HES1-7 group encoding bHLH-Orange transcriptional repressors are typical targets of the Notch/RBPJ pathway (Davis & Turner, 2001; Zhou et al, 2012). Amongst them, hes4 is a good candidate for controlling the limit of involution position for several reasons (López, 2022). During gastrulation, hes4 is expressed in scattered cells as a continuous ring throughout the NIMZ, complementing the pan-mesodermal marker tbxt (Aguirre et al, 2013). hes4 overexpression repressed tbxt and blocked MZ cells involution (López et al, 2005). Upon hes4 knockdown, the tbxt domain invaded the NIMZ territory, indicating that hes4 controls the ectoderm/mesoderm boundary (Aguirre et al, 2013). Notch signaling is necessary and sufficient to activate hes4 in different contexts in Xenopus (Glavic et al, 2004; López et al, 2005; Vega-López et al, 2015). Moreover, there is evidence that the hes4 genomic locus has direct Notch/RBPJ responsiveness (Davis et al, 2001; Sakano et al, 2010). We have previously shown that the most conspicuous expression of hes4 in the NIMZ is found in the dorsal-most part, marking prospective floor plate precursors in the GO region. Within this population, a bipotential switch controlled by dll1/notch1 activates hes4, promoting floor plate over notochord fates (López et al, 2005). However, it was not addressed before if hes4 is regulated by notch1/dll1 throughout the remainder of the NIMZ, outside the GO.
Notably, the Notch pathway was not included in the last gene network proposed for endomesoderm formation in Xenopus (Charney et al, 2017b), despite the abundant evidence about its participation in germ layer development in bilaterians (Favarolo & López, 2018). Strikingly, Delta/Notch is a key signaling pathway for mesoderm or endoderm induction and specification in invertebrates. However, in vertebrates, Nodal signaling appears as the main player in endomesoderm induction, whereas Delta/Notch signaling rather seems to refine the limits between germ layers (Favarolo & López, 2018). Therefore, it was necessary to understand where the Delta/Notch pathway is placed in the gene network controlling germ layer development in vertebrates.
Given the importance of Nodal signaling in endomesoderm induction in vertebrates, CHURC1’s role in setting boundaries between endomesoderm and neuroectoderm in avian embryos, and the previous evidence that Dll1/Notch1 refines germ layer delimitation in vertebrates, we employed the Xenopus model to study if the Dll1/Notch pathway is controlled by churc1 and Nodal signaling. To address this, we first analyzed the spatial expression pattern of churc1 transcripts in Xenopus, which was previously unknown, showing their early presence in presumptive neural territories. We then performed a more detailed analysis of churc1 role on germ layer development in this model and found that it is necessary to restrict endomesodermal fates and for neural development and zeb2 expression. We then confirmed that Dll1/Notch1 signaling controls the position of the hes4 domain throughout the NIMZ and found that Nodal signaling prevents dll1 expression in the endoderm but induces it in the presumptive mesoderm, from where it activates Notch1 and hes4 in the NIMZ. We propose a model where Nodal and Churchill1 position Dll1/Notch1/Hes4 domains in the MZ, ensuring the delimitation between mesoderm and neuroectoderm.
Results
Early expression pattern of churc1
Since the spatial expression pattern of churc1 in Xenopus was not previously described, we performed in situ hybridization (ISH) from mid-blastula to early neurula stages. At NF8, expression was restricted to one-half of the animal hemisphere (Fig 1A), persisting there at late blastula (Fig 1B, B’, and D), when chordin.1 (chrd.1), which encodes a BMP antagonist and neural inducer, is readily expressed at the BCNE center (Kuroda et al, 2004; Castro Colabianchi et al, 2021) (Fig 1C). The BCNE comprises animal and marginal cells at the blastula’s dorsal region and contains precursors of the GO, forebrain, and most of the midbrain and hindbrain (Kuroda et al, 2004). At the onset of gastrulation, churc1 transcripts are distributed like sox2 mRNA (yellow asterisk, Fig 1E, E’, and G), which encodes an HMG-box transcription factor of the SoxB1 family, expressed by immature, undifferentiated neuroectodermal progenitors, revealing their commitment to a neural plate fate (Stern, 2006; Rogers et al, 2008). churc1 and sox2 transcripts are absent from the GO (red asterisks, Fig 1E and G), where chrd.1 expression persists (green asterisk, Fig 1F), whereas the transient expression of this neural inducer in brain precursors previously found at the BCNE disappeared by this stage (Kuroda et al, 2004) (compare Fig 1C and F). churc1 and sox2 transcripts share a similar distribution until the last stage analyzed (neural plate) (Fig 1H–P). In conclusion, churc1 expression begins in the presumptive neuroectoderm before the appearance of overt signs of neural induction and later persists in the developing neuroectoderm.
Figure 1. churc1 mRNA distribution in Xenopus laevis embryos.

(A, B, B’, D, E, E’, H, I, I’, L, L’, M, M’, N, N’, O, O’) Expression of churc1 mRNA from mid-blastula to early neurula. (C) Expression of chrd.1 mRNA at late blastula. (F) Expression of chrd.1 mRNA at early gastrula. (G, J, K, N, P) Expression of sox2 mRNA from early gastrula to early neurula. (A) Mid-blastula, animal view. (B, B’, C, D) Late blastula embryos, shown in animal view (B), dorsal view (B’, C), or bisected along the mid–sagittal plane (D). The inset in (D) shows the same embryo in animal view before being bisected. (E, E’, F, G) Early gastrula embryos in posterior (E, F, G) and lateral views (E’). (H, I, I’ J, K) Mid-gastrula embryos in posterior (H, J, K), lateral (I), and dorsal views (I’). (L, L’, M, M’, N) Late gastrula embryos in dorsal (L, M, N) and lateral views (L’, M’). (N, N’, O, O’, P) Embryos at the neural plate stage, shown in dorsal (N, O, P), lateral (N’), or anterior views (O’). All embryos were processed for in situ hybridization and photographed in PBS, except in (A, B, B’, D), which were photographed in 50% glycerol/PBS for better transparency. All images are from albino embryos, except (I, I’), which correspond to a bleached, wild-type embryo. The dotted line in (E, F, G) demarcates the dorsal blastopore lip. An, animal; Veg, vegetal; A, anterior; P, posterior; D, dorsal; V, ventral; BCNE, Blastula- Chordin- and Noggin-expressing center; GO, gastrula organizer; np, developing neural plate. NF, stages according to Nieuwkoop and Faber (1994). Yellow asterisks mark churc1 and sox2 expression in the presumptive neural plate. Red asterisks mark absence of churc1 and sox2 transcripts from the GO. The green asterisk marks chrd.1 expression in the GO. Scale bars: 0.2 mm.
Churc1 disfavors IMZ lineages and is required for neural specification
A previous study of churc1 role during Xenopus embryogenesis was limited to testing the effects of the activator Churc1VP16 and the repressor Churc1EnR constructs on the pan-mesoderm marker tbxt at gastrula stage (Sheng et al, 2003), but other germ layers were not analyzed. Moreover, knockdown experiments were not performed to validate churc1 role in Xenopus germ layer development. We addressed these issues by unilaterally injecting embryos at the four-cell stage with the Xenopus churc1EnR and churc1VP16 mRNAs previously employed by Sheng et al (2003), churc1 mRNA, and a morpholino oligonucleotide designed to inhibit churc1 translation (churc1 MO) (this study). At gastrula stage, we examined the expression of the following markers: sox2 (neuroectoderm) (Piccolo et al, 1997; Rogers et al, 2008), sox17a (endoderm) (Hudson et al, 1997), and tbxt (pan-mesoderm) (Smith et al, 1991).
Churc1EnR noticeably suppressed sox2 expression (Fig 2A, K, and K’), whereas the suprablastoporal endoderm and the involuting mesoderm were noticeably expanded, as revealed by sox17a (Fig 2B, L, and L’) and tbxt (Fig 2C, M, and M’), respectively. These changes were statistically significant in comparison to embryos unilaterally injected with nuc-lacZ mRNA, which essentially did not affect sox2 (Figs 2K and K’ and S1A), sox17a (Figs 2L and L’ and S1B), or tbxt (Figs 2M and M’ and S1C). Knockdown with churc1 MO produced similar results on the expression of germ layer markers to those obtained with churc1EnR (Fig 3E–G and R). Interestingly, since the MO effects were milder, rather than the complete suppression of sox2 obtained with churc1EnR, we could appreciate a reduction of the sox2 domain on the churc1 MO-injected side (Fig 3E, E’, and R), whereas the sox17a and tbxt domains were complementary expanded over the neuroectoderm (Fig 3F–G’ and R). This animal shift of the neuroectoderm/endomesoderm boundary was significant in comparison to control MO unilateral injections, which essentially did not affect sox2, sox17a or tbxt on the injected side (Fig 3A–C’ and R) and was significantly rescued by co-injection of 1 ng of churc1 mRNA (Fig 3I–K’ and R), confirming that the effects of churc1 MO were specific. Since either churc1EnR mRNA or churc1 MO expanded the endomesoderm, the great majority (84%) or all the embryos (100%) injected with 0.5 or 1 ng of churc1EnR mRNA, respectively, and the great majority (77%) of embryos injected with churc1 MO showed a significant decrease of the sox2 domain, our results suggest that churc1 normally inhibits endomesoderm and is required for neuroectoderm development.
Figure 2. Effects of Xenopus churc1 repressor and activator constructs on germ layer specification and dll1 expression during gastrulation.
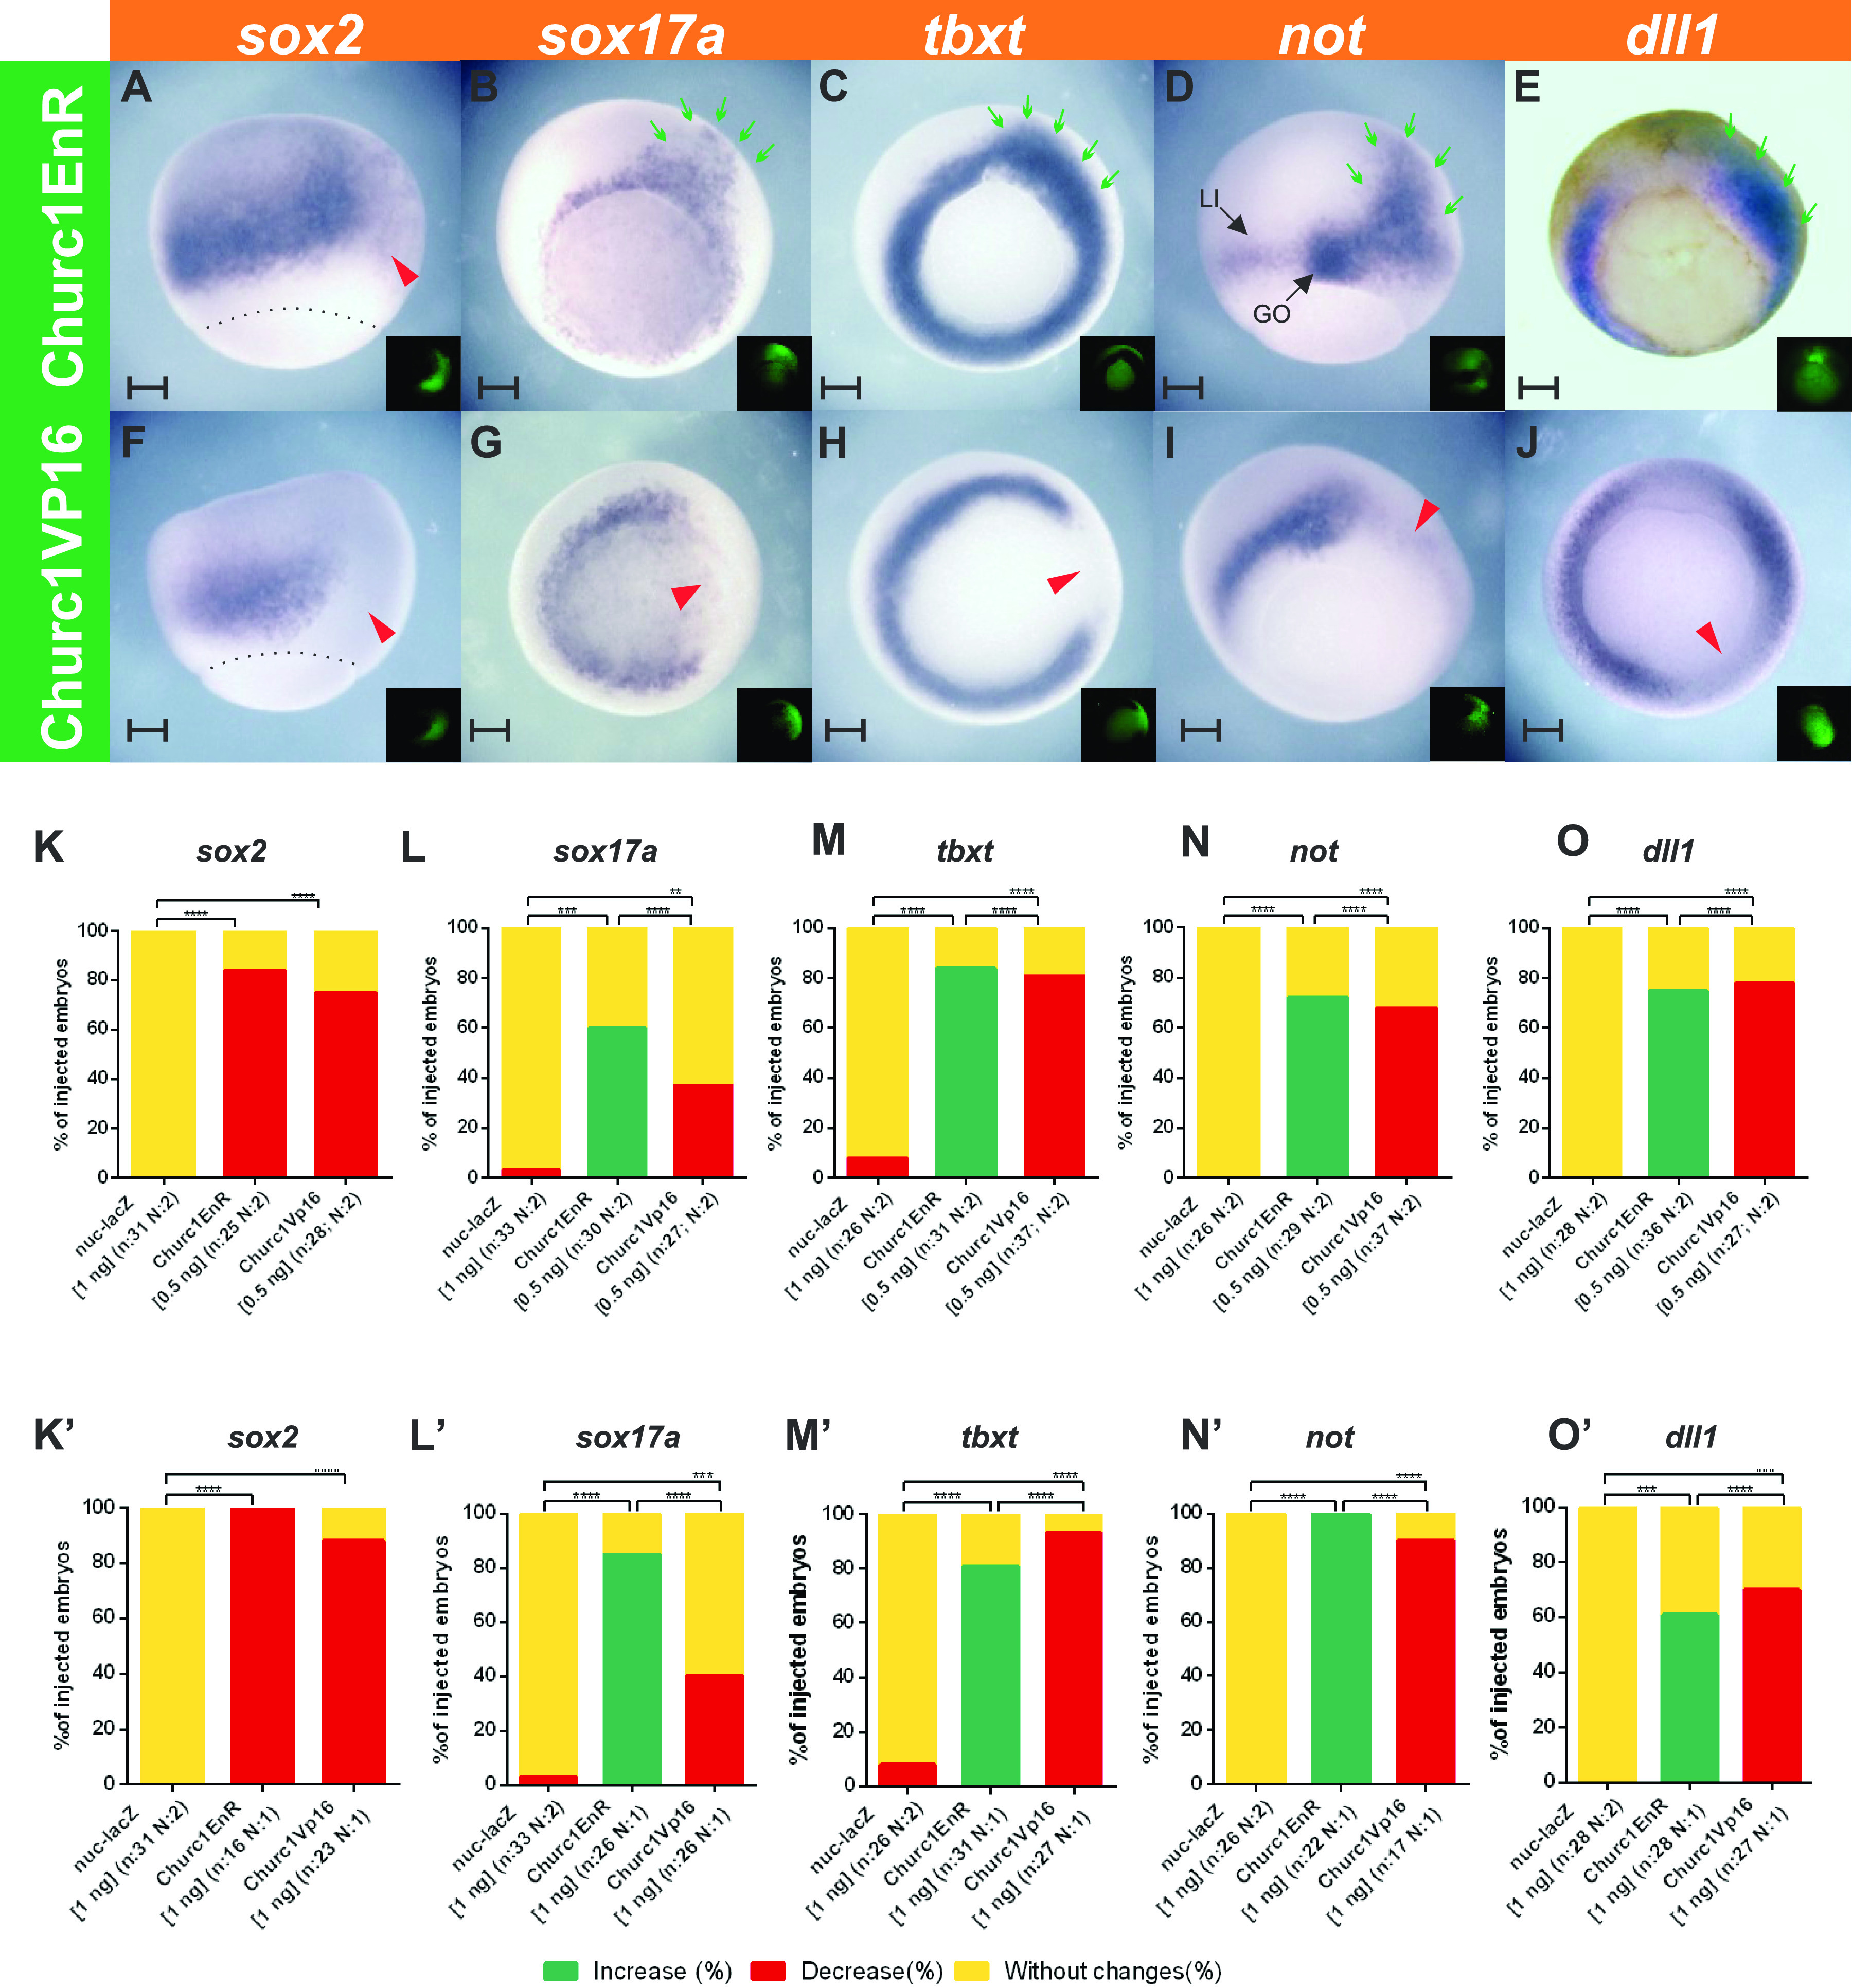
Embryos were injected into one dorsal cell at the four-cell stage with: (A, B, C, D, E) churc1EnR mRNA. (F, G, H, I, J) churc1VP16 mRNA. They were allowed to develop until the gastrula stage when they were analyzed through in situ hybridization for the following markers: (A, F) sox2 (neuroectoderm). (B, G) sox17a (endoderm). (C, H) tbxt (pan-mesoderm). (D, I) not (GO, gastrula organizer; LI, limit of involution). (E, J) dll1 (Notch ligand). All photographs are oriented with the injected side towards the right. The injected side was revealed by the green fluorescence of the dextran tracer (shown in the insets). Dotted lines delineate the blastopore. For each marker, the expression was compared between the injected- and the non-injected sides. Red arrowheads point to repression, and green arrows, to domain expansions on the injected side. Scale bars: 0.2 mm. (K, L, M, N, O, K’, L’, M’, N’, O’) Graphs comparing the effects between churc1EnR mRNA, churc1VP16 mRNA, and nuc-lacZ mRNA (see Fig S1). Results are represented as the percentage of injected embryos showing increase (green), decrease (red), or no changes (yellow) in the expression of sox2 (K, K’), sox17a (L, L’), tbxt (M, M’), not (N, N’), or dll1 (O, O’) on the injected side in comparison to the non-injected side. (K, L, M, N, O) Comparison between 0.5 ng of churc1EnR mRNA, 0.5 ng of churc1VP16 mRNA, and 1 ng of nuc-lacZ mRNA. (K’, L’, M’, N’, O’) Comparison between 1 ng of churc1EnR mRNA, 1 ng of churc1VP16 mRNA, and 1 ng of nuc-lacZ mRNA. Asterisks indicate significant differences between treatments (Chi-square test; ****P < 0.0001; ***P = 0.0001; **P = 0.0032; n, total number of analyzed embryos for each marker; N, number of independent experiments).
Figure S1. Injection of nuc-lacZ mRNA does not affect the expression domains of the markers analyzed in this work.

(A, B, C, D, E, E’, F, F’, G, G’) One cell of four-cell stage embryos was injected with 1 ng (A, B, C, D, F, F’, G, G’) or 1.5 ng (E, E’) of nuc-lacZ mRNA as control. At gastrula stage, the expression of the following markers was analyzed through in situ hybridization: (A) sox2 (neuroectoderm). (B) sox17a (endoderm). (C) tbxt (pan-mesoderm). (D) not (GO, gastrula organizer; LI, limit of involution). (E, E’’) hes4. (F, F’,G, G’) dll1. For each marker, expression was compared between the injected- (revealed by the enzymatic activity of β-galactosidase, turquoise staining) and the non-injected side. All photographs are oriented with the injected side towards the right. Yellow arrowheads and asterisks indicate that the expression of the analyzed marker was not changed on the injected side in comparison with the contralateral, non-injected side. (E’, E’’) Magnifications of the areas indicated by dotted squares in (E). (F, F’) and (G, G’) show two different embryos hybridized with dll1, one unilaterally injected on the ventral side (F, F’) and the other one, at the dorsal side (G, G’). Scale bars: 0.2 mm, except in (E’, E’’), where the scale bar represents 0.1 mm.
Figure 3. Effects of Xenopus churc1 knockdown and churc1 overexpression on germ layer specification and dll1 expression during gastrulation.

(A, B, C, D) Embryos were injected into one dorsal cell at the four-cell stage with the following molecules: (A, B, C, D) Control MO (20 ng). (E, F, G, H) churc1 MO (20 ng). (I, J, K, L) churc1 MO (20 ng) + churc1 mRNA (1 ng). (M, N, O, P, Q) churc1 mRNA (1 ng). (A, E, I, M, N) They were allowed to develop until gastrula stage when they were analyzed through in situ hybridization for the following markers: (A, E, I, M, N) sox2 (neuroectoderm). (B, F, J, O) sox17a (endoderm). (C, G, K, P) tbxt (pan-mesoderm). (D, H, L, Q) dll1 (Notch ligand). All photographs are oriented with the injected side towards the right. (A’, B’, C’, D’, E’, F’, G’, H’, I’, J’, K’, L’, M’, N’, O’, P’, Q’) Fluorescence microscopy images corresponding to the bright field images shown in (A, B, C, D, E, F, G, H, I, J, K, L, M, N, O, P, Q) revealing the green fluorescence of the dextran tracer (FD) which marks the injected side. The borders of the fluorescent regions are projected with green dotted lines into the corresponding bright field views in (A, B, C, D, E, F, G, H, I, J, K, L, M, N, O, P, Q). Yellow segments indicate the domain width for each marker. Red, green, and yellow arrows point to decreased, expanded, or unperturbed expression, respectively, of the analyzed marker on the injected side in comparison to the non-injected side. Scale bars: 0.2 mm. (R) Graphs comparing the effects between nuc-lacZ mRNA (1 ng), control MO (20 ng), churc1 MO (20 ng), churc1 MO (20 ng) + churc1 mRNA (1 ng), and churc1 mRNA (1 ng). Graphs represent the percentages of injected embryos showing increase (green), decrease (red), or no changes (yellow) for the expression domains of tbxt (triangular matrix labeled in blue), sox2 (triangular matrix labeled in cyan), sox17a (triangular matrix labeled in purplish pink), and dll1 (triangular matrix labeled in violet) on the injected side in comparison to the non-injected side. Representative images of nuc-lacZ mRNA-injected embryos are shown in Fig S1. Each triangular matrix represents the comparisons between injections (internal labeled blocks on the hypotenuse) for each marker (lateral labeled blocks). For example, to compare the churc1 mRNA and the lacZ mRNA injections for the dll1 marker, see the intersection between the churc1 mRNA column and the nuc-lacZ mRNA row at the bottom left corner of the figure. n, total number of analyzed embryos. N, number of independent experiments. Asterisks indicate significant differences between treatments (P < 0.05; Chi-Square test). P-values are shown within each panel. ns, non-significant differences.
To verify if churc1 can promote neuroectoderm development at the expense of the endomesoderm, gain of function experiments were performed with the churc1 activating form (churc1VP16) or churc1 overexpression. As expected, churc1VP16 significantly suppressed sox17a and tbxt (Fig 2G, H, L, L’, M, and M’) and 1 ng of churc1 mRNA significantly reduced the extent of their domains on the injected side (Fig 3O, P, and R), albeit these effects were milder than those obtained with churc1VP16. These results confirm that churc1 disfavors endomesoderm development. Strikingly, rather than expanding the sox2 domain, as expected if churc1 favored neuroectoderm, the potent activating construct churc1VP16 significantly suppressed sox2 in the great majority of embryos (Fig 2F, K, and K’; 75% for 0.5 ng, 88% for 1 ng of churc1VP16 mRNA). This result might be explained because mesoderm specification is strongly suppressed by this construct and therefore, embryos would lack the signals necessary for neural induction and stabilization of the neural fate emitted by the GO, its precursors, and its descendants (Stern, 2005, 2006; Stern et al, 2006). In fact, overexpressing 1 ng of churc1 mRNA significantly changed sox2 expression, producing two distinct phenotypes with similar frequencies: in 40% of the embryos the sox2 domain was expanded (this was the expected phenotype if churc1 favored neural specification) (Fig 3M, M’, and R), and in 53% of the embryos, sox2 expression was reduced (Fig 3N, N’, and R). This second phenotype is similar to but milder than that obtained with churc1VP16, which strongly suppressed sox2 in the great majority of cases (75% and 88% of embryos injected with 0.5 and 1 ng of churc1VP16 mRNA, respectively). Since the effects of 1 ng of churc1 mRNA are rather moderate in comparison to those obtained with 0.5 or 1 ng of the churc1VP16 activating construct, we interpret that in those embryos with milder mesodermal defects it was still possible to observe neuroectoderm expansions, as expected according to the hypothesis that churc1 favors neuroectoderm development.
To corroborate this, we compared the effects of overexpressing 0.5, 1, and 2 ng of churc1 mRNA on the same germ layer markers and the neural inducer chrd.1, which is normally expressed in the GO (de Robertis & Kuroda, 2004). All tested doses of churc1 mRNA significantly decreased sox17a, tbxt, and chrd.1 expression when compared to lacZ mRNA injections (Figs 3–5 and S1), with more severe repressions at the highest dose. churc1 mRNA also significantly perturbed sox2 expression at all amounts tested (Figs 3–5 and S1). Remarkably, the increase of this neural marker prevailed with the lowest dose of churc1 mRNA whilst sox2 repression prevailed with the highest dose (Figs 3 and 4). Concomitantly, a moderate decrease in chrd.1 expression prevailed with the lowest dose of churc1 mRNA whilst a severe chrd.1 repression prevailed with the highest dose (Fig 5). These results indicate that at lower doses, churc1 mRNA overexpression favors neural development, most likely because sufficient levels of neural inducers like Chrd.1 are present to allow neural induction. In contrast, higher doses of churc1 mRNA strongly repressed mesoderm development and neural inducers like Chrd.1 would not reach sufficient levels to promote neural induction, thus explaining the decrease of sox2 expression.
Figure 5. Effects of different doses of churc1 mRNA overexpression on chrd.1 expression at gastrula stage.

(A, B, C, D, E, F, G) Expression of transcripts encoding the neural inducer Chrd.1 revealed by in situ hybridization at gastrula stage in embryos that were injected into one dorsal cell at the four-cell stage with the following mRNAs: (A, B) 0.5 ng of churc1. (C, D) 1 ng of churc1. (E, F) 2 ng of churc1. (G) 1 ng of nuc-lacZ. (A’, B’, C’, D’, E’, F’) Fluorescence microscopy images corresponding to the bright field images shown in (A, B, C, D, E, F), respectively, revealing the green fluorescence of the dextran tracer (FD) which marks the injected side. (G) The injected side in (G) was revealed by the enzymatic activity of β-galactosidase (turquoise staining). In all photographs, the injected side is oriented towards the right. Black arrowheads point to chrd.1 expression on the non-injected side. Red and yellow arrowheads point to decreased or unperturbed chrd.1 expression, respectively, on the injected side, in comparison to the non-injected side. Scale bars: 0.2 mm. (H) Graph comparing the effects on chrd.1 expression of 0.5, 1, and 2 ng of churc1 mRNA, and 1 ng of nuc-lacZ mRNA. Results are represented as the percentage of injected embryos showing increase (green), decrease (red), or no changes (yellow) of chrd.1 expression on the injected side in comparison to the non-injected side. Asterisks indicate significant differences between churc1 mRNA and lacZ mRNA injections (***P < 0.0001; Chi-Square test). (I) Graph representing the percentage of embryos with moderate (pink), as shown in (A, C, E), or severe decrease (wine red) of chrd.1 expression, as shown in (B, D, F), after churc1 mRNA overexpression, considering as 100% the total number of embryos showing chrd.1 downregulation. n, total number of analyzed embryos. N, number of independent experiments.
Figure 4. Effects of different doses of churc1 mRNA overexpression on germ layers markers at gastrula stage.

(A, B, C, D, E, F, G, H, I) Embryos injected into one dorsal cell at the four-cell stage with 0.5 ng of churc1 mRNA (A, A’, D, G, H) or 2 ng of churc1 mRNA (B, B’, E, I). They were allowed to develop until gastrula stage when they were analyzed through in situ hybridization for the following markers: (A, A’, B, B’) tbxt (pan-mesoderm). (D, E) sox17a (endoderm). (G, H, I) sox2 (neuroectoderm). All photographs are oriented with the injected side towards the right. The injected side was revealed by the green fluorescence of the dextran tracer (FD, shown in the insets). For each marker, expression was compared between the injected- and the non-injected sides. Red and green arrowheads point to decreased or reduced expression, respectively, of the analyzed marker on the injected side. Embryos are shown in posterior (A, B, D, E) or dorsal views (A’, B’, G, H, I). The dorsal views shown in (A’, B’) are from the same embryos shown in posterior view in (A, B), respectively. Scale bars: 0.2 mm. (C, F, J) Graphs comparing the effects of 0.5, 1, and 2 ng of churc1 mRNA, and 1 ng of nuc-lacZ mRNAs on the expression of tbxt (C), sox17a (F), and sox2 (J). For each marker, results are represented as the percentage of injected embryos showing increase (green), decrease (red), or no changes (yellow) on the injected side in comparison to the non-injected side. Results from the injections of 1 ng of nuc-lacZ mRNA or 1 ng of churc1 mRNA to build these graphs are shown in Figs S1 and 3, respectively. Asterisks indicate significant differences between churc1 mRNA and lacZ mRNA injections (***P < 0.0001; Chi-Square test). n, total number of analyzed embryos. N, number of independent experiments.
We also analyzed the effects of churc1EnR and churc1VP16 on not expression, which encodes a homeodomain transcription factor (von Dassow et al, 1993). During gastrulation, not is expressed in the GO (Figs 2D and S1D), marking the dorsal midline (DML) precursors that will later populate the notochord, the neural tube floor plate, and the endodermal DML (von Dassow et al, 1993). In addition, not is expressed in a ring with diffuse edges of positive scattered cells demarcating the transition border between neuroectoderm and endomesoderm during gastrulation, corresponding to the limit of involution (von Dassow et al, 1993) (Figs 2D and S1D). Therefore, we focused our attention on the limit of involution domain. While nuc-lacZ did not affect this domain on the injected side (Figs S1D and 2N and N’), Churc1EnR significantly expanded it towards the animal pole (Fig 2D, N, and N’), whereas the activating VP16 form significantly suppressed it (Fig 2I, N, and N’). Therefore, when Churc1-target genes were repressed, the transition border between germ layers was expanded, with a predominance of endomesodermal precursors (as revealed by the expansion of tbxt and sox17a in the same group of embryos) at the expense of the neuroectodermal fate (sox2).
Overall, our results support the hypothesis that in Xenopus, churc1 controls the limit of involution position, disfavoring the development of IMZ cell lineages (mesoderm and endoderm) and favoring neural specification if neural inducers are present.
Churc1 restricts dll1 expression to the IMZ
The effects produced by churc1EnR and churc1 MO on germ layer markers were similar (although with stronger suppressions and expansions in the case of the repressor construct) to those previously obtained when the Notch pathway was blocked at the Dll1 ligand’s level (Revinski et al, 2010). This suggests that churc1 and the Dll1/Notch pathway might be linked during germ layer development. Therefore, we wondered if churc1 is capable of regulating the Dll1/Notch pathway and we examined dll1 expression at gastrula stage after activating or blocking churc1 function.
Dll1 is normally expressed in the IMZ, but it is turned off once cells have involuted (Wittenberger et al, 1999; López et al, 2005). Injection of nuc-lacZ mRNA or control MO did not affect dll1 expression in the IMZ (Figs S1F–G’ and 3D, D’, and R). Gain of function with either churc1VP16 or churc1 mRNA significantly suppressed dll1 in the IMZ (Figs 2J, O, and O’ and 3Q, Q’, and R). On the other hand, both, churc1EnR and churc1 MO significantly expanded the dll1 domain (Figs 2E, O, and O’ and 3H, H’, and R). The effect of churc1 MO on dll1 was specific since it was significantly rescued by churc1 mRNA (Fig 3L, L’, and R). Our results demonstrate that, normally, dll1 expression is inhibited in the territories where churc1 is active and is thus restricted to the IMZ.
In silico analysis shows that both Xenopus laevis zeb2 homeologs contain putative Churc1 binding sites
An in vitro DNA binding selection assay (SELEX assay) previously determined that the chicken CHURC1 protein binds to an NGGGNN motif, with N representing any nucleotide with the frequencies shown in Fig S2A. Gel mobility shift and competition assays confirmed that CHURC1 specifically binds to this sequence (Sheng et al, 2003). In the same study, an in silico analysis of a 4,020 bp sequence of the human ZEB2 gene, which included the promoter region, contained a significantly higher number of CHURC1 binding motifs than those expected by chance (Sheng et al, 2003).
Figure S2. In-silico analysis of putative Churc1 binding sites in Xenopus laevis zeb2 homeologs.

(A) Sequence logo and frequency table describing the degree of information and the frequency per position of the Churc1-binding motif adapted from Sheng et al (2003). (B) Kernel density plot. Density distribution (N = 10,000, Bandwidth = 1.257) of the NGGGNN motifs present in the two collections of 10,000 simulated (sim) sequences with the same nucleotide composition and length of X. laevis zeb2.S and zeb2.L regions analyzed and in the corresponding biological genomic regions of both homeologs. Dashed lines represent the mean for each collection of simulated sequences ( = 65.45 ± 9.63 for sim zeb2.S; = 70.47 ± 9.98 for sim zeb2.L). The vertical light blue line represents the 117 motifs present in zeb2.S biological sequence and the red one, the 144 motifs present in the zeb2.L biological sequence. (C) Density distribution of NGGGNN motifs for the biological zeb2 sequences (red lines; 117 motifs for zeb2.S, 144 motifs for zeb2.L) and their simulated sequences (light blue lines; 117 motifs randomly selected for sim zeb2.S and 144 for sim zeb2.L; one example of the 1,000 Monte Carlo generated data is shown). Dashed lines: mode for each distribution. (D) Empirical Cumulative Density Function graphs showing the results of the 100,000 Monte Carlo simulations when the success rate of the zeb2 biological sequences (bio) is divided by the success rates from simulated sequences (sim). The success rate of the biological sequence was higher than that of the simulated sequences in 90% and 99% of the 100,000 simulations for zeb2.S and zeb2.L, respectively. Pink dashed lines: threshold above which the success rate of the biological sequence is higher than that of the simulated sequences. (E) Distribution of putative Churc1 binding sites in a region containing the promoters of both zeb2 homeologs. Yellow boxes: first exon and the beginning of the second exon, containing the translation start site (ATG). Two peaks of enrichment in NGGGNN motifs are immediately upstream of the first and second exons, coincident with human ZEB2 (Sheng et al, 2003).
Based on the evidence reported from the in silico analysis of the human ZEB2 gene (Sheng et al, 2003), we performed a similar analysis for both X. laevis zeb2 homeologs, focusing on those genomic regions comparable to the human ZEB2 4,020 bp region analyzed by Sheng et al (2003). As in human ZEB2, both regions of zeb2.S and zeb2.L included a predicted transcription initiation site, the first exon, the first intron, the second exon with the translational initiation site (ATG), and a similar sequence length.
When we compared the number of putative Churc1 binding motifs, we found that the X. laevis zeb2 biological sequences contain 117 and 144 motifs for the zeb2.S and zeb2.L homeologs, respectively. In contrast, for the 10,000 simulated random zeb2.S sequences, we found an average of = 65.45 ± 9.63 motifs per sequence, significantly less than the 117 motifs observed in the biological zeb2.S sequence (P < 0.00001; one sample Z-test). Similarly, for the 10,000 simulated random zeb2.L sequences we found an average of = 70.47 ± 9.98 motifs per sequence, significantly less than the 144 motifs observed in the biological zeb2.L sequence (P < 0.00001, one sample Z-test) (Fig S2B). Additionally, an enrichment test was conducted with the MotifCounter R package (Kopp, 2017) and the result was a 2.68-fold enrichment for zeb2.L (P = 1.46 × 10⁻⁷) and a 1.92-fold enrichment for zeb2.S (P = 2.23 × 10⁻³) compared with their simulated random sequences.
These results show that coincidently with the findings shown for the human ZEB2 gene (Sheng et al, 2003), both X. laevis zeb2 homeologs contain a statistically nonrandom high number of putative Churc1 binding motifs in their genomic regions of interest analyzed here.
Coincident with the analysis of the human ZEB2 gene addressing the quality of the NGGGNN sites (Sheng et al, 2003), the Logarithmic Likelihood (Log L) Sum scores for the zeb2.S and zeb2.L biological regions were significantly higher compared to the Log L sum of their corresponding simulated collections (not shown). However, this was indeed expected, since the collections of simulated sequences contain significantly lower numbers of NGGGNN sites (as demonstrated above, Fig S2B). Therefore, we performed an additional analysis of LogL distribution, for which we pooled all NGGGNN motifs present in the 10,000 simulated sequences. Then, we randomly selected from the pool the same number of NGGGNN motifs present in each biological zeb2 region analyzed (117 y 144 for zeb2.S and zeb2.L, respectively). When we performed 1,000 non-parametric Kruskal-Wallis sum of ranks tests comparing the same number of motifs present in the biological sequences versus randomly selected motifs from the simulated sequences, no significant differences were obtained, but enrichment in motifs with LogL values higher than five can be observed in the biological sequences in comparison to the simulated sequences (Fig S2C). This supposes a distribution of motifs in the biological sequences with a higher probability of interacting with Churc1.
Next, we wondered if the motifs present in the biological sequences have a higher success rate to bind the Churc1 protein than the motifs present in the simulated sequences. To address this, we performed an A/B test comparing two β distributions. The “success rate” of binding Churc1 for the zeb2.L biological sequence has a 0.99876 probability of being higher than the “success rate” for the corresponding simulated sequences. For zeb2.S, this probability was 0.92322 (Fig S2D). Overall, we conclude that in terms of quality binding, for both zeb2 homeologs it is very unlikely that the higher number of sites with a higher probability of binding Churc1 (according to the SELEX assay) in the biological zeb2 sequences have arisen by chance.
Finally, we analyzed the local distribution of putative Churc1 binding motifs along each zeb2 homeolog’s region of interest by scanning their sequences through a 150-nucleotides sliding window to evaluate if they are randomly distributed or if they are enriched in certain regions. We found regions with higher numbers of motifs than those expected by chance (Fig S2E). Therefore, putative Churc1 binding sites are not randomly distributed, but are enriched between the beginning of the first exon and the translational start site in both zeb2.S and zeb2.L regions analyzed. Similar results also were found in the same regions of the human ZEB2 gene (Sheng et al, 2003).
In conclusion, the in silico analysis showed that coincidently with the human ZEB2 gene, both X. laevis homeologs contain a high number of statistically not-random putative Churc1 binding sites near their predicted promoter regions, mostly concentrated upstream of the first and second exons, suggesting that zeb2 might be a Churc1-direct target in Xenopus.
Functional experiments demonstrate that churc1 positively controls zeb2
To corroborate if zeb2 is regulated by churc1 in vivo, we altered churc1 function through overexpression and knockdown experiments and analyzed zeb2 expression by ISH at gastrula stage. In nearly all embryos (16 of 18, 89% of injected embryos), churc1 mRNA increased zeb2 expression on the injected side (Fig 6B, B’, and H). These changes were statistically significant in comparison to embryos unilaterally injected with nuc-lacZ mRNA (Fig 6G and H). Knockdown with churc1 MO produced the opposite result, decreasing zeb2 expression in the great majority of embryos (34 of 38, 89% of injected embryos; Fig 6C, C’, and H), indicating that churc1 is normally required for zeb2 expression. This decrease was statistically significant in comparison to embryos unilaterally injected with control MO (Fig 6A, A’, and H) and was significantly rescued by co-injection of 1 ng of churc1 mRNA (Fig 6D–H), confirming that the effects of churc1 MO on zeb2 were specific. We conclude that churc1 positively controls zeb2 in vivo during Xenopus gastrulation.
Figure 6. churc1 positively controls zeb2 expression in vivo during Xenopus gastrulation.

(A, B, C, D, E, F, G) zeb2 expression was analyzed by in situ hybridization at gastrula stage in embryos that were injected into one dorsal cell at the four-cell stage with the following molecules: (A) control MO (20 ng). (B) churc1 mRNA (1 ng). (C) church1 MO (20 ng). (D, E, F) church1 MO (20 ng) + churc1 mRNA (1 ng). (G) nuc-lacZ mRNA as control (1 ng). zeb2 expression was compared between the injected- and the non-injected sides. (A’, B’, C’, D’, E’, F’) Fluorescence microscopy images corresponding to the bright field images shown in (A, B, C, D, E, F), respectively, revealing the green fluorescence of the dextran tracer (FD) which marks the injected side. (G) The injected side in (G) was revealed by the enzymatic activity of β-galactosidase (turquoise staining). In all photographs, the injected side is oriented towards the right. Red, green, and yellow arrowheads point to decreased, increased, or unperturbed zeb2 expression on the injected side in comparison to the non-injected side. Scale bars: 0.2 mm. (H) Graphs comparing the effects on zeb2 expression between nuc-lacZ mRNA (1 ng), control MO (20 ng), churc1 MO (20 ng), churc1 MO (20 ng) + churc1 mRNA (1 ng), and churc1 mRNA (1 ng). Graphs represent the percentages of injected embryos showing increase (green), decrease (red), or no changes (yellow) of zeb2 expression on the injected side in comparison to the non-injected side. Asterisks indicate significant differences between treatments (P < 0.05; Chi-Square test). P-values are indicated in the table shown at the right. ns, non-significant differences. n, total number of analyzed embryos. N, number of independent experiments.
Dll1/Notch1 signaling positions the hes4 domain in the NIMZ
To corroborate if hes4 is regulated by notch1/dll1 throughout the NIMZ, we analyzed hes4 expression in this region, flanking the GO/DML precursors, in embryos in which we manipulated Dll1/Notch1 signaling. Activation of the Dll1/Notch1 pathway by overexpressing either the constitutively active Notch1 intracellular domain (NICD1) or the Dll1 ligand significantly expanded the NIMZ hes4 domain (Fig 7A–A’’’, D–D’’, and F). In contrast, blocking Dll1/Notch1 signaling with notch1 MO, a dominant negative construct of rbpj (rbpjDBM), or a dominant negative construct of dll1 (dll1STU) decreased hes4 expression in the NIMZ on the injected side (Fig 7B–B’’’, C–C’’’, E–E’’, and F) and this change was significant in comparison to lacZ mRNA injection (Figs S1E–E’’ and 7F). This confirms that Dll1/Notch1 signaling positively controls the hes4 domain throughout the NIMZ. Since dll1 is expressed in the IMZ and hes4, in the NIMZ, we propose that IMZ cells emit the Dll1 signal that activates hes4 transcription in the neighboring NIMZ cells through the Notch1/Rbpj pathway.
Figure 7. Dll1/Notch1 signaling positions the hes4 domain demarcating the NIMZ.
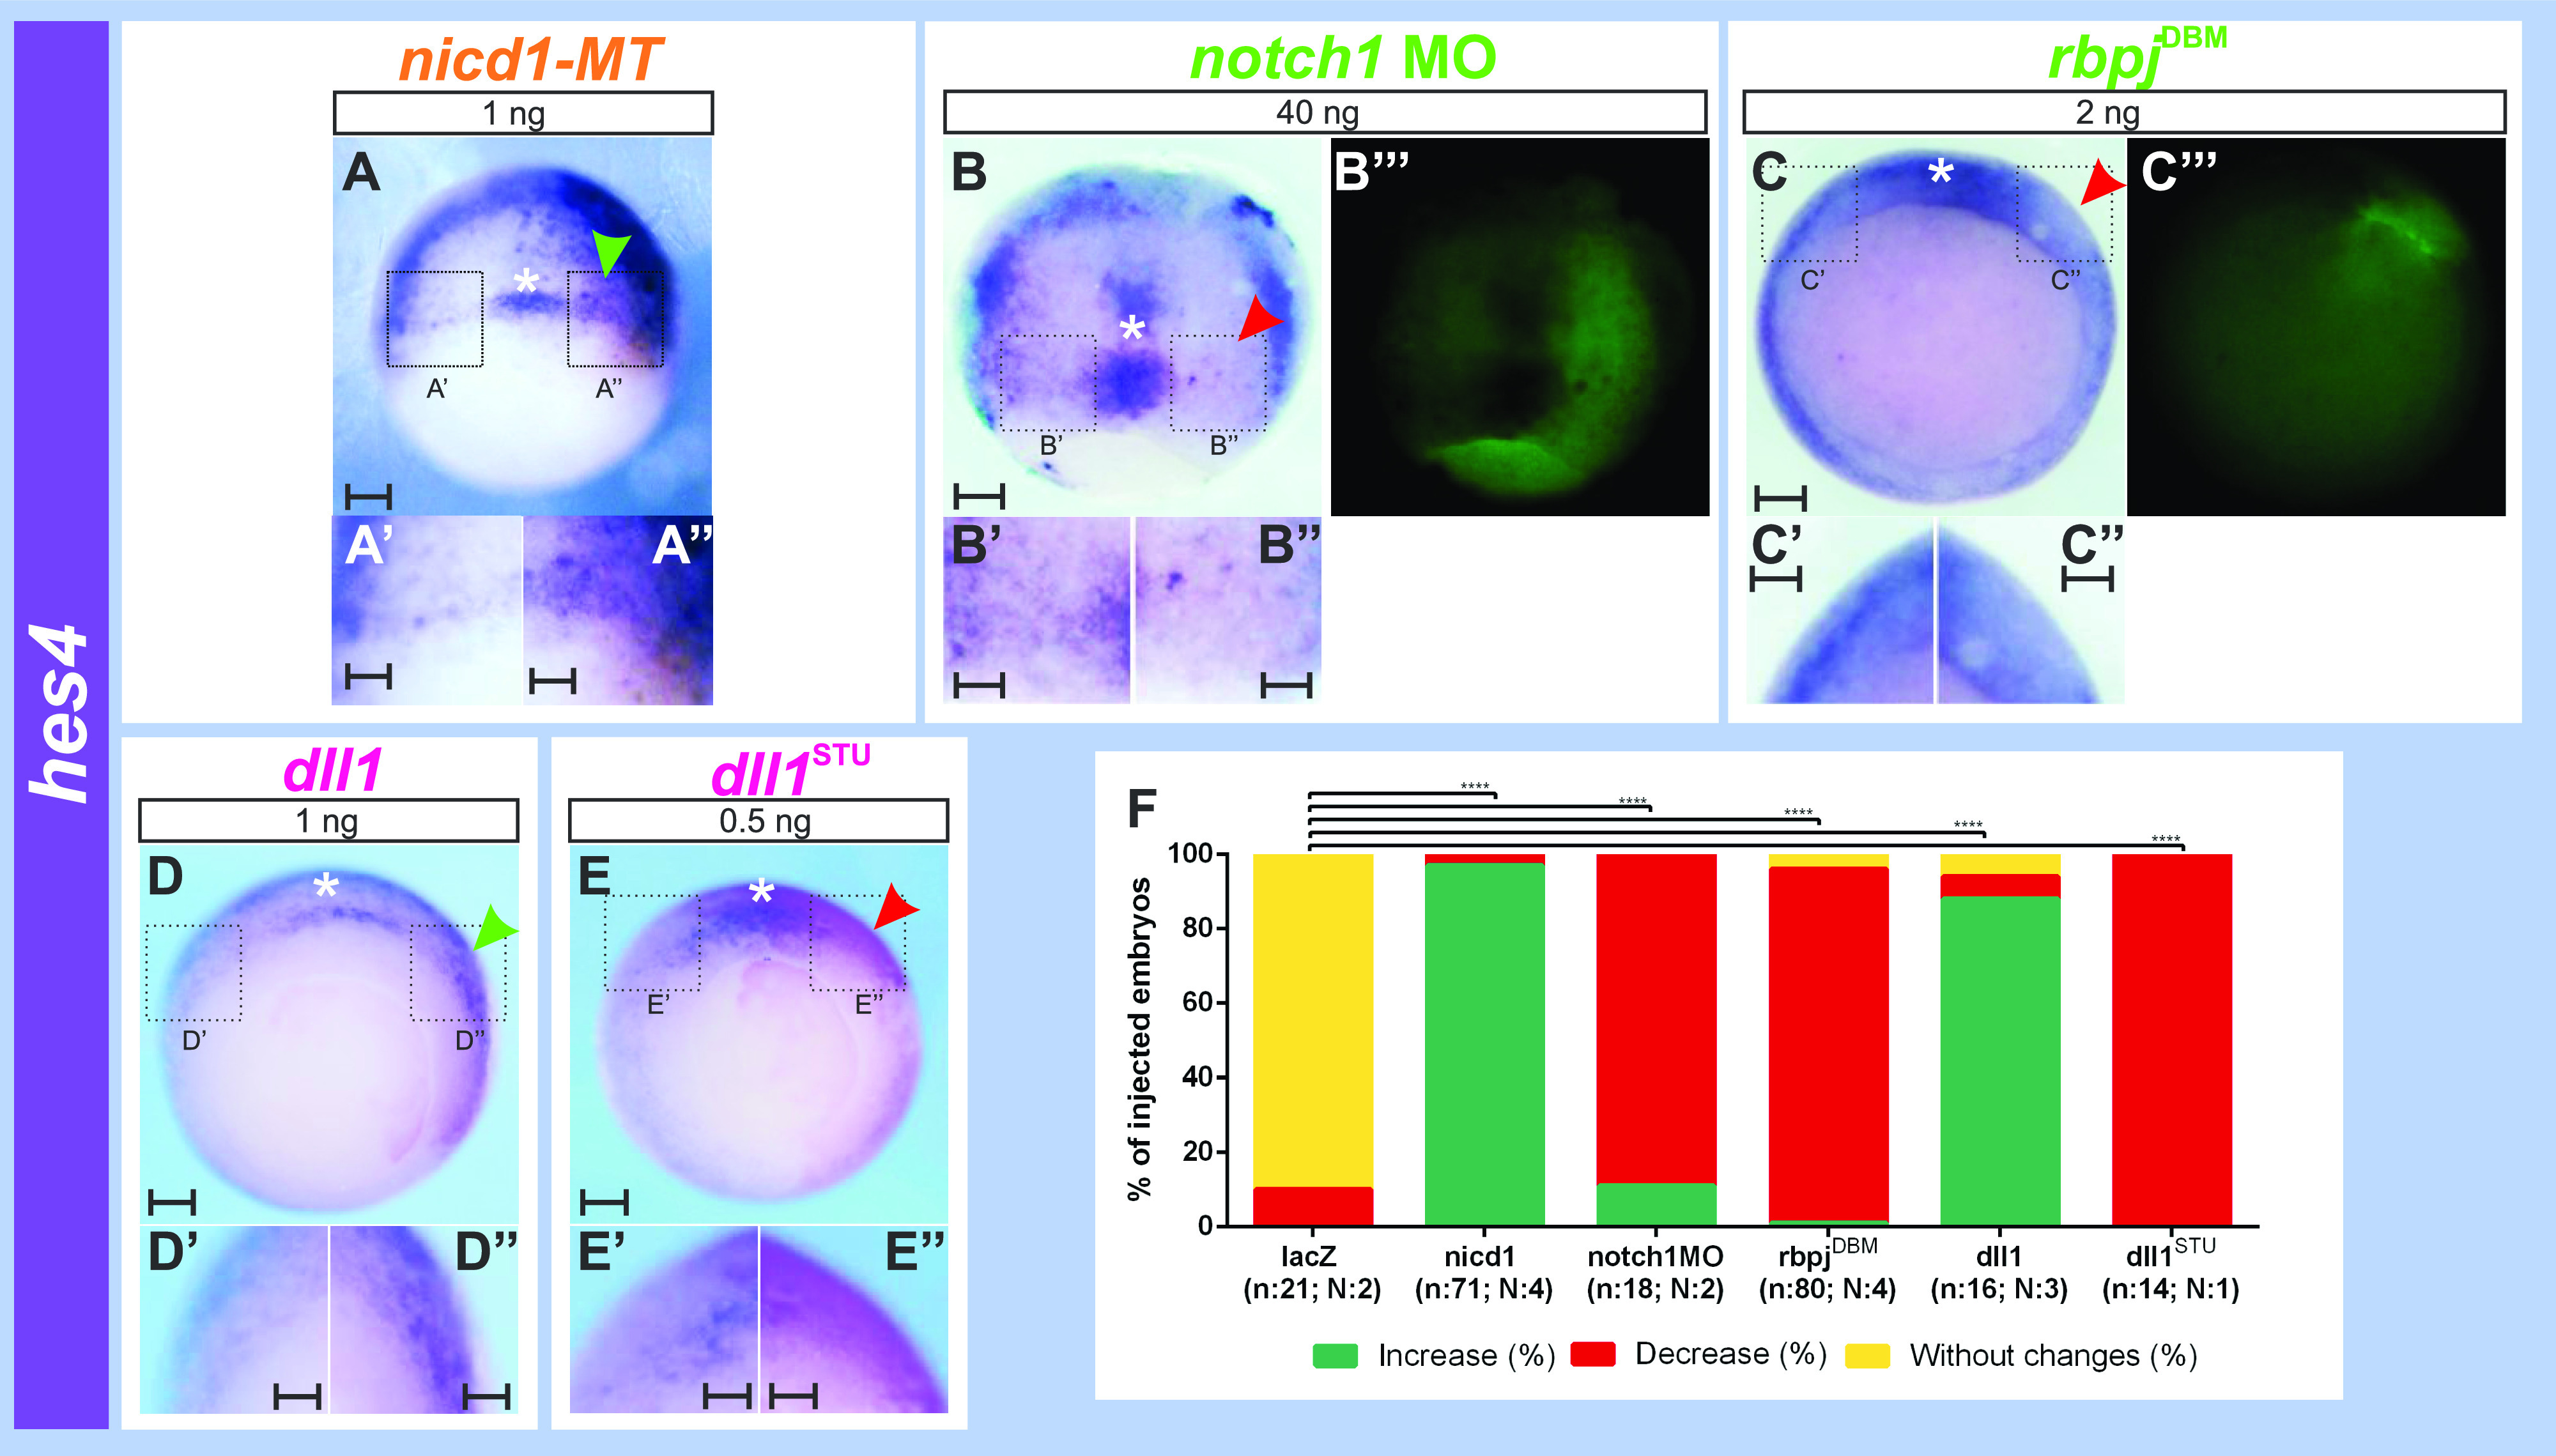
(A, B, C, D, E) hes4 expression revealed by in situ hybridization at gastrula stage (NF11-11.5) in embryos that were unilaterally injected with: (A) 1 ng of nicd1-MT mRNA. (B) 40 ng of notch1 MO. (C) 2 ng of rbpjDBM mRNA. (D) 1 ng of dll1 mRNA. (E) 0.5 ng of dll1STU mRNA. Scale bars: 0.2 mm. (A, B’’’, C’’’, D, E) The injected side was revealed by MT immunolocalization (brown staining in A) or by the dextran tracer (green fluorescence in B’’’, C’’’; magenta staining in D, E). All photographs are oriented with the injected side towards the right. We evaluated the hes4 stripes demarcating the NIMZ flanking hes4 expression in the DML precursors (white asterisk). Red and green arrowheads point to decreased or increased hes4 expression in the NIMZ domain, respectively, on the injected side in comparison to the non-injected side. (A’, A’’, B’, B’’, C’, C’’, D’, D’’, E’, E’’) Magnification of areas depicted within black dotted squares in (A, B, C, D, E), respectively. Scale bars: 0.1 mm. (F) Graph comparing the effects between 1 ng of nicd1-MT mRNA, 40 ng of notch1 MO, 2 ng of rbpjDBM mRNA, 1 ng of dll1 mRNA, and 0.5 ng of dll1STU mRNA on NIMZ hes4 expression flanking the DML precursors. Graphs represent the percentage of injected embryos showing an increase (green), decrease (red), or no changes (yellow) in hes4 expression, which was significantly increased by nicd1 and dll1 mRNAs, and significantly decreased (Chi-Square test; ****P = 0.0001) by notch1 MO, rbpjDBM mRNA, and dll1STU mRNA in comparison to lacZ mRNA injections, which did not perturb hes4 expression in this domain. 1.5 ng of nuc-lacZ or 2 ng of cyt-lacZ mRNAs were injected as control (see Fig S1E–E’’). n, total number of analyzed embryos; N, number of independent experiments.
Nodal signaling positions the dll1 and hes4 domains in the MZ
Considering the key role of the Nodal pathway in the induction of germ layers and the role of the Notch pathway in their delimitation in vertebrates (Favarolo & López, 2018), we addressed if Nodal could control the Notch pathway in the MZ during gastrulation when germ layer segregation takes place. To this aim, we activated or blocked the Nodal pathway and analyzed dll1 and hes4 expression.
For activation of the Nodal pathway, we injected smad2CA-MT mRNA, which encodes a constitutively active (CA) form of Smad2 (the Nodal pathway’s effector) fused to a Myc tag epitope (MT) (Müller et al, 2000). Strikingly, dll1 expression was suppressed in cells with the highest levels of Smad2CA protein, as revealed by immunofluorescence of the fused MT (Fig 8A, A’, and H) or by the β-Galactosidase activity resulting from the co-injected nuc-lacZ mRNA tracer (Fig S3), whereas it was ectopically activated in neighboring cells in the ectoderm (Figs 8A, A’, and H and S3). This cell-autonomous repression of dll1 accompanied by a non-cell-autonomous induction of dll1 resulted in a significant and dramatic shift of the dll1 IMZ domain towards the ectoderm on the injected side (Figs 8A, A’, and H and S3; compare with uninjected control in Fig 8D). Injection of nuc-lacZ mRNA alone did not affect dll1 expression (Figs S1 and 8H). A similar and significant shift was obtained for the Notch target gene hes4 domain in the NIMZ after smad2CA-MT mRNA injection (Fig 8E, E’, and I). This evidence indicates that cells in which the Nodal cascade was strongly active emitted a signal that induced dll1 at a distance and hence triggered the Notch/hes4 pathway.
Figure 8. Effects of smad2CA and cer-S on the expression of dll1 and hes4 in the MZ at gastrula stage.
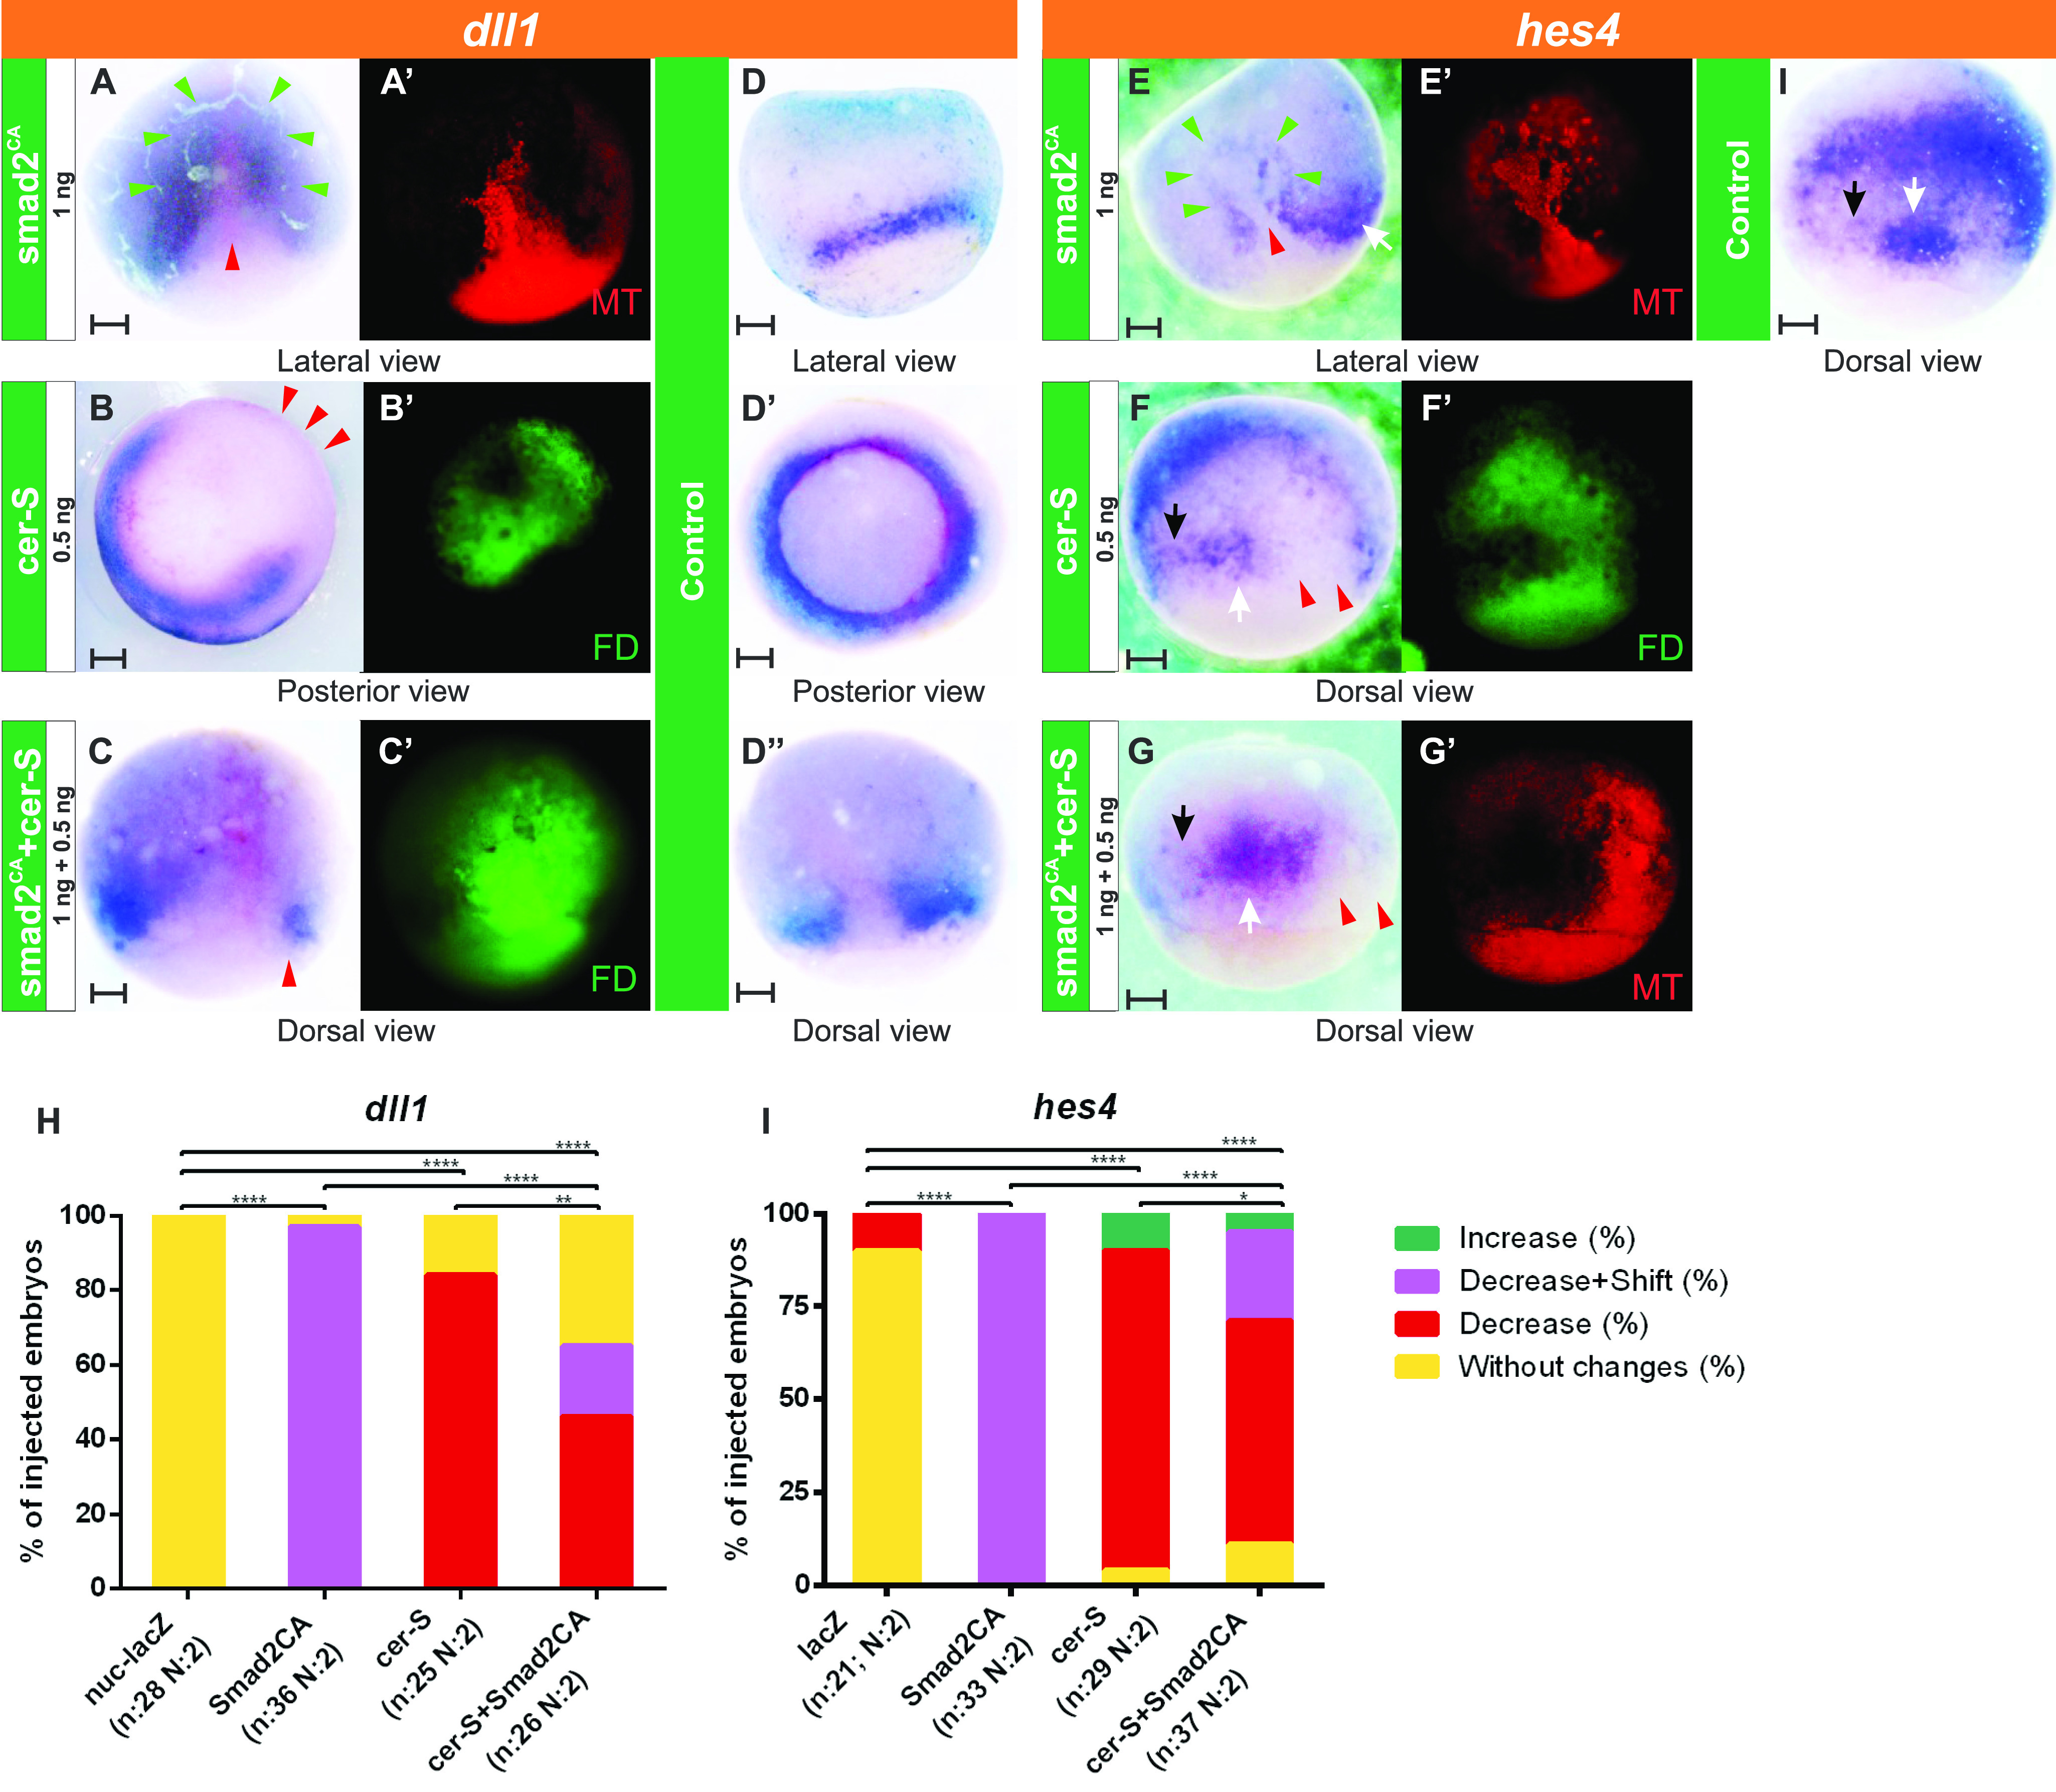
(A, B, C, E, F, G) Expression of dll1 (A, B, C) and hes4 (E, F, G) revealed by in situ hybridization at gastrula stage in embryos that were injected into one dorsal cell at the four-cell stage with: (A, E) 1 ng of smad2CA-MT mRNA. (B, F) 0.5 ng of cer-S mRNA. (C, G) 1 ng of smad2CA-MT mRNA + 0.5 ng of cer-S mRNA. (D, D’, D’’) dll1 expression in uninjected sibling controls. (I) hes4 expression in uninjected sibling controls. (A’, B’, C’, E’, F’, G’) Fluorescent images corresponding to the bright field views in (A, B, C, E, F, G), respectively, showing the injected side, as revealed by the c-Myc-tag epitope (MT, red immunofluorescence) (A’, E’, G’) or the FD tracer (green fluorescence) (B’, C’, F’). In all photographs of injected embryos, the injected side is oriented towards the right, except for (A, A’) and (E, E’), showing lateral views. For all the injected embryos as those shown in (A, B, D, E, F, G), we compared the MZ expression of dll1 (A, B, C) and hes4 (E, F, G) between the injected- and the uninjected sides. For hes4, we evaluated the hes4 stripes demarcating the NIMZ (black arrows) flanking hes4 expression in the DML precursors (white arrows). Red arrowheads: repression; green arrowheads: ectopic induction at a distance from the Smad2CA expressing cells. Cell-autonomous repression combined with ectopic induction of dll1 and hes4 by smad2CA resulted in a shift of their domains towards the ectoderm. Scale bars: 0.2 mm. (H, I) Graphs comparing the effects on dll1 (H) and hes4 expression (I) of 1 ng of nuc-lacZ mRNAs as injection control (see Fig S1), 1 ng of smad2CA-MT mRNA, 0.5 ng of cer-S mRNA, and 1 ng of smad2CA-MT mRNA + 0.5 ng of cer-S mRNA. The bars represent the percentage of injected embryos showing decrease (red), decrease + shift (purple), increase (green), or no changes (yellow) in dll1 (H) and hes4 expression (I). n, total number of analyzed embryos; N, number of independent experiments. Chi-square test; ****P < 0.0001; **P = 0.0093; *P = 0.0156. Differences are considered as significant when P < 0.05.
Figure S3. Effect of smad2CA mRNA co-injected with nuc-lacZ mRNA tracer on the expression of dll1.
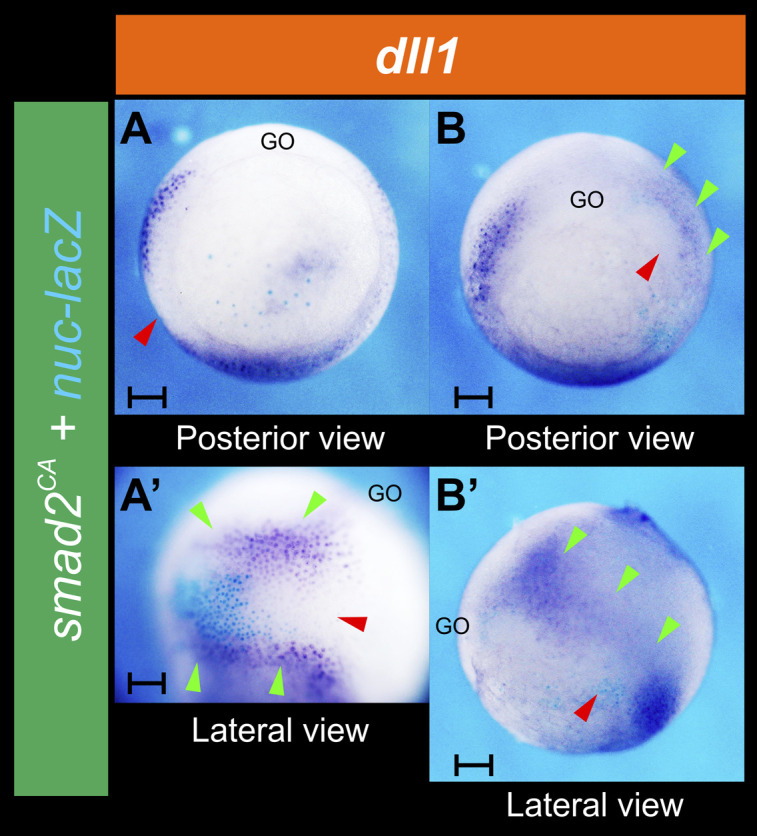
(A, A’) and (B, B’) Two different albino embryos photographed in posterior (A, B) and lateral views (A’, B’) showing dll1 expression at gastrula stage, as revealed by in situ hybridization. They were injected into one cell at the four-cell stage with 1 ng of smad2CA + 0.5 ng of nuc-lacZ mRNAs as tracer. The enzymatic β-galactosidase activity in descendants of the injected cell was revealed with Xgal (turquoise staining). The red arrowheads indicate dll1 repression; green arrowheads, ectopic induction of dll1 at a distance from the smad2CA/nuc-lacZ expressing cells. The combined cell-autonomous repression with the ectopic induction of dll1 by smad2CA resulted in a shift of the dll1 IMZ domain towards the ectoderm. GO, gastrula organizer. Scale bar: 0.2 mm.
To evaluate if this shift of dll1 and hes4 expression was correlated with a shift in the boundaries between germ layers, we analyzed the expression of their specification markers. Smad2CA also significantly and cell-autonomously repressed the mesodermal marker tbxt but induced it in neighboring cells (Fig 9A, A’, and D). In contrast, the endodermal sox17a domain was significantly expanded, invading the mesoderm (Fig 9B, B’, and E), whereas the neural marker sox2 was significantly suppressed (Fig 9C, C’, and F). Our results indicate that high levels of smad2CA cell-autonomously induce endoderm, repressing the alternative, mesodermal fate, and concomitantly, suppressing dll1 in the IMZ. These endodermal cells induced by smad2CA, in turn, release an intercellular signal that induces mesoderm and dll1 expression in neighboring cells.
Figure 9. Effects of smad2CA on germ layer specification markers at gastrula stage.

(A, B, C) Expression of tbxt (A), sox17a (B), and sox2 (C) revealed by in situ hybridization at gastrula stage in embryos that were injected into one dorsal cell at the four-cell stage with 1 ng of smad2CA-MT mRNA. (A’, B’, C’) Fluorescent images corresponding to the bright field views shown in (A, B, C), respectively, revealing the injected side by the MT immunofluorescence (red), corresponding to the MT epitope encoded by smad2CA-MT mRNA. The change in tbxt, sox17a, and sox2 expression was evaluated by comparing the injected-with the contralateral uninjected side. (A, A’) Smad2CA cell-autonomously repressed the mesoderm specification marker tbxt (red arrowhead) and induced it in neighboring cells (green arrowhead). (B, B’) Smad2CA cell-autonomously induced the endoderm specification marker sox17a (green arrowhead). (C, C’) Smad2CA repressed the neuroectoderm specification marker sox2 (red arrowhead). Scale bars: 0.2 mm. (D, E, F) Graphs comparing the effects on tbxt (D), sox17a (E), and sox2 expression (F) of 1 ng of nuc-lacZ mRNAs as injection control (see Fig S1) and 1 ng of smad2CA-MT mRNA. Results are expressed as the percentage of injected embryos showing decrease (red), decrease + shift (purple), increase (green), or no changes (yellow) for each marker; n; total number of analyzed embryos. N, number of independent experiments. The injection of smad2CA-MT mRNA produced significant changes in comparison to nuc-lacZ mRNA injections as control (Chi square test, ****P < 0.0001). The difference is considered as significant when P < 0.05.
Cerberus is a secretion factor that normally binds to Nodal, BMP4, and Wnt proteins, inhibiting their activity. A truncated form, Cerberus-short (Cer-S), only retains the ability to bind Nodal (Piccolo et al, 1999). Thus, we injected cer-S mRNA, which has been successfully employed as a general Nodal antagonist to inhibit mesoderm and endoderm induction in plenty of works (Piccolo et al, 1999; Engleka et al, 2001; Kofron et al, 2004; Castro Colabianchi et al, 2021). On the injected side, cer-S suppressed dll1 in the IMZ (Fig 8B, B’, and H; also compare with uninjected control in Fig 8D’) and hes4 in the NIMZ (Fig 8F, F’, and I), demonstrating that Nodal is necessary for establishing their MZ domains.
Since nodal5/6 induce nodal1/2/4 (Takahashi et al, 2000), we wondered if the smad2CA-induced intercellular signal that activates dll1 and hes4 in neighboring territories involves Nodal. To test this hypothesis, we co-injected smad2CA and cer-S. We found that, on the injected side, cer-S prevented the smad2CA-induced ectopic, non-cell-autonomous activation of dll1 (Fig 8C, C’, and H; also compare with uninjected control in Fig 8D’’) and hes4 (Fig 8G, G’, and I). This confirms that Nodal non-cell-autonomously mediates the induction of dll1 and hes4 produced by smad2CA.
Overall, our results demonstrate that Nodal signaling positions the MZ expression domains of a gene encoding a Notch ligand (dll1) and a Notch-target gene (hes4) responsive to Dll1/Notch1 signaling in the MZ.
Discussion
The Xenopus MZ is a transition area between germ layers where their limits are defined during gastrulation. We show that Nodal signaling and the Churc1 cascade, operating in the developing endomesoderm and neuroectoderm, respectively, position a Notch signaling territory in the MZ. A Dll1 domain is set on the IMZ, from where it activates hes4 expression in the NIMZ through the Notch1 receptor. This Notch signaling territory, in turn, ensures mesoderm and neuroectoderm delimitation, thus refining germ layer segregation. The model integrating Churc1, Nodal, and Notch pathways in the induction and segregation of germ layers is presented in Fig 10. Below, we discuss our results and the evidence collected from other works supporting this model (for the detailed experimental evidence, see Table S1).
Figure 10. Model integrating the network involving Churc1, Nodal and Notch-dependent pathways in the induction and segregation of germ layers in the Xenopus MZ.

During blastula stages, Nodal and Churc1 roughly outline neuroectoderm (blue) and endomesoderm (yellow/red) presumptive territories in the NIMZ and IMZ, respectively, contributing to establishing and restricting dll1 expression to the IMZ during gastrulation. dll1 is repressed in the NIMZ, where churc1 is active, and induced through a relay Nodal cascade in the pre-involuted mesoderm in the IMZ, where churc1 is inactive. High Nodal favors endoderm (yellow) over mesoderm specification (red). Endodermal cells, in turn, emit a lower wave of Nodal signaling, promoting mesoderm specification and dll1 expression in the IMZ pre-involuted mesoderm. Dll1 signaling activates the Notch1 pathway on the NIMZ, which represses mesoderm specification through hes4 and promotes neuroectoderm, thus refining the boundaries between them. Notch1 activity (perhaps triggered by another Dll/Jag ligand) contributes to endomesoderm segregation in the IMZ, favoring endoderm over mesoderm. White bold letters/thicker lines: regionally active pathways. Small gray letters/thinner gray lines: regionally inactive pathways. Green and pink lines represent positive and negative regulation, respectively. Full lines: direct regulation, with the strongest strength of connection according to experimental evidence. Broken lines: proposed regulation according to the available experimental evidence. See Table S1 summarizing the findings of the present work and experimental evidence from references supporting this model (Hopwood et al, 1989; Coffman et al, 1990; Frank & Harland, 1991; Harvey, 1991; Smith et al, 1991; Essex et al, 1993; von Dassow et al, 1993; Gurdon et al, 1994, 1995; Jones et al, 1995; Hudson et al, 1997; Joseph & Melton, 1997; Mizuseki et al, 1998; Steinbach et al, 1998; Clements et al, 1999, 2003; Kofron et al, 1999; Osada & Wright, 1999; Remacle et al, 1999; Verschueren et al, 1999; Watanabe & Whitman, 1999; Wittenberger et al, 1999; Yasuo & Lemaire, 1999; Agius et al, 2000; Eisaki et al, 2000; Lerchner et al, 2000; Osada et al, 2000; Takahashi et al, 2000; Weber et al, 2000; Davis et al, 2001; Hill, 2001; Engleka et al, 2001; Howell et al, 2002; Papin et al, 2002; Schohl & Fagotto, 2002; Yang et al, 2002; López et al, 2003, 2005; Sheng et al, 2003; Tsuji et al, 2003; Abe et al, 2004; Nitta et al, 2004, 2007; Sinner et al, 2004, 2006; Cui, 2005; Yamaguti et al, 2005; Steiner et al, 2006; Zamparini et al, 2006; Howard et al, 2007; van Grunsven et al, 2007; Cao et al, 2008, 2012; Miazga & McLaughlin, 2009; Luxardi et al, 2010; Revinski et al, 2010; Sakano et al, 2010; Kinoshita et al, 2011; Rousso et al, 2011; Skirkanich et al, 2011; Matsukawa et al, 2012; Aguirre et al, 2013; Bates et al, 2013; Gentsch et al, 2013; Chiu et al, 2014; Vega-López et al, 2015; Wills & Baker, 2015; Reid et al, 2016; Session et al, 2016; Charney et al, 2017a; 2017b; Karimi et al, 2018).
Figure S4. Smad2/3, Foxh1 and Tbxt (Xbra) binding near the Xenopus tropicalis dll1 gene during gastrulation.

ChIP-Seq analysis data of NF10.5 embryos and NF11-12.5 embryos from Chiu et al (2014) and Gentsch et al (2013). Snapshots were obtained from Xenbase (Karimi et al, 2018) (http://www.xenbase.org/, RRID:SCR_003280) and show the gene structure (gene model, upper track), the tracks of ChIP-peaks calls for Smad2/3, FoxH1 and Tbxt binding (pink boxes), and the tracks of their corresponding ChIP-seq profiles (blue, red, and green, respectively). Two biological replicates are shown for Smad2/3 ChIP-seq binding.
Figure S5. Smad2/3, Foxh1 and Tbxt (Xbra) binding near the Xenopus tropicalis myod1 gene during gastrulation.

ChIP-Seq analysis data of NF10.5 embryos and NF11-12.5 embryos from Chiu et al (2014) and Gentsch et al (2013). Snapshots were obtained from Xenbase (Karimi et al, 2018) (http://www.xenbase.org/, RRID:SCR_003280) and show the gene structure (upper track), the tracks of ChIP-peaks calls for Smad2/3, FoxH1 and Tbxt binding (pink boxes), and the tracks of their corresponding ChIP-seq profiles (blue, red, and green, respectively). The myod1 locus corresponds to an assembled scaffold and the gene model is still uncomplete.
Figure S6. Smad2/3, Foxh1 and Tbxt (Xbra) binding near the Xenopus tropicalis nodal4 gene during gastrulation.

ChIP-Seq analysis data of NF10.5 embryos and NF11-12.5 embryos from Chiu et al (2014) and Gentsch et al (2013). Snapshots were obtained from Xenbase (Karimi et al, 2018) (http://www.xenbase.org/, RRID:SCR_003280) and show the gene structure (gene model, upper track), the tracks of ChIP-peaks calls for Smad2/3, FoxH1 and Tbxt binding (pink boxes), and the tracks of their corresponding ChIP-seq profiles (blue, red, and green, respectively).
Figure S7. Smad2/3, Foxh1 and Tbxt (Xbra) binding near the Xenopus tropicalis notch1 gene during gastrulation.

ChIP-Seq analysis data of NF10.5 embryos and NF11-12.5 embryos from Chiu et al (2014) and Gentsch et al (2013). Snapshots were obtained from Xenbase (Karimi et al, 2018) (http://www.xenbase.org/, RRID:SCR_003280) and show the gene structure (gene model, upper track), the tracks of ChIP-peaks calls for Smad2/3, FoxH1 and Tbxt binding (pink boxes), and the tracks of their corresponding ChIP-seq profiles (blue, red, and green, respectively).
Figure S8. Smad2/3 and Foxh1 binding near the Xenopus tropicalis tbxt (Xbra) gene during gastrulation.

ChIP-Seq analysis data of NF10.5 embryos from Chiu et al (2014). Snapshots were obtained from Xenbase (Karimi et al, 2018) (http://www.xenbase.org/, RRID:SCR_003280) and show the gene structure (upper track), the tracks of ChIP-peaks calls for Smad2/3 and FoxH1 (pink boxes), and the tracks of their corresponding ChIP-seq profiles (blue and red, respectively). Two biological replicates are shown for Smad2/3 ChIP-seq binding.
Role of churc1 in Xenopus germ layer development
In this work, we found that Xenopus churc1 expression already is detected at mid-blastula, when a massive wave of zygotic transcription begins (Collart et al, 2014). churc1 mRNA is present in the dorsal ectoderm at the onset of neural induction, which begins at the blastula BCNE center (Kuroda et al, 2004). Expression is restricted to the presumptive neuroectoderm, persisting in the sox2 territory at early gastrula and developing neural plate. Although the avian CHURC1 pattern was not reported in pregastrula embryos, Xenopus (this work) and chicken orthologs (Sheng et al, 2003) are similarly expressed from the beginning of gastrulation. In Xenopus, churc1 transcripts are present in cells undergoing neural induction but absent from the involuting endomesodermal lineage (this work). This pattern is consistent with a role in neuroectoderm development in frogs, as previously proposed for birds, where CHURC1 prevents the activation of key mesodermal genes and blocks cell ingression through the primitive streak by activating ZEB2 (Sheng et al, 2003). In Xenopus, zeb2 encodes a transcriptional repressor expressed in the dorsal ectoderm fated to become the neural plate (Eisaki et al, 2000; van Grunsven et al, 2000; Papin et al, 2002). Here, we show that in Xenopus, churc1 expression overlaps the zeb2 domain and that both zeb2 homeologs contain putative Churc1 binding sites near their predicted promoters (this work), resembling their distribution in the human ZEB2 gene (Sheng et al, 2003). Moreover, through overexpression, knockdown, and rescue experiments, we show that churc1 positively regulates zeb2 in vivo and controls germ layer development during Xenopus gastrulation.
It was reported that churc1 overexpression prevented tbxt induction by FGF in the Xenopus animal cap assay and that both, churc1 and churc1VP16, but not churc1EnR, suppressed tbxt in Xenopus and chicken embryos, suggesting a transcriptional activator role for Churc1 that indirectly represses tbxt (Sheng et al, 2003). While these authors reported that churc1EnR could not repress tbxt, we show that it strongly expanded the Xenopus tbxt domain, which invaded the territory normally occupied by the neuroectoderm. By extending the analysis to other germ layer markers and performing knockdown experiments, we demonstrate that normally, churc1 not only inhibits mesoderm specification but also disfavors endoderm development whilst favors neuroectodermal fates in Xenopus, since sox2 expression was suppressed with churc1EnR or reduced with churc1 MO, and this was accompanied by a complementary expansion of the involuting lineages.
According to the most recent version of the X. laevis genome (v10.1), churc1 is present as a singleton (churc1.S, Xenbase XB-GENEPAGE-853239). Therefore, it is unlikely that the milder effects of churc1 MO compared with the churc1EnR construct are due to compensation by another homeolog. It is also unlikely that churc1EnR produces stronger, off-target effects than churc1 MO because of competition with other endogenous Churc1-related proteins. Eukaryotic Churchill proteins form a unique family characterized by a zinc-binding region not shared with other zinc finger domain proteins (NCBI CDD pfam06573) and there appear to be no paralogues in eukaryotes for the only member of this family. On the other hand, it is not uncommon that milder effects are obtained with morpholinos than with dominant-negative constructs with potent transcriptional regulation domains. Indeed, milder effects of churc1 MO than those obtained with a churc1EnR construct were also observed in zebrafish embryos (Londin et al, 2007). churc1EnR was designed to potently repress all Churc1-target genes, whereas knockdown with churc1 MO probably does not completely prevent churc1 translation. In theory, a higher dose of churc1 MO might result in a stronger translational inhibition of endogenous churc1 mRNA, but in our hands, injection of 40 ng of churc1 MO resulted in high lethality, making impossible the analysis of germ layer phenotypes. Therefore, all analyses were done with 20 ng. The target sequence for the churc1 MO employed in this study spans 23 nucleotides of the 5′UTR sequence, just upstream of the ATG translational start site. Although with different strengths, the effects of churc1 MO and churc1EnR were similar, and church1 MO effects were rescued by co-injection of churc1 mRNA lacking the 5′ UTR. All this evidence indicates that the effects of blocking churc1 function either with churc1EnR or with churc1 MO were specific.
In conclusion, Xenopus churc1 normally controls the limit of involution by exerting opposite functions on neuroectoderm and endomesoderm development. churc1 is expressed in the non-involuting lineages where it restricts endomesoderm and favors neuroectoderm development, while its absence from the IMZ lineage allows endomesoderm development (Fig 10).
In chick embryos, CHURC1 was proposed to foster epiblast competence to respond to neural inducers (Sheng et al, 2003). This was based on the observation that, when electroporated at Hamburger-Hamilton stage 4 (HH4, definitive primitive streak) in the chick epiblast of the area opaca (which is competent to respond to neural inducers from an ectopic GO until HH4, but normally does not contribute to neural tissue), CHURC1 could sensitize these cells to activate SOX2 expression after implanting an ectopic GO at HH5 stage (Sheng et al, 2003). However, electroporation at intermediate primitive streak stages (HH3) with CHURC1VP16 did not affect SOX2 expression, despite strongly repressing the mesodermal markers TBXT and TBX6 (Sheng et al, 2003). Here we show that churc1 mRNA could increase sox2 expression at gastrula stage in Xenopus, as long as the expression of the gene encoding the neural inducer Chrd.1 was not severely abolished. However, unlike our injections at the four-cell stage in Xenopus, electroporation of CHURC1VP16 DNA in chick embryos was performed after the onset of gastrulation. These differences in experimental conditions may account for the dissimilarities in the results of sox2 expression between species, where neural induction is thought to begin before gastrulation (Kuroda et al, 2004; Stern, 2005, 2006). Indeed, the gene encoding the neural inducer CHRD is already expressed at pregastrula stages in the precursors of the GO in chick embryos (Streit et al, 1998) as well as its ortholog chrd.1 is expressed at pregastrula stages in the BCNE in Xenopus (Kuroda et al, 2004). Therefore, activating the CHURC1 cascade after the onset of gastrulation might be too late to induce SOX2 expression, as shown in chicken (Sheng et al, 2003).
In this work, we also show that the activating Churc1 form suppressed dll1 expression, whereas churc1EnR and churc1 MO expanded the dll1 domain over the NIMZ. Therefore, churc1 prevents dll1 expression in the NIMZ, restricting it to the IMZ. Since churc1 is already expressed at mid-blastula (this work), thus preceding the onset of dll1 expression in the IMZ at early gastrula (López et al, 2005), our evidence indicates that churc1 is upstream of the Dll1/Notch1 cascade previously proposed to refine the limit of involution during germ layer segregation (Revinski et al, 2010).
In addition, previous findings (summarized in Table S1 and Fig 10) support that the transcriptional repressor Zeb2 might be mediating the role of Churc1 in promoting neural fate and preventing the activation of tbxt, dll1, and sox17 (endomesoderm program) in the Xenopus NIMZ. Xenopus zeb2 overexpression neuralized animal caps without inducing mesoderm (Eisaki et al, 2000). Mouse Zeb2 binds the X. tbxt promoter in vitro and represses X. tbxt in vivo at gastrula stage (Verschueren et al, 1999). ZEB2 binding sites in the X. tbxt promoter are necessary to restrict tbxt expression to the IMZ, since they prevent ectodermal ectopic expression (Remacle et al, 1999; Lerchner et al, 2000). Mouse Zeb2 cell-autonomously repressed tbxt in Xenopus in an immediate-early way. Conversely, a dominant negative Xenopus Zeb2 (fused to the VP16 transactivating domain) activated tbxt and sox17a in animal caps, in an immediate-early way (Papin et al, 2002). However, Xenopus zeb2 knockdown did not affect tbxt expression, although it did block neural development (Nitta et al, 2004). These authors suggested that other members of the Zeb2 family of transcription factors might cooperate in repressing tbxt expression outside the IMZ.
Nodal positions a Notch signaling territory in the MZ
In this work, we show that constitutively active Smad2CA cell-autonomously induced the endodermal marker sox17a and repressed tbxt, dll1, and hes4. In addition, cells at a distance from those expressing the highest levels of SmadCA ectopically activated tbxt, dll1, and hes4. This non-cell autonomous induction was mediated by Nodal secreted by those cells expressing the highest levels of Smad2CA. In addition, there is plenty of evidence that tbxt is repressed by high- and induced by low levels of Nodal signaling, whereas sox17a is induced by high levels of Nodal and represses tbxt cell-autonomously (Gurdon et al, 1994, 1995; Latinkić et al, 1997; Yasuo & Lemaire, 1999; Weber et al, 2000; Engleka et al, 2001) (Table S1 and Fig 10). Therefore, the model we present in Fig 10 contemplates that Nodal signaling, initially activated in the vegetal hemisphere by VegT (see the Introduction section), induces Smad2 phosphorylation (pSmad2, the active form of Smad2) in the endomesoderm. In those cells receiving the highest levels of Nodal signaling, Smad2 activity is strongest, promoting endoderm specification and cell-autonomously repressing mesoderm specification and dll1, probably through sox17 (Table S1). In turn, these endodermal cells signal to their neighbors through a second wave of Nodal, which in lower doses induces mesoderm specification, tbxt, and dll1 expression. In the IMZ, tbxt positively contributes to the activation of dll1 in the presumptive pre-involuted mesoderm, possibly directly and through the activation of myod1 (Table S1). Interestingly, Zeb2 binds to the sequence 5′-CACCT, which overlaps with the E2 box sequence 5′-CACCTG, which is recognized by some bHLH transcription factors like Myod1. This suggests that Zeb2 might be repressing target genes by competing with positive regulators like Myod1 (Verschueren et al, 1999).
The sequential Nodal activation cascade described above contributes to endoderm and mesoderm segregation from the endomesoderm, ensuring that dll1 is expressed in the presumptive, pre-involuted mesoderm. In turn, from the pre-involuted mesoderm in the IMZ, Dll1 activates the Notch1 cascade on the NIMZ, promoting sox2 expression and neuroectoderm specification, while repressing tbxt and mesoderm specification through hes4. Interestingly, two homeodomain binding sites at the tbxt regulatory region are necessary to repress this gene in the ectoderm at mid-gastrula. Between them, there is a putative Rbpj binding site of unknown significance (Lerchner et al, 2000), suggesting that tbxt might be directly controlled by Notch/Rbpj signaling.
Concluding remarks
churc1 transcripts are present in the presumptive neuroectoderm at mid-blastula transition and persist during gastrulation in Xenopus. churc1 favors neuroectoderm over endomesoderm development, positively regulates zeb2, and prevents the expression of the gene encoding the Notch ligand Dll1 in the neuroectoderm. churc1 is not expressed in the IMZ, thus relieving tbxt, dll1, and sox17a to be transcribed in this region.
On the other hand, through a relay cascade, Nodal signaling prevents dll1 expression in the endoderm but induces it in the presumptive mesoderm. Thus, Nodal signaling controls the position of the MZ stripe of Dll1/Notch activity alongside endomesoderm induction and segregation between endoderm and mesoderm.
Once the mesoderm was induced by Nodal signaling and churc1 has delineated the presumptive neuroectoderm territory, the activation of dll1 in the IMZ refines the boundaries between mesoderm and neuroectoderm through the notch1/hes4 cascade. In addition, we have previously proposed that Notch1 signaling also contributes to endomesoderm segregation and this might be triggered by another Dll/Jag ligand, distinct from Dll1 (Table S1 and Fig 10) (Revinski et al, 2010).
Materials and Methods
Embryological manipulations, RNA synthesis, morpholinos, and injections
Albino and wild-type X. laevis embryos were obtained using standard methods by natural mating or by in vitro fertilization (Sive et al, 2010) from adult animals obtained from Nasco, and staged according to Nieuwkoop and Faber (1994). Protocols were approved by the Laboratory Animal Welfare and Research Committee (CICUAL) from Facultad de Medicina, Universidad de Buenos Aires.
Synthetic capped mRNAs for microinjection were obtained as follows. Plasmids smad2CA-Myc-tag (MT) (in pCS2+MT) (gift from Uwe Strähle) (Müller et al, 2000), cer-S (in pSC2+) (gift from Eddy de Robertis) (Bouwmeester et al, 1996), nicd1-MT (in pCS2+MT) (Chitnis et al, 1995) (gift from Chris Kintner), cyt-lacZ (in pCS2+), nuc-lacZ (in pCS2+) (gifts from David Turner) (Turner & Weintraub, 1994) were digested with NotI; churc1 (in pSC2+) (gift from Claudio Stern) (Sheng et al, 2003) was digested with SacII. They were in vitro transcribed with the mMESSAGE mMACHINE Sp6 Kit (AM1340; Ambion). Plasmids churc1EnR (in pUT-EnR MT) and churc1Vp16 (in pUT-VP16) (gift from Claudio Stern) (Sheng et al, 2003) were digested with EcoRI and in vitro transcribed with the T7 Megascript transcription kit (AM1334; Ambion) with a 4:1 cap analog:GTP ratio, using m7G(5′)ppp(5′)G (AM8050; Ambion) and T3 Megascript transcription kit (AM1330; Ambion) with a 4:1 cap analog:GTP ratio, using m7G(5′)ppp(5′)G (AM8050; Ambion), respectively. Capped mRNAs were purified with the RNeasy mini kit (74104; QIAGEN).
Translation blocking antisense morpholino oligonucleotides (MO) were used for churc1 (5′-GTCGCGCTCCTAACTACGGATAC-3′) and notch1 (5′-GCACAGCCAGCCCTATCCGATCCAT-3′) (Gene Tools). The notch1 MO was previously used and validated in works by our group and by other authors (López et al, 2003; Revinski et al, 2010; Sakano et al, 2010; Acosta et al, 2011; Castro Colabianchi et al, 2018). As control morpholino (control MO), we used the standard control oligo or the random control oligo 25-N (Gene Tools).
Injections were delivered into the animal hemisphere at ∼30–40° from the equator of one dorsal cell at the four-cell stage in wild-type embryos or in one cell at the two-cell stage in albino embryos. The injected amounts of synthetic mRNAs and morpholinos are indicated in the figures. The injections included molecular tracers such as 40 ng of Dextran Oregon Green 488, MW 10000, anionic lysine fixable (DOG, D7171; Thermo Fisher Scientific), 40 ng of Dextran, Fluorescein, 10,000 MW, anionic, lysine fixable (FD, D1820; Thermo Fisher Scientific), or 20 ng of Dextran, Biotin, 10,000 MW, lysine fixable (BDA-10000, D1956; Thermo Fisher Scientific). The injected side was detected by revealing the distribution of the co-injected tracer, as previously described (Revinski et al, 2010); of β-galactosidase activity for the lacZ constructs, as previously described (Franco et al, 1999), or of the Myc-tag epitope (MT) encoded by the injected mRNA, as described below.
ISH and immunodetection
Plasmids for obtaining antisense RNA probes for whole-mount ISH were linearized with the appropriate restriction enzyme and in vitro transcribed with the appropriate RNA polymerase as follows: dll1, with XhoI/T7 (gift from Eric Bellefroid) (Chitnis et al, 1995); not, with HindIII/T7 (pBS-KS-Xnot plasmid, gift from David Kimelman) (von Dassow et al, 1993); sox2, with EcoRI/T7 (pBS-sox2 plasmid, gift from Yoshiki Sasai) (Kishi et al, 2000); tbxt, with SalI/SP6 (αbra-pSP64T plasmid, gift from Abraham Fainsod) (Smith et al, 1991); sox17a, with SmaI/T7 (pBS-SK-sox17a plasmid, gift from Hugh Woodland) (Hudson et al, 1997); hes4, with BamHI/T7 (pBS-SK+-hes4 plasmid, gift from Dave Turner) (Turner & Weintraub, 1994); churc1, with BamHI/T7 (pSC2+churc1 plasmid, gift from Claudio Stern); zeb2, with PstI/T3 (pCRscript.Xsip1 plasmid, gift from James C. Smith) (van Grunsven et al, 2000).
The preparation of digoxigenin-labeled antisense RNA probes and the whole-mount ISH procedure were performed as previously described (Pizard et al, 2004), except that the proteinase K step was omitted. We were not able to detect churc1 transcripts by our standard ISH conditions, perhaps explaining why the expression pattern was still unavailable. However, with slight modifications to our protocol, by lowering 5°C the hybridization temperature and prolonging the alkaline phosphatase (AP) reaction for 24 h in an alkaline phosphatase buffer with suboptimum pH to prevent background staining (Kinoshita et al, 2006), we could visualize a distinct expression pattern. Therefore, for churc1, the ISH procedure included the following modifications: the prehybridization, hybridization, and SSC washing steps were performed at 55°C instead of 60°C; 0.2×, 1×, and 2× SSC concentrations were tested for the washing steps and gave similar results; the digoxigenin-AP labeled probe was revealed using a pH:7.5 AP buffer (100 mM Tris pH 7.5, 50 mM MgCl2, 100 mM NaCl, 5 mM levamisole) (Kinoshita et al, 2006). After ISH, pigmented embryos were bleached as previously described (Acosta et al, 2011).
Embryos injected with smad2CA-mt mRNA were fixed overnight at 4°C with MEMPFA, transferred to 100% ethanol, and kept at −20°C until being processed for ISH. After the ISH procedure, embryos were processed for immunodetection of the MT epitope as follows. They were rehydrated in 50% methanol in MAB (100 mM maleic acid, 150 mM NaCl pH7.5), washed with MAB, and incubated for 5 min at room temperature in blocking buffer (2% Blocking Reagent; Roche, Cat. no. 11 096 176 001, prepared in MAB). Then, embryos were incubated overnight at 4°C with the primary antibody (anti-c-Myc IgG1, mouse monoclonal antibody; Hybridoma Bank, 910E) diluted 1/200 in blocking buffer, washed five times, 60 min each with MAB, and incubated overnight at 4°C in the dark with the secondary antibody (anti mouse IgG+IgM [H+L] Alexa-594 [Jackson 115-585-044]) diluted 1/200 in blocking buffer. Then, the antibody was washed five times, 60 min each, with MAB and transferred to 1× PBS for visualization and image acquisition. The MT epitope encoded by the nicd1-mt construct was detected by immunohistochemistry as previously described (López et al, 2005). Embryos were photographed in an MVX10 fluorescence microscope (Olympus) equipped with a DP72 camera (Olympus).
Bioinformatic analysis
X. laevis is one of many allotetraploid species derived from the fusion of two diploid ancestor species. Therefore, it contains two different subgenomes, named L (for long) and S (for short) because their chromosomes differ in length. After allotetraploidization, the orthologs derived from the diploid L and S ancestors became L and S “homeologs” in allotetraploid species. In X. laevis, around 56% of the homeolog pairs (as in the case of zeb2), were retained, whereas other homeologs from the L or S subgenomes were lost. The remaining ones are present as “singletons” (as in the case of churc1) (Kondo & Taira, 2022).
For sequence retrieval and characterization of both X. laevis zeb2 homeologs, the zeb2.S and zeb2.L open reading frame and upstream intergenic sequences were downloaded from Xenbase (https://www.xenbase.org/). The transcription initiation sites were predicted by Promoter 2.0 Prediction Server (Knudsen, 1999). Then, a subsequence of 4,340 and 4,662 bp upstream from the predicted transcription initiation site, for zeb2.S and zeb2.L respectively, were further analyzed.
For background (bg) sequence generation, nucleotide compositions for both X. laevis zeb2 homeologs’ regions of interest were obtained with DNA Stats through the Bioinformatics.org server (Stothard, 2000). Then, 10,000 simulated random sequences with the same length and nucleotide composition as the zeb2.S and zeb2.L regions of interest were generated with the RANDNA tool (Piva & Principato, 2006).
For both biological and simulated sequences, the DNA Pattern Find tool (Stothard, 2000) was used to find all motifs matching the Position Weight Matrix (PWM) derived from the in vitro DNA binding selection assay (SELEX assay) previously determined for chicken CHURC1 protein (Sheng et al, 2003). After motif quantification, a one-sample Z-test was conducted using the distributions3 R-package version 0.1.2 (R Team, 2017). The sequence logos were generated using the MotifStack R package v1.34 (Ou et al, 2018).
For the Likelihood analysis of Churc1 binding, first, we calculated the probability of each motif in every background (bg) sequence for zeb2.S and zeb2.L, i.e., P(NGGGNNi|bg zeb2.S) and P(NGGGNNi|bg zeb2.L) according to the nucleotide composition used to generate the bg sequences. Then, we calculated the probabilities of each site for both simulated and biological sequences using the PWM from Sheng et al (2003), i.e., P(NGGGNNi|SELEX Churc1 motif). Finally, the Log-likelihood for each site was calculated as LogL (NGGGNNi) = Log [(P(NGGGNNi)|Selex Churc1 motif)/(P(NGGGNNi)|bg)]. To evaluate the distribution of Churc1 binding Log likelihoods in biological and background sequences, first, all motifs present in the 10,000 simulated sequences were pooled. Then, we randomly selected from the pool the same number of motifs present in each biological zeb2 region. A non-parametric Kruskal-Wallis sum of ranks test was performed. Finally, we replicated the test 1,000 times with a new random selection of simulated Churc1 binding motifs from the pool each time.
A Shapiro-Wilk normality test was conducted to evaluate the normality of the distribution of LogL from the SELEX experiment (Log LSELEX). Next, we assumed as being “successful” those motifs with a Log L higher than the mean Log LSELEX value, and as a “failure” those motifs with a Log L lower than the mean Log LSELEX value. Then, through Monte Carlo simulations (MonteCarlo R package v1.09) (Hallgren, 2013), we compared the distribution of “successful” motifs of the biological regions against the simulated sequences to do an A/B test comparing two β distributions (100,000 events simulation). We used an a priori β distribution of 0.35.
The local enrichment of putative Churc1 binding sites was analyzed using a 150-nucleotides sliding window to study the distribution of putative Churc1 binding site motifs along each zeb2 homeolog region of interest. The global enrichment was evaluated using the motifcounter R package v 1.20.0 (Kopp, 2017). For the calculation of the P-value, a compound Poisson approximation was used.
Data collection and statistics
Sibling embryos were randomly allocated to control or experimental groups and fixed when untreated control siblings reached the desired stage. For each injected embryo, the ISH expression domain of the analyzed marker was compared between the injected side and the contralateral non-injected side. Results are expressed as a percentage of the total number (n) of embryos with the indicated phenotypes, which are described in the main text or the figure legends. The number of biological replicates (N) analyzed is indicated for each set of experiments in the figures. Biological replicates represent batches of embryos from independent mating pairs. For statistical analysis of ISH results, a Chi-square test was applied using the GraphPad Software and the results are included in the figures. Differences were considered significant when P < 0.05. The main text details statistical analysis for in silico assays of the X. laevis zeb2 sequences.
Supplementary Material
Acknowledgements
We thank the following colleagues for providing us with DNAs: Eric Bellefroid (dll1), Eddy De Robertis (chrd.1, cer-S), Abraham Fainsod (tbxt), David Kimelman (not), Yoshiki Sasai (sox2), James C Smith (zeb2), Uwe Strähle (smad2CA), Claudio Stern (churc1 plasmids), David Turner (lacZ plasmids, hes4), Hugh Woodland (sox17a). We are grateful to Marianela Ceol Retamal, María Mercedes Olivera, Andrea Pecile, Manuel Ponce, and Ezequiel Yamus for animal husbandry. Research was supported by Agencia Nacional de Promoción Científica y Tecnológica, Argentina (PICT 2011-1559, PICT 2014-2020, and PICT 2019-01439 grants to SL López); Consejo Nacional de Investigaciones Científicas y Técnicas, Argentina (PIP 2012-0508, PIP 2015-0577, and PIP 2021-1818 grants to SL López); Escuela ORT, Argentina (Subsidio a la Investigación. Programa de Prácticas en Investigación Científica, 2019, grant to SL López).
Author Contributions
MB Favarolo: conceptualization, formal analysis, investigation, visualization, methodology, and writing—original draft, review, and editing.
DR Revinski: formal analysis, investigation, visualization, and writing—review and editing.
MJ Garavaglia: conceptualization, formal analysis, visualization, methodology, and writing—original draft, review, and editing.
SL López: conceptualization, resources, formal analysis, supervision, funding acquisition, investigation, visualization, methodology, project administration, and writing—original draft, review, and editing.
Conflict of Interest Statement
The authors declare that they have no conflict of interest.
References
- Abe T, Furue M, Myoishi Y, Okamoto T, Kondow A, Asashima M, Myoishi Y, Okamoto T, Kondow A, Asashima M (2004) Activin-like signaling activates Notch signaling during mesodermal induction. Int J Dev Biol 48: 327–332. 10.1387/ijdb.041838ta [DOI] [PubMed] [Google Scholar]
- Acosta H, López SL, Revinski DR, Carrasco AE (2011) Notch destabilises maternal beta-catenin and restricts dorsal-anterior development in Xenopus. Development 138: 2567–2579. 10.1242/dev.061143 [DOI] [PubMed] [Google Scholar]
- Agius E, Oelgeschläger M, Wessely O, Kemp C, de Robertis EM (2000) Endodermal nodal-related signals and mesoderm induction in Xenopus. Development 127: 1173–1183. 10.1242/dev.127.6.1173 [DOI] [PMC free article] [PubMed] [Google Scholar]
- Aguirre CE, Murgan S, Carrasco AE, López SL (2013) An intact brachyury function is necessary to prevent spurious axial development in Xenopus laevis. PLoS One 8: e54777. 10.1371/journal.pone.0054777 [DOI] [PMC free article] [PubMed] [Google Scholar]
- Bates TJD, Vonica A, Heasman J, Brivanlou AH, Bell E (2013) Coco regulates dorsoventral specification of germ layers via inhibition of TGFβ signalling. Development 140: 4177–4181. 10.1242/dev.095521 [DOI] [PMC free article] [PubMed] [Google Scholar]
- Bouwmeester T, Kim SH, Sasai Y, Lu B, Robertis EMD (1996) Cerberus is a head-inducing secreted factor expressed in the anterior endoderm of Spemann[R8S2Q1M7]s organizer. Nature 382: 595–601. 10.1038/382595a0 [DOI] [PubMed] [Google Scholar]
- Bray SJ (2016) Notch signalling in context. Nat Rev Mol Cell Biol 17: 722–735. 10.1038/nrm.2016.94 [DOI] [PubMed] [Google Scholar]
- Cao Q, Zhang X, Lu L, Yang L, Gao J, Gao Y, Ma H, Cao Y (2012) Klf4 is required for germ-layer differentiation and body axis patterning during Xenopus embryogenesis. Development 139: 3950–3961. 10.1242/dev.082024 [DOI] [PubMed] [Google Scholar]
- Cao Y, Siegel D, Oswald F, Knóchel W (2008) Oct25 represses transcription of nodal/activin target genes by interaction with signal transducers during xenopus gastrulation. J Biol Chem 283: 34168–34177. 10.1074/jbc.m803532200 [DOI] [PMC free article] [PubMed] [Google Scholar]
- Castro Colabianchi AM, Revinski DR, Encinas PI, Baez MV, Monti RJ, Rodríguez Abinal M, Kodjabachian L, Franchini LF, López SL (2018) Notch1 is asymmetrically distributed from the beginning of embryogenesis and controls the ventral center. Development 145: dev159368. 10.1242/dev.159368 [DOI] [PubMed] [Google Scholar]
- Castro Colabianchi AM, Tavella MB, Boyadjián López LE, Rubinstein M, Franchini LF, López SL (2021) Segregation of brain and organizer precursors is differentially regulated by Nodal signaling at blastula stage. Biol Open 10: bio051797. 10.1242/bio.051797 [DOI] [PMC free article] [PubMed] [Google Scholar]
- Charney RM, Forouzmand E, Cho JS, Cheung J, Paraiso KD, Yasuoka Y, Takahashi S, Taira M, Blitz IL, Xie X, et al. (2017. a) Foxh1 occupies cis-regulatory modules prior to dynamic transcription factor interactions controlling the mesendoderm gene program. Dev Cell 40: 595–607.e4. 10.1016/j.devcel.2017.02.017 [DOI] [PMC free article] [PubMed] [Google Scholar]
- Charney RM, Paraiso KD, Blitz IL, Cho KWY (2017. b) A gene regulatory program controlling early Xenopus mesendoderm formation: Network conservation and motifs. Semin Cell Dev Biol 66: 12–24. 10.1016/j.semcdb.2017.03.003 [DOI] [PMC free article] [PubMed] [Google Scholar]
- Chitnis A, Henrique D, Lewis J, Ish-Horowicz D, Kintner C (1995) Primary neurogenesis in Xenopus embryos regulated by a homologue of the Drosophila neurogenic gene Delta. Nature 375: 761–766. 10.1038/375761a0 [DOI] [PubMed] [Google Scholar]
- Chiu WT, Charney Le R, Blitz IL, Fish MB, Li Y, Biesinger J, Xie X, Cho KWY (2014) Genome-wide view of TGF/Foxh1 regulation of the early mesendoderm program. Development 141: 4537–4547. 10.1242/dev.107227 [DOI] [PMC free article] [PubMed] [Google Scholar]
- Clements D, Cameleyre I, Woodland HR (2003) Redundant early and overlapping larval roles of Xsox17 subgroup genes in Xenopus endoderm development. Mech Dev 120: 337–348. 10.1016/s0925-4773(02)00450-1 [DOI] [PubMed] [Google Scholar]
- Clements D, Friday RV, Woodland HR (1999) Mode of action of VegT in mesoderm and endoderm formation. Development 126: 4903–4911. 10.1242/dev.126.21.4903 [DOI] [PubMed] [Google Scholar]
- Coffman C, Harris W, Kintner C (1990) Xotch, the Xenopus homolog of Drosophila notch. Science 249: 1438–1441. 10.1126/science.2402639 [DOI] [PubMed] [Google Scholar]
- Collart C, Owens NDL, Bhaw-Rosun L, Cooper B, de Domenico E, Patrushev I, Sesay AK, Smith JN, Smith JC, Gilchrist MJ (2014) High-resolution analysis of gene activity during the Xenopus mid-blastula transition. Development 141: 1927–1939. 10.1242/dev.102012 [DOI] [PMC free article] [PubMed] [Google Scholar]
- Cui Y (2005) Hairy is a cell context signal controlling Notch activity. Develop Growth Differ 47: 609–625. 10.1111/j.1440-169x.2005.00823.x [DOI] [PubMed] [Google Scholar]
- Dale L, Slack JM (1987) Fate map for the 32-cell stage of Xenopus laevis. Development 99: 527–551. 10.1242/dev.99.4.527 [DOI] [PubMed] [Google Scholar]
- Davis RL, Turner DL, Evans LM, Kirschner MW (2001) Molecular targets of vertebrate segmentation: Two mechanisms control segmental expression of Xenopus hairy2 during somite formation. Dev Cell 1: 553–565. 10.1016/s1534-5807(01)00054-5 [DOI] [PubMed] [Google Scholar]
- Davis RL, Turner DL (2001) Vertebrate hairy and enhancer of split related proteins: Transcriptional repressors regulating cellular differentiation and embryonic patterning. Oncogene 20: 8342–8357. 10.1038/sj.onc.1205094 [DOI] [PubMed] [Google Scholar]
- de Robertis EM, Kuroda H (2004) Dorsal-ventral patterning and neural induction in Xenopus embryos. Annu Rev Cell Dev Biol 20: 285–308. 10.1146/annurev.cellbio.20.011403.154124 [DOI] [PMC free article] [PubMed] [Google Scholar]
- Eisaki A, Kuroda H, Fukui A, Asashima M (2000) XSIP1, a member of two-handed zinc finger proteins, induced anterior neural markers in Xenopus laevis animal cap. Biochem Biophys Res Commun 271: 151–157. 10.1006/bbrc.2000.2545 [DOI] [PubMed] [Google Scholar]
- Engleka MJ, Craig EJ, Kessler DS (2001) VegT activation of Sox17 at the midblastula transition alters the response to nodal signals in the vegetal endoderm domain. Dev Biol 237: 159–172. 10.1006/dbio.2001.0366 [DOI] [PubMed] [Google Scholar]
- Essex LJ, Mayor R, Sargent MG (1993) Expression of Xenopus snail in mesoderm and prospective neural fold ectoderm. Dev Dyn 198: 108–122. 10.1002/aja.1001980205 [DOI] [PubMed] [Google Scholar]
- Favarolo MB, López SL (2018) Notch signaling in the division of germ layers in bilaterian embryos. Mech Dev 154: 122–144. 10.1016/j.mod.2018.06.005 [DOI] [PubMed] [Google Scholar]
- Franco PG, Paganelli AR, López SL, Carrasco AE (1999) Functional association of retinoic acid and hedgehog signaling in Xenopus primary neurogenesis. Development 126: 4257–4265. 10.1242/dev.126.19.4257 [DOI] [PubMed] [Google Scholar]
- Frank D, Harland RM (1991) Transient expression of XMyoD in non-somitic mesoderm of Xenopus gastrulae. Development 113: 1387–1393. 10.1242/dev.113.4.1387 [DOI] [PubMed] [Google Scholar]
- Gentsch GE, Owens NDL, Martin SR, Piccinelli P, Faial T, Trotter MWB, Gilchrist MJ, Smith JC (2013) In vivo T-box transcription factor profiling reveals joint regulation of embryonic neuromesodermal bipotency. Cell Rep 4: 1185–1196. 10.1016/j.celrep.2013.08.012 [DOI] [PMC free article] [PubMed] [Google Scholar]
- Gilbert SF (2014) , 10th edn. edn Developmental Biology. Sunderland, Massachusetts: Sinauer Associates, Inc. [Google Scholar]
- Glavic A, Silva F, Aybar MJ, Bastidas F, Mayor R (2004) Interplay between notch signaling and the homeoprotein Xiro1 is required for neural crest induction in Xenopus embryos. Development 131: 347–359. 10.1242/dev.00945 [DOI] [PubMed] [Google Scholar]
- Gurdon JB, Harger P, Mitchell A, Lemaire P (1994) Activin signalling and response to a morphogen gradient. Nature 371: 487–492. 10.1038/371487a0 [DOI] [PubMed] [Google Scholar]
- Gurdon JB, Mitchell A, Mahony D (1995) Direct and continuous assessment by cells of their position in a morphogen gradient. Nature 376: 520–521. 10.1038/376520a0 [DOI] [PubMed] [Google Scholar]
- Hallgren KA (2013) Conducting simulation studies in the R programming environment. Tutor Quant Methods Psychol 9: 43–60. 10.20982/tqmp.09.2.p043 [DOI] [PMC free article] [PubMed] [Google Scholar]
- Harvey RP (1991) Widespread expression of MyoD genes in Xenopus embryos is amplified in presumptive muscle as a delayed response to mesoderm induction. Proc Natl Acad Sci U S A 88: 9198–9202. 10.1073/pnas.88.20.9198 [DOI] [PMC free article] [PubMed] [Google Scholar]
- Hill CS (2001) TGF-β signalling pathways in early Xenopus development. Curr Opin Genet Dev 11: 533–540. 10.1016/s0959-437x(00)00229-x [DOI] [PubMed] [Google Scholar]
- Hopwood ND, Pluck A, Gurdon JB (1989) MyoD expression in the forming somites is an early response to mesoderm induction in Xenopus embryos. EMBO J 8: 3409–3417. 10.1002/j.1460-2075.1989.tb08505.x [DOI] [PMC free article] [PubMed] [Google Scholar]
- Howard L, Rex M, Clements D, Woodland HR (2007) Regulation of the Xenopus Xsox17α1 promoter by co-operating VegT and Sox17 sites. Dev Biol 310: 402–415. 10.1016/j.ydbio.2007.07.028 [DOI] [PMC free article] [PubMed] [Google Scholar]
- Howell M, Inman GJ, Hill CS (2002) A novel Xenopus Smad-interacting forkhead transcription factor (XFast-3) cooperates with XFast-1 in regulating gastrulation movements. Development 129: 2823–2834. 10.1242/dev.129.12.2823 [DOI] [PubMed] [Google Scholar]
- Hudson C, Clements D, Friday Rv, Stott D, Woodland HR (1997) Xsox17α and -β mediate endoderm formation in Xenopus. Cell 91: 397–405. 10.1016/s0092-8674(00)80423-7 [DOI] [PubMed] [Google Scholar]
- Jones CM, Kuehn MR, Hogan BL, Smith JC, Wright Cv (1995) Nodal-related signals induce axial mesoderm and dorsalize mesoderm during gastrulation. Development 121: 3651–3662. 10.1242/dev.121.11.3651 [DOI] [PubMed] [Google Scholar]
- Joseph EM, Melton DA (1997) Xnr4: A Xenopus nodal-related gene expressed in the spemann organizer. Dev Biol 184: 367–372. 10.1006/dbio.1997.8510 [DOI] [PubMed] [Google Scholar]
- Karimi K, Fortriede JD, Lotay VS, Burns KA, Wang DZ, Fisher ME, Pells TJ, James-Zorn C, Wang Y, Ponferrada VG, et al. (2018) Xenbase: A genomic, epigenomic and transcriptomic model organism database. Nucleic Acids Res 46: D861–D868. 10.1093/nar/gkx936 [DOI] [PMC free article] [PubMed] [Google Scholar]
- Keller R, Danilchik M (1988) Regional expression, pattern and timing of convergence and extension during gastrulation of Xenopus laevis. Development 103: 193–209. 10.1242/dev.103.1.193 [DOI] [PubMed] [Google Scholar]
- Keller R, Davidson LA, Shook DR (2003) How we are shaped: The biomechanics of gastrulation. Differentiation 71: 171–205. 10.1046/j.1432-0436.2003.710301.x [DOI] [PubMed] [Google Scholar]
- Kiecker C, Bates T, Bell E (2016) Molecular specification of germ layers in vertebrate embryos. Cell Mol Life Sci 73: 923–947. 10.1007/s00018-015-2092-y [DOI] [PMC free article] [PubMed] [Google Scholar]
- Kinoshita T, Haruta Y, Sakamoto C, Imaoka S (2011) Antagonistic role of XESR1 and XESR5 in mesoderm formation in Xenopus laevis. Int J Dev Biol 55: 25–31. 10.1387/ijdb.092990tk [DOI] [PubMed] [Google Scholar]
- Kinoshita T, Jullien J, Gurdon JB (2006) Two-dimensional morphogen gradient in Xenopus: Boundary formation and real-time transduction response. Dev Dyn 235: 3189–3198. 10.1002/dvdy.20963 [DOI] [PubMed] [Google Scholar]
- Kishi M, Mizuseki K, Sasai N, Yamazaki H, Shiota K, Nakanishi S, Sasai Y (2000) Requirement of Sox2-mediated signaling for differentiation of early Xenopus neuroectoderm. Development 127: 791–800. 10.1242/dev.127.4.791 [DOI] [PubMed] [Google Scholar]
- Knudsen S (1999) Promoter2.0: For the recognition of PolII promoter sequences. Bioinformatics 15: 356–361. 10.1093/bioinformatics/15.5.356 [DOI] [PubMed] [Google Scholar]
- Kofron M, Demel T, Xanthos J, Lohr J, Sun B, Sive H, Osada SI, Wright C, Wylie C, Heasman J (1999) Mesoderm induction in Xenopus is a zygotic event regulated by maternal VegT via TGFbeta growth factors. Development 126: 5759–5770. 10.1242/dev.126.24.5759 [DOI] [PubMed] [Google Scholar]
- Kofron M, Puck H, Standley H, Wylie C, Old R, Whitman M, Heasman J (2004) New roles for FoxH1 in patterning the early embryo. Development 131: 5065–5078. 10.1242/dev.01396 [DOI] [PubMed] [Google Scholar]
- Kondo M, Taira M (2022) The continuing evolution of the Xenopus genome. In Xenopus. From Basic Biology to Disease Models in the Genomic Era. Fainsod A, Moody SA (eds.), 1st edn. edn. pp 155–171. Boca Raton: CRC Press. https://www.taylorfrancis.com/chapters/oa-edit/10.1201/9781003050230-12/continuing-evolution-xenopus-genome-mariko-kondo-masanori-tairaAvailable at:Accessed March 29, 2022. [Google Scholar]
- Kopp W (2017) motifcounter: R package for analysing TFBSs in DNA sequences. Available at: https://bioconductor.org/packages/release/bioc/html/motifcounter.html. 10.18129/B9.bioc.motifcounter [DOI]
- Kuroda H, Wessely O, Robertis EMD (2004) Neural induction in Xenopus: Requirement for ectodermal and endomesodermal signals via chordin, Noggin, beta-catenin, and Cerberus. PLoS Biol 2: E92. 10.1371/journal.pbio.0020092 [DOI] [PMC free article] [PubMed] [Google Scholar]
- Latinkić BV, Umbhauer M, Neal KA, Lerchner W, Smith JC, Cunliffe V (1997) The Xenopus Brachyury promoter is activated by FGF and low concentrations of activin and suppressed by high concentrations of activin and by paired-type homeodomain proteins. Genes Dev 11: 3265–3276. 10.1101/gad.11.23.3265 [DOI] [PMC free article] [PubMed] [Google Scholar]
- Lerchner W, Latinkic BV, Remacle JE, Huylebroeck D, Smith JC (2000) Region-specific activation of the Xenopus brachyury promoter involves active repression in ectoderm and endoderm: A study using transgenic frog embryos. Development 127: 2729–2739. 10.1242/dev.127.12.2729 [DOI] [PubMed] [Google Scholar]
- Londin ER, Mentzer L, Sirotkin HI (2007) Churchill regulates cell movement and mesoderm specification by repressing Nodal signaling. BMC Dev Biol 7: 120. 10.1186/1471-213x-7-120 [DOI] [PMC free article] [PubMed] [Google Scholar]
- López SL (2022) Chapter 7: Multiple functions of Notch signaling during early embryogenesis (In press). In Xenopus, from Basic Biology to Disease Models in the Genomic Era. Moody SA, Taylor FainsodA (eds.). Boca Raton: Francis CRC Press. [Google Scholar]
- López SL, Paganelli AR, Siri MVR, Ocaña OH, Franco PG, Carrasco AE (2003) Notch activates sonic hedgehog and both are involved in the specification of dorsal midline cell-fates in Xenopus. Development 130: 2225–2238. 10.1242/dev.00443 [DOI] [PubMed] [Google Scholar]
- López SL, Rosato-Siri MV, Franco PG, Paganelli AR, Carrasco AE (2005) The Notch-target gene hairy2a impedes the involution of notochordal cells by promoting floor plate fates in Xenopus embryos. Development 132: 1035–1046. 10.1242/dev.01659 [DOI] [PubMed] [Google Scholar]
- Luxardi G, Marchal L, Thomé V, Kodjabachian L (2010) Distinct Xenopus Nodal ligands sequentially induce mesendoderm and control gastrulation movements in parallel to the Wnt/PCP pathway. Development 137: 417–426. 10.1242/dev.039735 [DOI] [PubMed] [Google Scholar]
- Matsukawa S, Moriyama Y, Hayata T, Sasaki H, Ito Y, Asashima M, Kuroda H (2012) KDEL tagging: A method for generating dominant-negative inhibitors of the secretion of TGF-β superfamily proteins. Int J Dev Biol 56: 351–356. 10.1387/ijdb.123514sm [DOI] [PubMed] [Google Scholar]
- Miazga CM, McLaughlin KA (2009) Coordinating the timing of cardiac precursor development during gastrulation: A new role for notch signaling. Dev Biol 333: 285–296. 10.1016/j.ydbio.2009.06.040 [DOI] [PubMed] [Google Scholar]
- Mizuseki K, Kishi M, Matsui M, Nakanishi S, Sasai Y (1998) Xenopus Zic-related-1 and Sox-2, two factors induced by chordin, have distinct activities in the initiation of neural induction. Development 125: 579–587. 10.1242/dev.125.4.579 [DOI] [PubMed] [Google Scholar]
- Moody SA (1987) Fates of the blastomeres of the 32-cell-stage Xenopus embryo. Dev Biol 122: 300–319. 10.1016/0012-1606(87)90296-x [DOI] [PubMed] [Google Scholar]
- Müller F, Albert S, Blader P, Fischer N, Hallonet M, Strähle U (2000) Direct action of the nodal-related signal cyclops in induction of sonic hedgehog in the ventral midline of the CNS. Development 127: 3889–3897. 10.1242/dev.127.18.3889 [DOI] [PubMed] [Google Scholar]
- Nieuwkoop PD, Faber J (1994) Normal Table of Xenopus laevis (Daudin). New York and London: Garland Publishing. [Google Scholar]
- Nitta KR, Takahashi S, Haramoto Y, Fukuda M, Tanegashima K, Onuma Y, Asashima M (2007) The N-terminus zinc finger domain of Xenopus SIP1 is important for neural induction, but not for suppression of Xbra expression. Int J Dev Biol 51: 321–325. 10.1387/ijdb.062252kn [DOI] [PubMed] [Google Scholar]
- Nitta KR, Tanegashima K, Takahashi S, Asashima M (2004) XSIP1 is essential for early neural gene expression and neural differentiation by suppression of BMP signaling. Dev Biol 275: 258–267. 10.1016/j.ydbio.2004.08.010 [DOI] [PubMed] [Google Scholar]
- Osada SI, Saijoh Y, Frisch A, Yeo CY, Adachi H, Watanabe M, Whitman M, Hamada H, Wright Cv (2000) Activin/nodal responsiveness and asymmetric expression of a Xenopus nodal-related gene converge on a FAST-regulated module in intron 1. Development 127: 2503–2514. 10.1242/dev.127.11.2503 [DOI] [PubMed] [Google Scholar]
- Osada SI, Wright CVE (1999) Xenopus nodal-related signaling is essential for mesendodermal patterning during early embryogenesis. Development 126: 3229–3240. 10.1242/dev.126.14.3229 [DOI] [PubMed] [Google Scholar]
- Ou J, Wolfe SA, Brodsky MH, Zhu LJ (2018) motifStack for the analysis of transcription factor binding site evolution. Nat Methods 15: 8–9. 10.1038/nmeth.4555 [DOI] [PubMed] [Google Scholar]
- Papin C, van Grunsven LA, Verschueren K, Huylebroeck D, Smith JC (2002) Dynamic regulation of Brachyury expression in the amphibian embryo by XSIP1. Mech Dev 111: 37–46. 10.1016/s0925-4773(01)00599-8 [DOI] [PubMed] [Google Scholar]
- Piccolo S, Agius E, Leyns L, Bhattacharyya S, Grunz H, Bouwmeester T, Robertis EMD (1999) The head inducer Cerberus is a multifunctional antagonist of Nodal, BMP and Wnt signals. Nature 397: 707–710. 10.1038/17820 [DOI] [PMC free article] [PubMed] [Google Scholar]
- Piccolo S, Agius E, Lu B, Goodman S, Dale L, de Robertis EM (1997) Cleavage of chordin by xolloid metalloprotease suggests a role for proteolytic processing in the regulation of spemann organizer activity. Cell 91: 407–416. 10.1016/s0092-8674(00)80424-9 [DOI] [PMC free article] [PubMed] [Google Scholar]
- Piva F, Principato G (2006) RANDNA: A random DNA sequence generator. In Silico Biol 6: 253–258. https://content.iospress.com/articles/in-silico-biology/isb00239 [PubMed] [Google Scholar]
- Pizard A, Haramis A, Carrasco AE, Franco P, López SL, Paganelli A (2004) Whole-mount in situ hybridization and detection of RNAs in vertebrate embryos and isolated organs. Curr Protoc Mol Biol 14: 14.9. 10.1002/0471142727.mb1409s66 [DOI] [PubMed] [Google Scholar]
- R Team (2017) R: A Language and Environment for Statistical Computing. Vienna, Austria: R Foundation for Statistical Computing. https://www.r-project.org/Available at:. [Google Scholar]
- Reid CD, Steiner AB, Yaklichkin S, Lu Q, Wang S, Hennessy M, Kessler DS (2016) FoxH1 mediates a Grg4 and Smad2 dependent transcriptional switch in Nodal signaling during Xenopus mesoderm development. Dev Biol 414: 34–44. 10.1016/j.ydbio.2016.04.006 [DOI] [PMC free article] [PubMed] [Google Scholar]
- Remacle JE, Kraft H, Lerchner W, Wuytens G, Collart C, Verschueren K, Smith JC, Huylebroeck D (1999) New mode of DNA binding of multi-zinc finger transcription factors: Delta EF1 family members bind with two hands to two target sites. EMBO J 18: 5073–5084. 10.1093/emboj/18.18.5073 [DOI] [PMC free article] [PubMed] [Google Scholar]
- Revinski DR, Paganelli AR, Carrasco AE, López SL (2010) Delta-Notch signaling is involved in the segregation of the three germ layers in Xenopus laevis. Dev Biol 339: 477–492. 10.1016/j.ydbio.2010.01.010 [DOI] [PubMed] [Google Scholar]
- Rogers CD, Archer TC, Cunningham DD, Grammer TC, Silva Casey EM (2008) Sox3 expression is maintained by FGF signaling and restricted to the neural plate by Vent proteins in the Xenopus embryo. Dev Biol 313: 307–319. 10.1016/j.ydbio.2007.10.023 [DOI] [PMC free article] [PubMed] [Google Scholar]
- Rousso SZ, Schyr RBH, Gur M, Zouela N, Kot-Leibovich H, Shabtai Y, Koutsi-Urshanski N, Baldessari D, Pillemer G, Niehrs C, et al. (2011) Negative autoregulation of Oct3/4 through Cdx1 promotes the onset of gastrulation. Dev Dyn 240: 796–807. 10.1002/dvdy.22588 [DOI] [PubMed] [Google Scholar]
- Stern CD, Charité J, Deschamps J, Duboule D, Durston AJ, Kmita M, Nicolas JF, Palmeirim I, Smith JC, Wolpert L (2006) Head-tail patterning of the vertebrate embryo: One, two or many unresolved problems? Int J Dev Biol 50: 3–15. 10.1387/ijdb.052095cs [DOI] [PubMed] [Google Scholar]
- Sakano D, Kato A, Parikh N, McKnight K, Terry D, Stefanovic B, Kato Y (2010) BCL6 canalizes Notch-dependent transcription, excluding Mastermind-like1 from selected target genes during left-right patterning. Dev Cell 18: 450–462. 10.1016/j.devcel.2009.12.023 [DOI] [PMC free article] [PubMed] [Google Scholar]
- Schohl A, Fagotto F (2002) β-catenin, MAPK and Smad signaling during earlyXenopusdevelopment. Development 129: 37–52. 10.1242/dev.129.1.37 [DOI] [PubMed] [Google Scholar]
- Session AM, Uno Y, Kwon T, Chapman JA, Toyoda A, Takahashi S, Fukui A, Hikosaka A, Suzuki A, Kondo M, et al. (2016) Genome evolution in the allotetraploid frog Xenopus laevis. Nature 538: 336–343. 10.1038/nature19840 [DOI] [PMC free article] [PubMed] [Google Scholar]
- Sheng G, dos Reis M, Stern CD (2003) Churchill, a zinc finger transcriptional activator, regulates the transition between gastrulation and neurulation. Cell 115: 603–613. 10.1016/s0092-8674(03)00927-9 [DOI] [PubMed] [Google Scholar]
- Shook DR, Majer C, Keller R (2004) Pattern and morphogenesis of presumptive superficial mesoderm in two closely related species, Xenopus laevis and Xenopus tropicalis. Dev Biol 270: 163–185. 10.1016/j.ydbio.2004.02.021 [DOI] [PubMed] [Google Scholar]
- Sinner D, Kirilenko P, Rankin S, Wei E, Howard L, Kofron M, Heasman J, Woodland HR, Zorn AM (2006) Global analysis of the transcriptional network controlling Xenopus endoderm formation. Development 133: 1955–1966. 10.1242/dev.02358 [DOI] [PubMed] [Google Scholar]
- Sinner D, Rankin S, Lee M, Zorn AM (2004) Sox17 and beta-catenin cooperate to regulate the transcription of endodermal genes. Development 131: 3069–3080. 10.1242/dev.01176 [DOI] [PubMed] [Google Scholar]
- Sive HL, Grainger RM, Harland RM (2010) Early Development of Xenopus laevis. A Laboratory Manual. Cold Spring Harbor: Cold Spring Harbor Laboratory Press. [Google Scholar]
- Skirkanich J, Luxardi G, Yang J, Kodjabachian L, Klein PS (2011) An essential role for transcription before the MBT in Xenopus laevis. Dev Biol 357: 478–491. 10.1016/j.ydbio.2011.06.010 [DOI] [PMC free article] [PubMed] [Google Scholar]
- Smith JC, Price BM, Green JB, Weigel D, Herrmann BG (1991) Expression of a Xenopus homolog of Brachyury (T) is an immediate-early response to mesoderm induction. Cell 67: 79–87. 10.1016/0092-8674(91)90573-h [DOI] [PubMed] [Google Scholar]
- Snir M, Ofir R, Elias S, Frank D (2006) Xenopus laevis POU91 protein, an Oct3/4 homologue, regulates competence transitions from mesoderm to neural cell fates. EMBO J 25: 3664–3674. 10.1038/sj.emboj.7601238 [DOI] [PMC free article] [PubMed] [Google Scholar]
- Steinbach OC, Ulshöfer A, Authaler A, Rupp RA (1998) Temporal restriction of MyoD induction and autocatalysis during Xenopus mesoderm formation. Dev Biol 202: 280–292. 10.1006/dbio.1998.8993 [DOI] [PubMed] [Google Scholar]
- Steiner AB, Engleka MJ, Lu Q, Piwarzyk EC, Yaklichkin S, Lefebvre JL, Walters JW, Pineda-Salgado L, Labosky PA, Kessler DS (2006) FoxD3 regulation of Nodal in the Spemann organizer is essential for Xenopus dorsal mesoderm development. Development 133: 4827–4838. 10.1242/dev.02663 [DOI] [PMC free article] [PubMed] [Google Scholar]
- Stern CD (2006) Neural induction: 10 years on since the [L8S2Q1M6]default model[R8S2Q1M7]. Curr Opin Cell Biol 18: 692–697. 10.1016/j.ceb.2006.09.002 [DOI] [PubMed] [Google Scholar]
- Stern CD (2005) Neural induction: Old problem, new findings, yet more questions. Development 132: 2007–2021. 10.1242/dev.01794 [DOI] [PubMed] [Google Scholar]
- Stothard P (2000) The sequence manipulation suite: JavaScript programs for analyzing and formatting protein and DNA sequences. Biotechniques 28: 11021104. 10.2144/00286ir01 [DOI] [PubMed] [Google Scholar]
- Stower MJ, Bertocchini F (2017) The evolution of amniote gastrulation: The blastopore-primitive streak transition. Wiley Interdiscip Rev Dev Biol 6: e262. 10.1002/wdev.262 [DOI] [PubMed] [Google Scholar]
- Streit A, Lee KJ, Woo I, Roberts C, Jessell TM, Stern CD (1998) Chordin regulates primitive streak development and the stability of induced neural cells, but is not sufficient for neural induction in the chick embryo. Development 125: 507–519. 10.1242/dev.125.3.507 [DOI] [PubMed] [Google Scholar]
- Takahashi S, Yokota C, Takano K, Tanegashima K, Onuma Y, Goto J, Asashima M (2000) Two novel nodal-related genes initiate early inductive events in Xenopus Nieuwkoop center. Development 127: 5319–5329. 10.1242/dev.127.24.5319 [DOI] [PubMed] [Google Scholar]
- Tsuji S, Cho KWY, Hashimoto C (2003) Expression pattern of a basic helix-loop-helix transcription factor Xhairy2b during Xenopus laevis development. Dev Genes Evol 213: 407–411. 10.1007/s00427-003-0338-4 [DOI] [PubMed] [Google Scholar]
- Turner DL, Weintraub H (1994) Expression of achaete-scute homolog 3 in Xenopus embryos converts ectodermal cells to a neural fate. Genes Dev 8: 1434–1447. 10.1101/gad.8.12.1434 [DOI] [PubMed] [Google Scholar]
- van Grunsven LA, Papin C, Avalosse B, Opdecamp K, Huylebroeck D, Smith JC, Bellefroid EJ (2000) XSIP1, a Xenopus zinc finger/homeodomain encoding gene highly expressed during early neural development. Mech Dev 94: 189–193. 10.1016/s0925-4773(00)00318-x [DOI] [PubMed] [Google Scholar]
- van Grunsven LA, Taelman V, Michiels C, Verstappen G, Souopgui J, Nichane M, Moens E, Opdecamp K, Vanhomwegen J, Kricha S, et al. (2007) XSip1 neuralizing activity involves the co-repressor CtBP and occurs through BMP dependent and independent mechanisms. Dev Biol 306: 34–49. 10.1016/j.ydbio.2007.02.045 [DOI] [PubMed] [Google Scholar]
- Vega-López GA, Bonano M, Tríbulo C, Fernández JP, Agüero TH, Aybar MJ (2015) Functional analysis of Hairy genes in Xenopus neural crest initial specification and cell migration. Dev Dyn 244: 988–1013. 10.1002/dvdy.24295 [DOI] [PubMed] [Google Scholar]
- Verschueren K, Remacle JE, Collart C, Kraft H, Baker BS, Tylzanowski P, Nelles L, Wuytens G, Su MT, Bodmer R, et al. (1999) SIP1, a novel zinc finger/homeodomain repressor, interacts with Smad proteins and binds to 5′-CACCT sequences in candidate target genes. J Biol Chem 274: 20489–20498. 10.1074/jbc.274.29.20489 [DOI] [PubMed] [Google Scholar]
- von Dassow G, Schmidt JE, Kimelman D (1993) Induction of the Xenopus organizer: Expression and regulation of Xnot, a novel FGF and activin-regulated homeo box gene. Genes Dev 7: 355–366. 10.1101/gad.7.3.355 [DOI] [PubMed] [Google Scholar]
- Watanabe M, Whitman M (1999) FAST-1 is a key maternal effector of mesoderm inducers in the early Xenopus embryo. Development 126: 5621–5634. 10.1242/dev.126.24.5621 [DOI] [PubMed] [Google Scholar]
- Weber H, Symes CE, Walmsley ME, Rodaway AR, Patient RK (2000) A role for GATA5 in Xenopus endoderm specification. Development 127: 4345–4360. 10.1242/dev.127.20.4345 [DOI] [PubMed] [Google Scholar]
- Weiss A, Attisano L (2013) The TGFbeta superfamily signaling pathway. Wiley Interdiscip Rev Dev Biol 2: 47–63. 10.1002/wdev.86 [DOI] [PubMed] [Google Scholar]
- Wills AE, Baker JC (2015) E2a is necessary for Smad2/3-dependent transcription and the direct repression of lefty during gastrulation. Dev Cell 32: 345–357. 10.1016/j.devcel.2014.11.034 [DOI] [PMC free article] [PubMed] [Google Scholar]
- Wittenberger T, Steinbach OC, Authaler A, Kopan R, Rupp RA (1999) MyoD stimulates delta-1 transcription and triggers notch signaling in the Xenopus gastrula. EMBO J 18: 1915–1922. 10.1093/emboj/18.7.1915 [DOI] [PMC free article] [PubMed] [Google Scholar]
- Yamaguti M, Cho KWY, Hashimoto C (2005) Xenopus hairy2b specifies anterior prechordal mesoderm identity within Spemann[R8S2Q1M7]s organizer. Dev Dyn 234: 102–113. 10.1002/dvdy.20523 [DOI] [PubMed] [Google Scholar]
- Yang J, Tan C, Darken RS, Wilson PA, Klein PS (2002) β-Catenin/Tcf-regulated transcription prior to the midblastula transition. Development 129: 5743–5752. 10.1242/dev.00150 [DOI] [PubMed] [Google Scholar]
- Yasuo H, Lemaire P (1999) A two-step model for the fate determination of presumptive endodermal blastomeres in Xenopus embryos. Curr Biol 9: 869–879. 10.1016/s0960-9822(99)80391-1 [DOI] [PubMed] [Google Scholar]
- Zamparini AL, Watts T, Gardner CE, Tomlinson SR, Johnston GI, Brickman JM (2006) Hex acts with beta-catenin to regulate anteroposterior patterning via a Groucho-related co-repressor and Nodal. Development 133: 3709–3722. 10.1242/dev.02516 [DOI] [PubMed] [Google Scholar]
- Zhang J, King ML (1996) Xenopus VegT RNA is localized to the vegetal cortex during oogenesis and encodes a novel T-box transcription factor involved in mesodermal patterning. Development 122: 4119–4129. 10.1242/dev.122.12.4119 [DOI] [PubMed] [Google Scholar]
- Zhou M, Yan J, Ma Z, Zhou Y, Abbood NN, Liu J, Su L, Jia H, Guo A-Y (2012) Comparative and evolutionary analysis of the HES/HEY gene family reveal exon/intron loss and teleost specific duplication events. PLoS One 7: e40649. 10.1371/journal.pone.0040649 [DOI] [PMC free article] [PubMed] [Google Scholar]
Associated Data
This section collects any data citations, data availability statements, or supplementary materials included in this article.