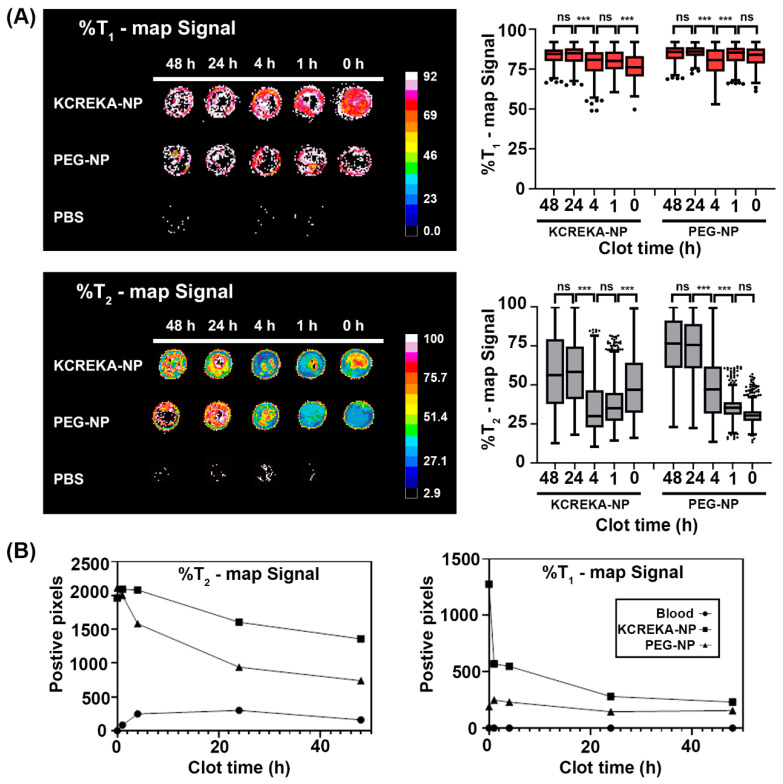
Figure 4.
(A) MRI images and median values of the decrease in T1 and T2 weighted images in relation to the background signal for blood clots of 48, 24, 4, 1 h, and 0 h of age incubated with KCREKA-NPs, PEG-NPs, or PBS. (B) Number of positive pixels above the background signal for the T1 and T2 signals for blood clots of 48, 24, 4, 1 h, and 0 h of age incubated with KCREKA-NPs, PEG-NPs, or PBS. *** p < 0.001 using one way ANOVA followed by Kruskal-Wallis test.

