

Abstract

Studies show limitations in increasing the mass fraction of resin pins in aviation components. The main objective of the present study is to investigate the effect of resin pins with different diameters and numbers on the bending performance and damage mode of sandwich structures with a constant mass fraction of resin pins. The obtained results show that the Φ2 specimen (i.e., the diameter of the resin pin in the sample is 2 mm) increases the load-bearing capacity by 41.8%. The deformation process of sandwich beams with and without resin pins is similar. However, the failure modes are different due to the diameters, amounts, and spacing of resin pins. Moreover, the uncertainty analysis of the experimental results is carried out by CT three-dimensional reconstruction of foam and finite element method (FEM). The obtained results show that the resin absorbed by the cells on the foam surface is the primary source of simulation errors. To resolve this problem, a new method is proposed to estimate the range of experimental results and improve the simulation accuracy by compensating for the diameter of the resin pin.
1. Introduction
Composite foam core sandwich structures mainly consist of fiber-reinforced composite facesheets and a foam core. Carbon-fiber-reinforced plastics (CFRPs) have superior characteristics, such as high specific modulus, high specific strength, proper corrosion resistance, and excellent design ability. Besides, studies show foam with high porosity has remarkable properties, such as low density, high energy absorption capacity, and excellent impact resistance.1,2 Foam core sandwich structures inherit advantages of both materials so that they have been widely used in diverse fields. In engineering applications, these structures are usually subjected to various loads, such as compression, bending, and low- and high-velocity impact loads.3 Under these loads, the foam core of the sandwich structure often fails prematurely. These failures mainly originate from foam pore shearing and local indentation collapse.4,5 Therefore, it is of significant importance to improve the bearing capacity of sandwich beams.
To improve the bearing capacity of the sandwich structure, many solutions, such as stitched sandwich structure,6 box reinforcement and double-T reinforcement,7 carbon nanotube (CNT) reinforcement,8 and Z-pin-reinforced9 structures, have been proposed so far. Among these structures, the stitched sandwich structure and Z-pin resin-forced sandwich structure have been widely applied in engineering applications.
In the 1980s, ultrasound-assisted Z-pin fiber technology was proposed to implant the Z-pin.10 Since then, the influence of Z-pin on the mechanical properties of sandwich structures has been extensively studied. In this regard, Nanayakkara et al.11 showed that the compressive modulus of the foam sandwich structure is positively correlated with the volume of the Z-pin. Selver et al.12 studied the influence of the Z-pin density on the flexural properties of foam sandwich structures. Moreover, Asintha et al.13 and Kaya et al.14 studied the influence of Z-pin on the impact properties of foam core sandwich structures. Later, based on the new concept of stitched foam core sandwich put forward by Stanley et al.,15 Tan et al.,16 Jia et al.,17 and Lascoup et al.,18 studied the impact characteristics of the foam sandwich structure and considered different stitching processing parameters in this regard. Wang et al.19 and Lascoup et al.6 explored the effect of stitching technology on the bending and compression properties of foam core sandwich structures, respectively. Accordingly, it was found that Z-pin and stitching technology can significantly improve the thickness performance of the foam core sandwich structure under bending, compression, and impact properties. However, the molding process of these two methods is complex and special equipment is required. The most fatal thing is that it will destroy the upper and lower panels.
With the development of vacuum-assisted resin injection (VARI) and other liquid molding technologies in the past few years, resin pins have been gradually applied to enhance the mechanical properties of foam core sandwich structures. This mainly originates from a simple process, low cost, and no adverse impact on the panel performance. The resin pins rigidly join the top and bottom facesheets of the panel and improve the resistance of the facesheets and foam core from debonding and increasing the interface strength between the foam core and the facesheets.3 Abdi et al.20 studied the influence of the polymer pin diameter and strain rate on the indentation and compression properties of foam core sandwich structures. Moreover, Jayaram et al.21 fabricated polyester pin-reinforced foam-filled honeycomb sandwich panels and studied their compression and impact properties under different conditions. Eyvazian et al.22 explored the influence of resin pins’ number, arrangement, and diameter on the maximum load, bending strength, and energy absorption characteristics of the foam core sandwich structure, while Anbazhagan et al.23 evaluated these responses under the quasi-static indentation loading. Besides the core perforation strategy, Balıkoğlu et al.24 incorporated a stitching method to enhance the through-the-thickness performances of the sandwich composites with layered/divided foam cores. Yalkin et al.25 conducted a similar study and indicated that “perforated and stitched core” sandwich composites have superior strength.
As clearly pointed out in the previous research, the mechanical properties of foam core sandwich structures steadily rise as the mass fraction of resin pins introduced increases. However, excessive weight can negatively affect the ultralight structures’ efficiency, especially in aerospace applications. Reducing structure mass is an efficient approach to boost energy efficiency and decrease fuel consumption. For example, for Boeing 787, a 20% weight savings results in a 10–12% improvement in fuel efficiency.26 Therefore, there are constraints in the aerospace industry that prevent the mass fraction of resin pins from being increased. The effect of the perforations in the constraining mass is not fully understood. Consequently, it is crucial to investigate the effect of resin pin configurations on the mechanical performance of sandwich structures at a given mass fraction. In this regard, this study aims to determine the effect of uniformly distributed resin pins with varying diameters on the three-point bending properties of foam core sandwich structures when the mass fraction of the resin pin remains constant. In the remainder of this paper, the geometry and material of the sandwich specimens, the experimental setup, and measurement processes are described in Section 2. Section 3 presents the details of a finite element model (FEM) for bending analysis, mainly including a brief introduction of constitutive models and the adopted boundary conditions. Further, the progressive damage mechanism of the sandwich structures is discussed in Section 4. It also involves an uncertainty analysis for examining the influence of microstructure deviation. Finally, conclusions are drawn in Section 5.
2. Experimental Methods
2.1. Materials and Specimen
Sandwich samples consist of carbon fiber/epoxy composite facesheets and closed-cell PMI foam core material reinforced with circular resin pins that also serve as a rigid connection between the top and bottom facesheets. A schematic of the resin pin-reinforced sandwich panel is shown in Figure 1. Both top and bottom facesheets are made of four layers of twill carbon fiber fabrics (AVIC composite Co., Ltd. CF3031, China) with an areal density of 220 g/m2. They have a symmetrical stacking sequence of [0/45/45/0] and a thickness of 1.0 mm. The core material is a 20 mm thick PMI foam (Cashem Advanced Materials Hi-tech Co., Ltd. Cascell 75 WH, China) with a 0.1 g/cm3 density. All perforated cores are squarely drilled with extending through-the-thickness holes using a CNC milling machine, Belotti SKY 3630. This machine can achieve a hole positional accuracy of 0.01 mm and a diameter accuracy of 0.02 mm for foams. The holes are then cleaned using compressed air to eliminate dust and other debris. The resin pins are made of the same polymer material used in the facesheets’ matrix.
Figure 1.

Schematic configurations of the sample.
Sandwich composites were manufactured by the vacuum-assisted resin infusion (VARI) process with the epoxy resin 5284 (Sino composite Co., Ltd. 2040, China). In this process, the resin was first stirred and defoamed to remove the inside air bubbles using vacuum pressure. After all of the materials were packaged, the air bubble-free resin was infused into the carbon fabrics and holes driven by vacuum as 1 bar. These through-thickness perforations helped the resin flow during the infusion process, and the resin in these holes formed the solid pins. The fabrication took place in one step, and thus, the facesheets, foam core, and resin pins could be integrated into one construction. The VARI process is schematically shown in Figure 2. Afterward, the composites were cured at 100 °C for 10 h in an oven. Once the sandwich composite was ready, it was cut into specimens following the ASTM test standards using a waterjet cutting machine. It should be noted that the same procedure was used to prepare the coupon specimens for mechanical property measurements on facesheets.
Figure 2.
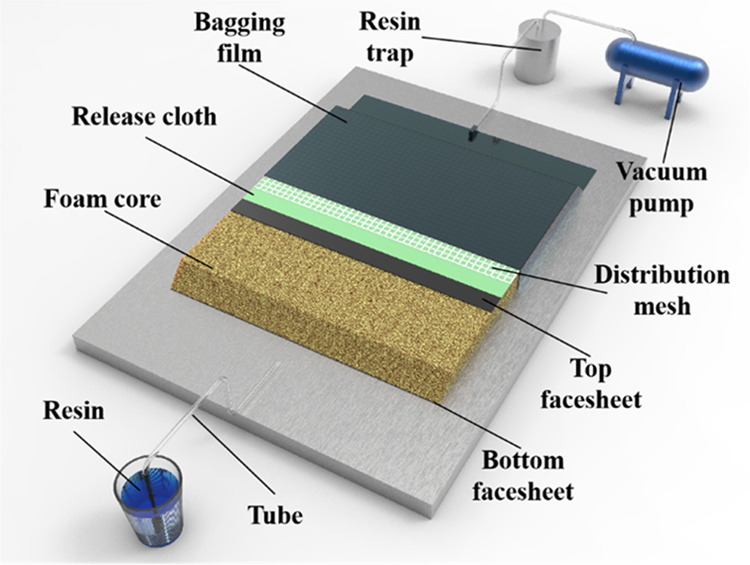
Schematic representation of the VARI process.
The sandwich panel specimens with three different diameters of resin pins, 1, 2, and 3 mm, were prepared for three-point bending tests. To investigate the effect of resin pins on the three-point bending, specimens with no resin pins were also made for comparison. The specimens’ dimension was determined to have a length of 200 mm and a width of 70 mm, according to ASTM C393. The number of resin pins for different diameters was determined following the procedure below. The mass fraction of resin pins was set at 3.0% initially. Accordingly, the perforated foam cores had a hole density of 0.77, 0.19, and 0.09 hole/cm2 with 1, 2, and 3 mm diameter holes, respectively, in the rectangular pattern given in Figure 1. With these values, it was possible to establish the distance between resin pins in the case of uniform distribution. The distances for each resin pin diameter case were adjusted to ensure an integer number of pins along the length and width directions. This procedure yielded a mass fraction of 2.97%. The resulting dimensional characteristics of specimens, including size and pin diameter, are summarized in Table 1.
Table 1. Specifications of the Composite Sandwich Specimens.
| specimen type | L × W × H (mm × mm × mm) | diameter of pins (mm) | number of pins | pin mass fraction | LPP (mm) | WPP (mm) |
|---|---|---|---|---|---|---|
| three-point bending | 200 × 70 × 22 | 0 | 0 | 0 | NA | NA |
| 1 ± 0.01 | 18 × 6 | 2.97% | 10.53 | 10.00 | ||
| 2 ± 0.01 | 9 × 3 | 20.00 | 17.50 | |||
| 3 ± 0.01 | 6 × 2 | 28.57 | 23.33 |
2.2. Experimental Setup
The schematic configuration of the three-point bending test setup is illustrated in Figure 3. This test was carried out on a foam core sandwich structure using a universal testing machine, according to the ASTM C393 standard. The supporting span and diameter of the indenter and supports were 150, 10, and 30 mm, respectively. Moreover, the loading rate was set to 1 mm/min. Each test was repeated three times, and 12 specimens were tested in total.
Figure 3.

Configuration of the test setup: (a) Schematic diagram of the three-point bending test set-up and (b) measurement zone of DIC.
Three-point flexural and flatwise compression tests were carried out using an Instron universal testing machine at a constant loading rate of 1 mm/min. The support span length for three-point flexural tests of both FCS and PRFCS panels was set to be 180 mm. The test for each specimen was repeated three times to make sure the repeatability of test results. The three-point flexural test is illustrated in Figure 3. In three-point flexural tests, the load was applied directly over a row of polymer pins.
The tensile, three-point flexural, and flatwise compression tests were carried out at a constant loading rate of 1 mm/min to determine the tensile and flexural properties of glass/polyester laminate and the compression property of the foam core material, respectively. The support span length for the three-point flexural tests of chopped strand mat glass fiber/polyester laminate was set to be 32 mm, which is 16 times the total thickness of specimens. The details of specimens for experimental tests to determine the mechanical properties of materials are listed in Table 1. During the experiment, the digital image correlation (DIC) technique was applied to detect the displacement and strain fields. The displacement field was computed by dividing the reference image into pixels subsets and tracking the distortions of the image pattern. It should be indicated that these distortions originate from mechanical deformations.27 The measurement zone of DIC is presented in Figure 3.
To obtain the mesostructured foam and carry out uncertainty analysis, the mesostructure characterization of the initial foam sample was conducted using an X-ray 3D imaging system (Cheetah YXLON, Germany) at a nominal resolution of 1.5 μm. Due to the restriction on the allowable dimensions of samples, a cube foam sample with a size of 10 mm × 10 mm × 10 mm was used in CT scan to provide more statistical information on cells. It is worth noting that VGStudio MAX software was used to reconstruct CT slice images and count the equivalent diameter of cells and the thickness of cell walls. The main steps can be summarized as follows: (i) Applying the global thresholding segmentation (TS) method to binarize an image into the solid phase and air phase; (ii) applying the top-hat method28 to recover thin walls not extracted by TS; (iii) calculating the solid fraction and comparing it with the experimental data; then, thresholds were adjusted, and steps (i) and (ii) were repeated until the calculated and measured parameters reached consistently;29 and (iv) applying the classic watershed for cell partitioning and quantifying the cell morphology.30 The reconstructed microstructure and the equivalent diameter of the cells are shown in Figures 4 and 5, respectively. Through the statistical analysis, the equivalent pore diameter of the foam core follows the Gaussian distribution with an average equivalent diameter of 0.45 mm and a variance of 0.03.
Figure 4.

Reconstructed 3D images of the foam: (a) Isometric view of foam mesostructured, (b) sectional view of foam mesostructured, and (c) contour of cell wall thickness.
Figure 5.

Probability distribution of equivalent pore diameter.
3. Finite Element Modeling
3.1. Geometry and Boundary Conditions
To evaluate the damage evolution in the considered sandwich structures under three-point loading, a quasi-static finite element analysis (FEA) was performed using an ABAQUS/explicit solver. The FEA model incorporated the 2D Hashin failure criterion for CFRP facesheets, the pseudo-hyperelastic model for the foam core, and the cohesive zone model for the interface. The top and bottom facesheets were meshed using SC8R elements, an eight-node quadrilateral general-purpose continuum shell elements with reduced integration formulation. The orientation of each ply in facesheets was prescribed by the local material orientation. The foam core and resin pins were meshed using reduced linear integration solid (C3D8R) elements. Enhanced hourglass control is enabled to prevent distortion of the elements. Moreover, the interfaces between layers of facesheets were meshed with a single layer of zero-thickness cohesive (COH3D8) elements. The facesheet–foam interface was defined as a cohesive contact. Meanwhile, the indenter and fixed supports were described as a discrete rigid body and meshed with four-node 3D bilinear rigid quadrilateral (R3D4) elements. The indenter’s displacement controlled the loading process. A hard frictionless contact condition was specified between the indenter and facesheets. The simulation assembly and the types of elements are shown in Figure 6. After a convergence study, the whole system includes 2133840 C3D8R elements, 353920 SC8R elements, 265440 COH3D8 elements, and 6320 R3D4 elements.
Figure 6.
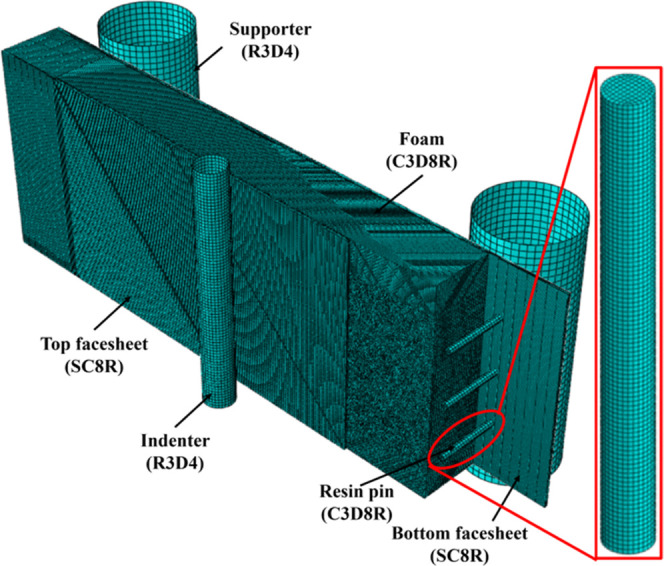
Simulation assembly and the types of elements.
3.2. Constitutive Models of the CFRP Panel, Foam, and Resin
It can be known from ref (24) that the material response along the fiber directions is characterized by damaged elasticity. Thus, the fiber damage variables can be expressed as a function of the effective stress, and the criterion for fiber failure is represented by Φα, which can be assumed to take the form
| 1 |
where α = 1+, 1–, 2+, 2– represent the tensile in 1 direction, compression in 1 direction, tensile in 2 direction and compression in 2 direction, respectively; Xα are the tensile or compressive strengths for uniaxial loading along the fiber directions; and σ̃α are the effective stresses, which can be expressed as follows
| 2 |
where the damage variables dα are controlled by
| 3 |
the damage thresholds rα are initially set to 1, and they increase with increasing damage after the damage initiation (Φα = 1) according to
| 4 |
Aα can be written as follows
| 5 |
where LC is the characteristic length of the element, Gfα is the fracture energy per unit area under uniaxial tensile or compressive loading, and g0 is the elastic energy per unit volume at the point of damage initiation
| 6 |
The shear response of the material is dominated by the matrix, which includes plasticity and damage due to the microcracking of the matrix. The yield behavior of the matrix can be represented as
| 7 |
where σ̃0 is the effective stress at the yield point.
The hardening behavior of the matrix is expressed as
| 8 |
where σ̃y0 is the effective yield stress, C is the hardening constant, and p is the power index.
The damage occurs when the value of Φ12 is equal to or greater than one, and Φ12 can be represented as
| 9 |
where S is the shear stress at the beginning of matrix damage, and the threshold r12 is assumed to increase after damage initiation
| 10 |
The shear damage variable d12 is assumed to increase with the logarithm of r12 before the maximum value d12max is reached
| 11 |
The interface between the adjacent layers was simulated by the bilinear traction-separation mode. The mechanical behavior of the interface was considered linear elasticity until the stress reached the critical strength. Then the damage occurred, and the interface stiffness decreased as the load increased. The initial damage was determined by the quadratic stress criterion, and the damage evolution law was specified by the Benzeggagh–Kenane fraction criterion. The properties of the interface are presented in Table 2.
Table 2. Properties of the Cohesive Zone.
| property | value | standard |
|---|---|---|
| interface stiffness for mode I, Knn(MPa/mm) | 158 823 | |
| interface stiffness for mode II, Kss(MPa/mm) | 158 823 | |
| interface stiffness for mode III, Ktt(MPa/mm) | 158 823 | |
| interface strength for mode I, Nmax (MPa) | 69.3 | ASTM D638 |
| interface strength for mode II, Tmax (MPa) | 69.3 | |
| interface strength for mode III, Smax (MPa) | 69.3 | |
| interlaminar fracture toughness for mode I, GIc(mJ/mm2) | 0.36 | ASTM D5528 |
| interlaminar fracture toughness for mode II, GIIc(mJ/mm2) | 1.4 | ASTM D7905 |
| interlaminar fracture toughness for mode III, GIIIc(mJ/mm2) | 1.4 | |
| material constant, η | 1.45 | |
| density, ρ (kg/m3) | 1100 |
Properties of carbon fiber/epoxy resin material properties obtained through experiments are presented in Table 3.
Table 3. Properties of Composite Facesheets.
| property | value | standard |
|---|---|---|
| tensile and compression modulus along 1 direction, E1+/– (GPa) | 51.2 | ASTM D3039 |
| tensile and compression modulus along 2 direction, E2+/– (GPa) | 47.8 | ASTM D3039 |
| poisson’s ratio, υ12 | 0.3 | ASTM D3039 |
| shear modulus, G12 (GPa) | 3000.5 | ASTM D3518 |
| longitudinal tensile strength, XT (MPa) | 580.4 | ASTM D3039 |
| longitudinal compressive strength, XC (MPa) | 434.2 | ASTM D6641 |
| transverse tensile strength, YT (MPa) | 484.3 | ASTM D3039 |
| transverse compressive strength, YC (MPa) | 381.7 | ASTM D6641 |
| shear strength, S (MPa) | 89.5 | ASTM D3518 |
| density, ρ (kg/m3) | 1650 | |
| thickness, T (mm) | 0.25 | |
| fiber tensile energy release rate, GftC(mJ/mm2) | 35.1 | ASTM D5045 |
| fiber compressive energy release rate, GfcC(mJ/mm2) | 15.2 | |
| matix tensile energy release rate, GmtC(mJ/mm2) | 35.4 | ASTM D5045 |
| matrix compressive energy release rate, GmcC(mJ/mm2) | 14.9 | |
| effective yield stress, σ̃y0 (MPa) | 81.0 | ASTM D3518 |
| hardening constant, C | 0 | |
| power index, p | 0 |
PMI foam could be simulated using the low-density foam model in Abaqus, a pseudo hyperelastic formulation, and its failure mechanics incorporated the maximum principal stress criterion.31 As the compression and shear modes dominated the core deformation during the bending process, the current study required as input the stress–strain response of the foam for the uniaxial compression and tensile test. The Poisson’s ratio of the foam was assumed to be zero, implying that the evaluation of the stress–strain response became uncoupled along the principal deformation directions. Figure 7 demonstrates that the obtained simulation results were in good agreement with the experiments, thereby verifying the accuracy of the model. The uniaxial compression passes through three typical regimes: a linear elastic range, a plateau of elastic buckling or plastic yielding, and a densification region, where the cellular structure is squeezed upon itself. The foam properties were tested through experiments, following relevant ASTM standards, as shown in Table 4.
Figure 7.

Force–displacement curves of foam under uniaxial compression load.
Table 4. Properties of Foam.
| property | value | standard |
|---|---|---|
| elastic modulus, E (MPa) | 92 | ASTM D638 |
| poisson’s ratio, υ | 0.3 | ASTM D638 |
| shear modulus, G (MPa) | 13.6 | ASTM C273 |
| tensile strength, TS (MPa) | 2.45 | ASTM D638 |
| compressive strength, CS (MPa) | 1.39 | ASTM D1621 |
| shear strength, SS (MPa) | 1.12 | ASTM C273 |
| density, ρ (kg/m3) | 75 |
It was found that the resin exhibits elasticity, yielding, and progressive damage behaviors under external loads. Based on these behaviors, the stress–strain response of the resin matrix can be determined.32 The yield and plastic part is modeled using the Drucker–Prager model and the damage initiation is determined by the ductile damage criterion.33 The extended linear Drucker–Prager model was defined in the form below
| 12 |
where p is the hydrostatic stress and β is the slope of yield surface, which can be expressed as follows
| 13 |
| 14 |
| 15 |
where ϕ is the friction angle, CS is the compressive strength, and TS is the tensile strength. In eq 12, d represents the cohesion of the resin, and it can be expressed as follows
| 16 |
where k is the ratio of triaxial tensile yield stress to triaxial compressive yield stress.
| 17 |
Moreover, the yield stress can be expressed as follows
| 18 |
where t is the yield stress, q is the von-Mises equivalent stress, and r is the third invariant of deviatoric stress. The properties of 2040/2047 resins are presented in Table 5.
Table 5. Properties of 2040/2047 Epoxy Resin.
| property | value | standard |
|---|---|---|
| elastic modulus, E (MPa) | 2900.0 | ASTM D638 |
| poisson’s ratio, υ | 0.3 | ASTM D638 |
| tensile strength, TS (MPa) | 69.3 | ASTM D638 |
| compressive strength, CS (MPa) | 82.7 | ASTM D695 |
| density, ρ (kg/m3) | 1100 | |
| elongation at break (%) | 6.0 |
3.3. Analysis of the Loading Speed
To improve the simulation accuracy of the three-point bending test, it is necessary to ensure that the loading process is quasi-static. In this process, the values of the kinetic energy (KE) do not exceed 1% of the values of the internal energy (IE). The model with a size of 200 mm × 20 mm × 22 mm is used, and three loading times equal to 0.01, 0.05, and 0.1 s are considered. Figure 8 indicates that a loading speed of 0.05 s not only ensures quasi-static loading but also improves the calculation efficiency.
Figure 8.

KE/IE ratio for a loading time of 0.05 s.
4. Results and Discussion
4.1. Experimental Results
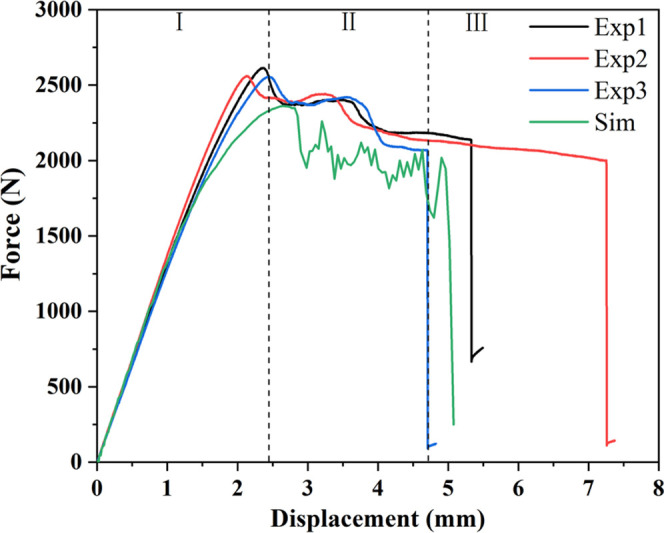
Figure 9 shows the force–displacement curves of four types of foam core sandwich structures under three-point bending loads. It is observed that adding resin pins into the foam core can significantly improve the bending strength and bending stiffness of the foam core sandwich structure. Figure 8 reveals that compared with the Φ0 sample, the average peak force of the Φ3 sample increased from 2276 to 2577 N, which represents an increase of 13.2%. For the Φ1 sample, the peak force increased from 2276 to 3019 N, indicating a increase of 32.6%. The Φ2 specimen has the most obvious improvement in the three-point bending performance, where the peak force increased from 2276 to 3228 N, representing an increase of 41.8%.
Figure 9.

Force–displacement curves of four foam core sandwich structures under three-point bending loads.
4.2. Failure Analysis During the Bending Process
Figure 10 shows the force–displacement curves of experiment and simulation, the corresponding deformation, and the damage process under three-point bending loads on Φ0 specimen. Analysis of the strain state of a point on the force–displacement curve shows that the deformation of the Φ0 specimen is concentrated under the indenter and the deformation degree on both sides of the indenter is symmetrical. The deformation process can be mainly divided into three stages: quasi-elastic (stage I), initial failure (stage II), and postfailure (stage III).34 In stage I, linear elastic characteristics appear. Moreover, as the displacement increases gradually, the corresponding force rises rapidly until it reaches the peak value at the quasi-elastic stage (point A). Once the peak force is reached, the force drops rapidly to a relatively low value (point B). Figure 10b reveals that the closer to the indenter, the greater the deformation of the specimen. Accordingly, a sudden drop of the load at point A may be attributed to the fracture of the uppermost facesheet because of local bending. This conclusion is also confirmed by the simulation results in Figure 10c. Figure 10d shows that in stage II, the unbroken upper facesheet and the foam near the indenter bear local compressive stress and damage. Meanwhile, the simulation and experimental results diverge in stage III. Since the upper panel was completely broken previously in the experimental results, the shear stress of the upper and lower facesheets on the foam was greatly reduced. Consequently, the sandwich failure mode mainly originates from the collapse of the foam cells under the indenter. This phenomenon is presented in Figure 10e. However, the upper panel in the simulation results is not completely broken. Figure 10f shows that as the loading progresses and when the shear stress in the foam approaches the strength limit, a through-thickness crack appears in the foam, and then the sandwich fails.
Figure 10.

Φ0 specimen: (a) Force–displacement curves, (b) contours of strain field obtained from DIC, (c) damage of the upper facesheet, (d) damage of the foam, (e) damage of the foam and the upper facesheet in the experiment, and (f) final failure of the foam.
The strain field contour in Figure 11b shows that the deformation in the Φ1 spacemen is concentrated under the indenter and the deformation degree around the indenter is symmetrical before the load reaches point B. The deformation process can be mainly divided into three stages: quasi-elastic (stage I), initial failure (stage II), and total failure (stage III). In stage I, as the displacement increases gradually, the corresponding force increases rapidly until it reaches point A, where the force–displacement curve reaches the peak value. Then, the deformation enters stage II, where the force value gradually decreases as the displacement increases. Figure 11b indicates that before point B, the high strain area is concentrated under the indenter. Consequently, the sample failure initiates under the indenter. Figure 11c shows that the force drop after the peak value on the force–displacement curve mainly originates from the foam damage. The foam damage initiates under the indenter. This may be attributed to the large compressive stress, so the initial damage to foam is in the form of indentation. However, the indentation failure mode does not lead to the final failure of the sandwich beam. More specifically, the core material experiences flexure and shear stress during the static loading.31 As the indenter moves further down, the shear stress gradually increases. Since the strength of the facesheet–foam interface is greater than the shear strength of the foam, the interface remains intact, but the foam cell wall near the interface fails from the middle to both ends. Subsequently, Figure 11f shows that cracks appear in the foam depth. Then, cracks propagate along the lower facesheet–foam interface and cause the sandwich structure to fail eventually. It should be noted that no debonding failure occurs at the facesheet–foam interface during the entire loading process. Failure initiates from the foam cell wall near the interface. Another reason for the load drop in stage II is the damage to resin pins. In this regard, Figure 11e indicates that the resin pins near the indenter are damaged. This may be attributed to the significant compressive stress and bending moment. Consequently, crushing and buckling are the main damage modes.
Figure 11.

Φ1 specimen: (a) force–displacement curves, (b) contour of strain field obtained by DIC, (c) damage of the foam, (d) damage of the upper facesheet, (e) damage of the resin pins under the indenter, and (f) the final failure of the foam.
Figure 12a indicates that the deformation process of Φ2 can be mainly divided into three stages, including quasi-elastic (stage I), initial failure (stage II), and total failure (stage III). It should be indicated that the force–displacement curve in this sample significantly differs from that of the other three samples. In stage I, as the displacement increases gradually, the corresponding force rises rapidly. When the indenter reaches point A, the slope of the curve drops significantly. Figure 12b shows that this phenomenon may be attributed to the fiber compression damage on the upper panel, indicating that the overall rigidity of the sandwich and the load-bearing capacity is reduced. Moreover, Figure 12c reveals that as the indenter in stage II moves downward, the foam near the upper part of the resin pins is subjected to the strong compressive stress (σ11) and gradually fails. Meanwhile, Figure 12d indicates that resin pins are damaged under the indenter due to the local compressive stress (σ33). Accordingly, the curve slope gradually approaches zero after point B. At point C, the deformation process enters stage III, and a through-thickness crack appears in the foam, which may be attributed to the shear stress. Moreover, Figure 12e shows that the uppermost layer of the upper facesheet breaks due to the compressive stress, and then the sandwich beam fails.
Figure 12.

Φ2 specimen: (a) Force–displacement curves, (b) damage of the upper facesheet, (c) damage of the foam, (d) damage of the resin pins under the indenter, and (e) final failure of the foam and upper facesheet.
Figure 13 demonstrates that Φ1 and Φ3 specimens have similar deformation processes. However, excessive large spacing of resin pins weakens the supporting effect of resin pins on the panel so that the resin pin is not damaged anymore. Similarly, Φ3 and Φ0 samples have similar failure modes.
Figure 13.
Force–displacement curves of the Φ3 specimen.
4.3. Uncertainty Analysis
The performed analysis demonstrates that there is a certain mismatch between the simulation and the experimental results. Figure 14 shows that as the load-bearing effect of the resin pins becomes more prominent (the peak force increases), the calculated load-bearing capacity (peak value of the curve) of the sandwich panel has a greater mismatch compared with the experimental results.
Figure 14.
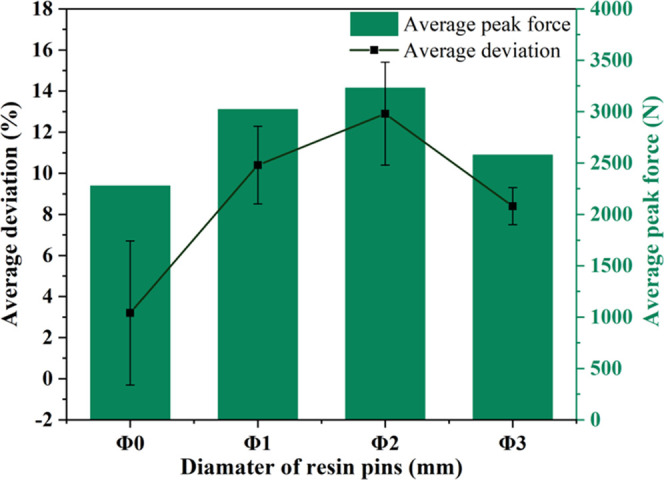
Average deviation analysis graph.
PMI foam is a rigid closed-cell foam. Figure 4a shows that PMI foam consists of irregular polyhedrons and cell walls between adjacent polyhedrons on a mesoscale. The polyhedron is a gas-filled hollow structure, which forms during the foaming process. The cell wall is an entity with an average thickness of about 0.05 mm. However, surface cells have opened-cell structures since there are no cell walls to close the hollow polyhedrons. It is inferred that when the sandwich beam forms in the VARI process, the resin fills the foam surface cells and cures, thereby improving the mechanical properties of the sandwich beam to a certain extent. Figure 15 shows the microscopic morphology of 1 mm diameter resin pin’s cross section under an Olympus BX53M microscope. Apparently, the resin penetrates the adjacent foam cells to form a cylindrical pin with a coarse surface. To verify this conjecture, the CT results were analyzed. Figure 5 indicates that the average, minimum, and maximum equivalent diameters of foam cells are 0.45, 0.15, and 0.85 mm, respectively. The used foam is a kind of closed-cell type; therefore, the resin cannot flow into foam cores. However, the surface layer of the foam hole after molding is a mixture of resin and cell wall. Since the foam porosity is about 94%, the resin properties are used to approximately replace the mixture of resin and cell wall in all calculations.
Figure 15.

Microscopic cross section of resin pins.
Due to the complex microstructure, it is challenging to directly evaluate the influence of the process-induced morphology of resin pins on the mechanical properties of sandwich structures. In this study, the perfect cylinder with an equivalent diameter is used to represent pins’ actual geometry. In this case, the Φ1 sample with the smallest diameter and the largest number of resin pins is more prone to error. Moreover, the Φ3 sample has the largest spacing of resin pins and the smallest number of resin pins, thereby having the weakest effect on the bearing capacity of the sandwich beam. Therefore, the Φ2 sample with a reasonable enhancement effect and drilling uncertainty is selected to verify the proposed hypothesis. The diameter of the resin pin after compensation by the cells that absorb the resin on the foam surface changed to 2.1 mm (Φ2.1 sample), 2.52 mm (Φ2.52 sample), and 3.1 mm (Φ3.1 sample). Figure 16 presents the obtained results in this regard. It is observed that the structural stiffness, peak load, and failure mode of the Φ2.1 sample are very close to those of the Φ2 sample. However, there it differs from the experimental results. The highest agreement with the experimental results was achieved in the force–displacement curve of the Φ2.52 sample, where resin pins are compensated by cells with the average equivalent cell diameter (0.26 mm). This also verifies the CT statistics and the previous inference. For the Φ3.1 sample, since the maximum equivalent cell diameter (0.55 mm) is used to replace all cells in the foam surface, the structural stiffness is significantly greater than the experimental results and other simulation results.
Figure 16.

Force–displacement curves of different equivalent pore diameters.
Figure 16 indicates that the curves of samples Φ2.52 and Φ3.1 are different from the curves of samples Φ2, Φ2.1, Φ1, and Φ3, indicating that the damage model of samples Φ2.52 and Φ3.1 is significantly different from that of other samples. Considering Φ2.52 as an example, the structure suddenly fails after the sandwich reaches the bearing limit, so the load drops sharply. Since the rigidity of the reinforced resin pins under the indenter is much greater than that of the foam, the resin pins play the role of the main load-bearing component during the loading process. Therefore, indentation failure does not occur in the foam under the indenter. This may be attributed to significant local compressive stress. However, under the combined action of the bending load and the adhesive force of the resin pin to the foam hole wall, a stress concentration zone forms on the foam hole wall (σ13 and σ23). These zones are presented in Figure 15a,b, respectively. Figure 17d indicates that when the maximum principal stress reaches the strength limit, the foam near the hole wall fails first, and the damaged area near the bottom is much larger than other parts. Accordingly, the first sudden drop appears in the load on the simulated force–displacement curve. However, the structure did not fail immediately after the occurrence of local damage, and the load further increased as the indenter descended. Subsequently, the crack propagates in the damaged area at the bottom and penetrates the entire thickness. Consequently, the structure fails, as shown in Figure 17e. However, Figure 17d reveals that slight fiber compression damage appears only on the top layer facesheet.
Figure 17.

(a) Force–displacement curves, (b) damage of the upper facesheet, (c) damage of the foam hole, (d) final failure of the foam, and (e) propagation path of crack.
The thickness of the foam core was 20 mm. This thickness reduces the impact of low-probability foam cells on the performance of the sandwich beam after absorbing the resin. If the foam thickness is set to 10 mm or less, low-probability cells, after absorbing the resin, will have a greater impact on the sandwich performance. It is inferred that for the sample reinforced with 2 mm diameter resin pins, the curve between Φ2.1 and Φ3.1 samples has a reasonable deviation with experimental results. Accordingly, this method can be used to effectively improve the simulation accuracy of the Φ2 sample and reasonably estimate the range of experimental results of the Φ2 sample. It should be emphasized that this method is also applicable to samples reinforced with resin pins of other sizes and manufactured by other LCM processes.
5. Conclusions
In the present study, the influence of the uniform distribution of resin pins of different diameters and different numbers in the foam core of the sandwich beam on the deformation and failure of the specimen under three-point bending loads was investigated when the mass fraction of resin pins was constant. The main achievements and conclusions can be summarized as follows:
-
(1)
Adding resin pins to the foam core sandwich structure can significantly improve the load-bearing capacity of the specimen. Compared with Φ0 specimen, the load-carrying capacity of the foam core sandwich structure in the Φ1, Φ2, and Φ3 specimens increased by 32.6, 41.8, and 13.2%, respectively.
-
(2)
The deformation process of sandwich beams with and without resin pins is similar. However, the failure modes are also different due to the different diameter, number, and spacing of resin pins.
-
(3)
The resin absorbed by the cells on the foam surface is the main source of simulation errors. A new method is proposed to estimate the range of experimental results and improve the simulation accuracy by compensating for the diameter of the resin pin.
Acknowledgments
The authors are grateful for financial support from the “National Natural Science Foundation of China” (11902256).
The authors declare no competing financial interest.
References
- Li Q. M.; Sun Y. L. Dynamic compressive behaviour of cellular materials: A review of phenomenon, mechanism and modelling. Int. J. Impact Eng. 2018, 112, 74–115. 10.1016/j.ijimpeng.2017.10.006. [DOI] [Google Scholar]
- Xiong J.; Du Y.; Mousanezhad D.; Eydani Asl M.; Norato J.; Vaziri A. Sandwich Structures with Prismatic and Foam Cores: A Review. Adv. Eng. Mater. 2019, 21, 1800036 10.1002/adem.201800036. [DOI] [Google Scholar]
- Abdi B.; Azwan S.; Abdullah M. R.; Ayob A.; Yahya Y.; Xin L. Flatwise compression and flexural behavior of foam core and polymer pin-reinforced foam core composite sandwich panels. Int. J. Mech. Sci. 2014, 88, 138–144. 10.1016/j.ijmecsci.2014.08.004. [DOI] [Google Scholar]
- Flores-Johnson E. A.; Li Q. M. Experimental study of the indentation of sandwich panels with carbon fibre-reinforced polymer face sheets and polymeric foam core. Composites, Part B 2011, 42, 1212–1219. 10.1016/j.compositesb.2011.02.013. [DOI] [Google Scholar]
- Yang F. P.; Lin Q. Y.; Jiang J. J. Experimental study on fatigue failure and damage of sandwich structure with PMI foam core. Fatigue Fract. Eng. Mater. Struct. 2015, 38, 456–465. 10.1111/ffe.12246. [DOI] [Google Scholar]
- Lascoup B.; Aboura Z.; Khellil K.; Benzeggagh M. On the mechanical effect of stitch addition in sandwich panel. Compos. Sci. Technol. 2006, 66, 1385–1398. 10.1016/j.compscitech.2005.09.005. [DOI] [Google Scholar]
- Rinker M.; Zahlen P. C.; John M.; Schäuble R. Investigation of sandwich crack stop elements under fatigue loading. J. Sandwich Struct. Mater. 2012, 14, 55–73. 10.1177/1099636211406425. [DOI] [Google Scholar]
- Caglayan C.; Gurkan I.; Gungor S.; Cebeci H. The effect of CNT-reinforced polyurethane foam cores to flexural properties of sandwich composites. Composites, Part A 2018, 115, 187–195. 10.1016/j.compositesa.2018.09.019. [DOI] [Google Scholar]
- Du L.; Jiao G. Indentation study of Z-pin reinforced polymer foam core sandwich structures. Composites, Part A 2009, 40, 822–829. 10.1016/j.compositesa.2009.04.004. [DOI] [Google Scholar]
- Boyce J. S.; Freitas G. A.; Magee C. L.; Fusco T. M.; Harris J. J.; Kunkel E.. Ultrasonic Fastening System and Method. US58,006,72A.19989.
- Nanayakkara A.; Feih S.; Mouritz A. P. Experimental analysis of the through-thickness compression properties of z-pinned sandwich composites. Composites, Part A 2011, 42, 1673–1680. 10.1016/j.compositesa.2011.07.020. [DOI] [Google Scholar]
- Selver E.; Kaya G. Flexural properties of sandwich composite laminates reinforced with glass and carbon Z-pins. J. Compos. Mater. 2019, 53, 1347–1359. 10.1177/0021998318800146. [DOI] [Google Scholar]
- Nanayakkara A.; Feih S.; Mouritz A. P. Experimental impact damage study of a z-pinned foam core sandwich composite. J. Sandwich Struct. Mater. 2012, 14, 469–486. 10.1177/1099636212443915. [DOI] [Google Scholar]
- Kaya G.; Selver E. Impact resistance of Z-pin-reinforced sandwich composites. J. Compos. Mater. 2019, 53, 3681–3699. 10.1177/0021998319845428. [DOI] [Google Scholar]
- Stanley L. E.; Adams D. O.; Reeder J. R.. Development and Evaluation of Stitched Sandwich Panels, NASA Langley Technical Report Server; NAS 1.26:211025; 2001.
- Tan K. T.; Watanabe N.; Iwahori Y. Effect of stitch density and stitch thread thickness on low-velocity impact damage of stitched composites. Composites, Part A 2010, 41, 1857–1868. 10.1016/j.compositesa.2010.09.007. [DOI] [Google Scholar]
- Jia J.; Yan S. Fabrication and low-velocity impact response of pyramidal lattice stitched foam sandwich composites. Sci. Eng. Compos. Mater. 2020, 27, 245–257. 10.1515/secm-2020-0025. [DOI] [Google Scholar]
- Lascoup B.; Aboura Z.; Khellil K.; Benzeggagh M. Impact response of three-dimensional stitched sandwich composite. Compos. Struct. 2010, 92, 347–353. 10.1016/j.compstruct.2009.08.012. [DOI] [Google Scholar]
- Wang P.; Lei Y.; Yue Z. Experimental and numerical evaluation of the flexural properties of stitched foam core sandwich structure. Compos. Struct. 2013, 100, 243–248. 10.1016/j.compstruct.2012.12.040. [DOI] [Google Scholar]
- Abdi B.; Azwan S.; Abdullah M. R.; Ayob A.; Yahya Y. Comparison of foam core sandwich panel and through-thickness polymer pin-reinforced foam core sandwich panel subject to indentation and flatwise compression loadings. Polym. Compos. 2016, 37, 612–619. 10.1002/pc.23218. [DOI] [Google Scholar]
- Jayaram R. S.; Nagarajan V. A.; Vinod Kumar K. P. Compression and low velocity impact response of sandwich panels with polyester pin-reinforced foam filled honeycomb core. J. Sandwich Struct. Mater. 2019, 21, 2014–2030. 10.1177/1099636218792675. [DOI] [Google Scholar]
- Eyvazian A.; Moeinifard M.; Musharavati F.; Taghizadeh S. A.; Mahdi E.; Hamouda A. M.; Tran T. N. Mechanical behavior of resin pin-reinforced composite sandwich panels under quasi-static indentation and three-point bending loading conditions. J. Sandwich Struct. Mater. 2021, 23, 2127–2145. 10.1177/1099636220909752. [DOI] [Google Scholar]
- Anbazhagan S.; Manikandan P.; Chai G. B.; Joshi S. C. Quasi-static indentation characteristics of sandwich composites with hybrid facesheets: Experimental and numerical approach. J. Sandwich Struct. Mater. 2022, 24, 294–320. 10.1177/1099636221993871. [DOI] [Google Scholar]
- Balıkoğlu F.; Demircioğlu T.; Yıldız M.; Arslan N.; Ataş A. Mechanical performance of marine sandwich composites subjected to flatwise compression and flexural loading: Effect of resin pins. J. Sandwich Struct. Mater. 2020, 22, 2030–2048. 10.1177/1099636218792671. [DOI] [Google Scholar]
- Yalkin H. E.; Icten B. M.; Alpyildiz T. Tensile and compressive performances of foam core sandwich composites with various core modifications. J. Sandwich Struct. Mater. 2017, 19, 49–65. 10.1177/1099636216650819. [DOI] [Google Scholar]
- Marino M.; Sabatini R.. Advanced Lightweight Aircraft Design Configurations for Green Operations, Proceedings of the Practical Responses to Climate Change 2014 (PRCC 2014), 2014; pp 1–9.
- Morada G.; Vadean A.; Boukhili R. Failure mechanisms of a sandwich beam with an ATH/epoxy core under static and dynamic three-point bending. Compos. Struct. 2017, 176, 281–293. 10.1016/j.compstruct.2017.05.023. [DOI] [Google Scholar]
- Bright D. S.; Steel E. B. Two-dimensional top hat filter for extracting spots and spheres from digital images. J. Microsc. 1987, 146, 191–200. 10.1111/j.1365-2818.1987.tb01340.x. [DOI] [Google Scholar]
- Saadatfar M.; Mukherjee M.; Madadi M.; Schröder-Turk G. E.; Garcia-Moreno F.; Schaller F. M.; Hutzler S.; Sheppard A. P.; Banhart J.; Ramamurty U. Structure and deformation correlation of closed-cell aluminium foam subject to uniaxial compression. Acta Mater. 2012, 60, 3604–3615. 10.1016/j.actamat.2012.02.029. [DOI] [Google Scholar]
- Chai H. W.; Xie Z. L.; Xiao X. H.; Xie H. L.; Huang J. Y.; Luo S. N. Microstructural characterization and constitutive modeling of deformation of closed-cell foams based on in situ x-ray tomography. Int. J. Plast. 2020, 131, 102730 10.1016/j.ijplas.2020.102730. [DOI] [Google Scholar]
- Wang B.; Shi Y.; Zhou C.; Li T. Failure mechanism of PMI foam core sandwich beam in bending. Int. J. Simul. Multisci. Des. Optim. 2016, 6, A8. [Google Scholar]
- Hui X.; Xu Y.; Zhang W. An integrated modeling of the curing process and transverse tensile damage of unidirectional CFRP composites. Compos. Struct. 2021, 263, 113681 10.1016/j.compstruct.2021.113681. [DOI] [Google Scholar]
- Systèmes D.Abaqus 6.12 Online Documentation 2012.
- Zhang W.; Qin Q.; Li J.; Li K.; Poh L. H.; Li Y.; Zhang J.; Xie S.; Chen H.; Zhao J. Deformation and failure of hybrid composite sandwich beams with a metal foam core under quasi-static load and low-velocity impact. Compos. Struct. 2020, 242, 112175 10.1016/j.compstruct.2020.112175. [DOI] [Google Scholar]