

Abstract
This paper proposes that the signal intensity of a lateral flow assay (LFA) strip can be increased by pressing the top of the strip, effectively reducing its flow rate. The reduced flow rate allows more time for antigen–antibody interactions to occur, resulting in increased signal intensity and an improved detection limit. To assess the potential of the pressed LFA (pLFA) strip, C-reactive protein (CRP) diluted in phosphate-buffered saline (PBS) and serum is detected, affording signal enhancement and a lowered limit of detection. Additionally, to show that the signal enhancement by pressure-induced flow delay applies to existing LFA products, commercially available COVID-19 antigen test strips are pressed, and signal enhancement is observed. Lastly, we show that the signal intensity of COVID-19 LFA kits can be increased by approximately two-fold at maximum by applying pressure on top of the manufactured product. This study suggests that pressed LFA strips can be used to reduce the chances of determining ambiguous signals as false-negative results and can potentially improve the detection sensitivity.
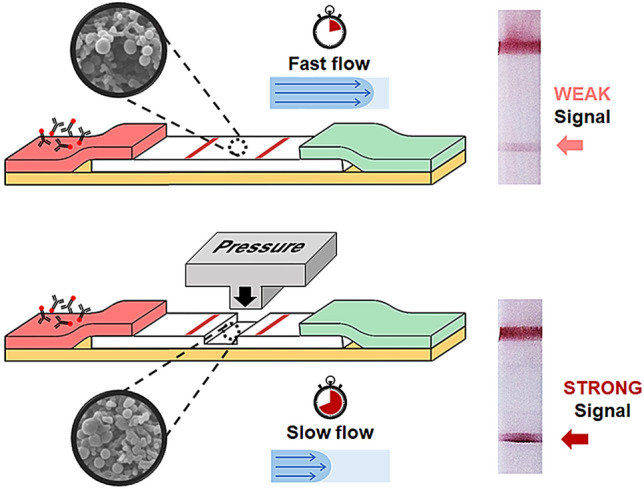
Graphical abstract
Supplementary Information
The online version contains supplementary material available at 10.1007/s13206-022-00085-w.
Keywords: Lateral flow assay, C-reactive protein, Signal enhancement, COVID-19, Immunoassay
Introduction
Lateral flow assay (LFA) is one of the most widely used point-of-care biosensing platforms owing to its simplicity, low cost, and high portability. The test strip is employed by dropping a particular volume of liquid sample onto its sample pad, and the result can be interpreted either by the naked eye or using a portable reader [1, 2]. Additionally, the strip consists of fiber and membrane-based materials, whose assembly is relatively simple, mass-producible, and cost-effective. However, despite its many advantages, the main disadvantage of traditional Au nanoparticle-based LFA is that its sensitivity is lower than that of other methods, such as enzyme-linked immunosorbent assay (ELISA) or polymerase chain reaction (PCR) [3, 4]. To improve the sensitivity of the LFA, many approaches have been developed and continue to be developed in academia.
First, various nanoparticles have been used as reporters or tracers to generate detection signals. Conventional LFA strips employ Au nanoparticles (AuNPs) as reporters to generate a colorimetric signal. As target analytes and antibody-labeled AuNPs form complexes and bind [5] with capture antibodies, a signal appears as a red band. The intensity of the red band should be sufficiently distinct from the background intensity to be interpreted as a positive signal. To achieve increased signal intensity, instead of using AuNPs, alternative reporters, such as fluorescence labels [6], graphene oxides [7], quantum dot [8], and lanthanides [9, 10], have been used and proven to be effective in improving the limit of detection (LOD). Second, the physical and optical properties of AuNPs have been exploited to enhance their detection capability. For example, LFA strips, using surface-enhanced Raman scattering (SERS) [2, 11, 12], photothermal effect [13], photoacoustic effect [14] have been shown to improve the sensitivity of detection compared to the colorimetric signal of AuNPs. However, the abovementioned novel reporters and detection methods generally require expensive optical instruments and signal transducers to interpret the results, and they limit the use of LFA in field-testing and point-of-care testing (POCT) applications.
Recently, several approaches have been developed to provide a condition that allows the enhanced binding of target molecules and labeling reporters to capture antibodies at the test line. This can be achieved by momentarily stopping the flow [15] or by reducing the flow rate within the strip[16, 17]; thus, target molecules have more time to interact with the capture and labeling antibodies. Several fabrication methods have been proposed to modify the strip to reduce the flow rate in the LFA strip. The geometrical modifications of the LFA strips can be achieved by cutting the LFA strip into specific shapes [18, 19] or using laser patterned photopolymer to create a barrier on nitrocellulose (NC) membrane [20] to control the flow rates in the LFA strips. Additionally, flow-interrupting materials can be inserted or embedded in the LFA strip to reduce the flow rate [21]. For example, aerogels or agar can be inserted between the conjugate pad and the NC membrane [22, 23], and wax pillars can be printed in the NC membrane [24] to enhance the detection signal intensity. The abovementioned flow rate reduction techniques increase the detection signal and improve the LOD. However, the additional materials involved with the above methods are likely to increase the cost of the test strip, whose low cost is the essential and main advantage.
Herein, we propose a pressed LFA strip (pLFA) to enhance the detection signal. The LFA strips are modified by applying pressure on the top of the membrane to decrease the flow rate and increase the signal intensity. Although pressed membranes have been demonstrated to be helpful in the sequential delivery of multiple reagents for the purpose of automating multistep assays [25, 26], the enhanced binding of antibody-antigen caused by pressure-induced flow rate reduction has not yet been applied to LFA with the goal of improving the detection signal intensity. To the best of our knowledge, this study is the first to report the use of such a simple and quick modification method to improve the detection performance of LFA strips. We demonstrate the improved detection limit and increased signal intensity by detecting C-reactive protein (CRP), a well-known inflammation and cardiovascular biomarker [27], and nucleocapsid protein of the SARS-CoV2 virus, the cause of the COVID-19 pandemic that began in 2020 [28]. The applicability and simplicity of the method are further demonstrated by pressing commercial LFA strips and showing that the detection signal can be enhanced.
Materials and Methods
Analysis of Reagent Volume Absorbed by Absorbent Pad Over Time
To determine the flow rate of a sample through the LFA strip, the NC membrane with 10 µm pore size (CNPF-SN12, mdi Membrane Technologies, Inc., United States) was pressed at 7.84, 15.69, and 23.54 MPa, and compared to that of a non-pressed NC membrane. A glass fiber pad (GFDX103000, Sigma-Aldrich, Germany) and an absorbent pad (490005-060, Ahlstrom-Munksjö, Finland) were attached to both ends of the strip, and water was dropped onto the glass fiber pad. The glass fiber was soaked in a blue dye solution and dried in a desiccator at room temperature before the experiment. The absorbent pad was photographed every 5 min until the absorbent pad was thoroughly wet. The wetted area was analyzed using ImageJ software (National Institute of Health, USA), and the absorbed volume was calculated.
Gold Aggregation Test
To decide the optimal antibody concentration for the conjugation of AuNP, varying amounts of an anti-CRP antibody was added to the mixture containing 0.5 M K2CO3 (P0793, Samchun Pure Chemicals, South Korea) buffer (diluted in deionized (DI) water, pH = 12) and 20 nm AuNP colloid solution (753610, Sigma-Aldrich, Germany). The absorbance of the antibody-mixed AuNP solutions was measured using a spectrophotometer (Epoch, BioTek, USA).
Gold Nanoparticle and Antibody Conjugation
To prepare the antibody-conjugated AuNPs (Ab-AuNP conjugates), an anti-CRP antibody (2.5 µL of 2 mg/mL) (ab8278, Abcam, United Kingdom) was added to 1,500 µL of 20 nm AuNP colloid solution and 30 µL of K2CO3 buffer. After 20 min of incubation at room temperature, 100 µL of phosphate-buffered saline (PBS) (806552, Sigma-Aldrich, Germany) containing 0.3% bovine serum albumin (BSA) (HC0332, HanLab, South Korea) was added to the solution to block the surface of the AuNP. After 20 min of incubation at room temperature, the mixture was centrifuged at 13,500 rpm for 20 min. After the supernatant was discarded, the precipitate was resuspended in 500 µL of suspension buffer containing PBS, 3% BSA, and 0.25% Tween 20 (P1379, Sigma-Aldrich, Germany).
Lateral Flow Assay Strip Fabrication
The LFA strip comprises a conjugate pad, an NC membrane, and an absorbent pad. The conjugate pad was made from glass fiber, and the absorbent pad was made from a cellulose pad. The conjugate pad, NC membrane, and absorbent pad were cut into 10 × 10 mm, 5 × 25 mm, and 10 × 25 mm, respectively. The glass fiber pad was soaked in 60 µL of the AuNP–antibody solution containing 1% of D-( +)-trehalose dihydrate (90210, Sigma-Aldrich, Germany) and dried in a desiccator at room temperature. To detect the CRP, 1 mg/mL of the anti-CRP antibody (ab31156, Abcam, United Kingdom) and goat anti-mouse IgG antibody (M8642, Sigma-Aldrich, Germany) were immobilized using an antibody dispenser (LPM-02, mdi Membrane Technologies, Inc., United States) on the NC membrane as a test line and a control line, respectively. Next, the NC membrane was cut into 5 mm wide and pressed using a hand press machine. To repeatedly create a 5 × 5 mm pressed region between the test line and the control line, a jig was designed and 3D printed to place NC membrane, a laser cutter was used to cut an acrylic jig to fix stamp, and stamp was designed and 3D printed to press NC membrane. The NC membrane was placed in the jig. First, the stamp was placed on the top of NC membrane (between the test line and the control line), and the jig was placed on the load cell (CMNC-200L, CAS Corporation, South Korea) and an indicator (CI-150A, CAS Corporation, South Korea) was added. The applied pressure was controlled by monitoring the force readout reported by the indicator (Figure S1). Once the membrane was pressed, the pressed feature remained without reverting to its original shape. To assemble the LFA strip, the NC membrane was first placed and attached to the adhesive part of the lamination film. Afterward, a conjugate pad and an absorbent pad were attached to each end of the NC strip with a 1 mm overlap.
CRP Detection
CRP (30-AC05, Fitzgerald, United States) was diluted in PBS and CRP-free human serum (90R-105, Fitzgerald, United States) to known concentrations (0, 0.05, 0.1, 0.25, 0.5, and 1 μg/mL). Furthermore, 60 µL of a sample containing CRP was pipetted onto the conjugate pad, and the pLFA strips were covered using a transparent square dish without contact with the membrane to prevent the evaporation of the sample solution during the experiment. After loading the sample using a pipette, photos of the test and control lines were taken after the absorbent pad absorbed 33 μL of the CRP solution. To calculate the LOD, linear regression analysis was first performed for signal intensity values from 0 to 0.25 μg/mL. LOD was determined by obtaining IntensityLOD = Intensityblank + 3σblank (the measured intensity value of a blank sample plus three times its standard deviation) and then calculating the concentration that corresponds to IntensityLOD using the linear fit.
SARS-CoV-2 Antigen Detection Using Commercial Kit
The nucleocapsid (N) protein was detected using a STANDARD™ Q COVID-19 Ag Home Test (09COV130H, SD Biosensor, South Korea) and Humasis COVID-19 Ag Home Test (Humasis, South Korea). N protein was diluted in the extraction buffer from each test kit to the following concentrations: 0, 0.5, 1, 2, and 3 ng/mL. One hundred microliters of sample, which is indicated in the instructions as an appropriate amount for the test, was loaded onto the sample pad, and the pLFA strips were covered using a transparent square dish. The kits were pressed at 0, 7.85, 15.69, 23.54 MPa and took 13, 25, 35, and 41 min, respectively, to process the same volume of N protein sample.
Image Analysis of Detection Result
The signal intensity value of the test line, control line, and background was measured using ImageJ software. First, the signal intensity of the background was subtracted from the signal intensity value of the test line and control line to remove biases that could be caused by the intensity of the AuNP solution and lighting. Thereafter, the signal intensity value of the test line was divided by the signal intensity value of the control line to obtain the ratio of the test line to the control line (T/C).
Results and Discussion
Working Mechanism of pLFA Strip
A typical LFA strip consists of a sample pad, conjugate pad, NC membrane, and absorbent pad. The sample pad is generally embedded with additives that can adjust the pH or ionic properties of the sample under optimal conditions [29–31]. However, in this study, for simplicity and proof of concept experiments, the sample pad was not used, and the sample was loaded directly onto the conjugate pad of the lab-made LFA strips. The conjugate pad was impregnated with Ab-AuNP conjugates, whose antibodies are designed to bind to a target molecule. When the liquid sample is introduced to the conjugate pad, it begins to hydrate the AuNPs, which are pre-dried in the conjugate pad. As the mixture flows along the NC membrane, the target antigen, if present, binds with the antibodies that were conjugated on the surface of the AuNPs to form an antigen–antibody–AuNP conjugate complex. When the conjugate complex reaches the test line, the antigens are captured by the immobilized antibodies, forming an accumulation of the AuNP conjugate complex, which appears as a red line to the naked eye. When the conjugates that are not captured by the capture antibodies or free antibody–AuNP complexes reach the control line, they are captured by the antibodies that target the labeling antibodies. However, the antigen–antibody–AuNP conjugate complex does not always bind to the antibodies immobilized on the test line. As the conjugates flow through the pores of the NC membrane, whose pore dimension is in the order of micrometers, they also need to get close to the capture antibodies that are immobilized on the surface of the NC, and this partly depends on the random diffusion of the complex (Fig. 1a). If the flow rate is high and the diffusion distance is not long enough to reach the capture antibodies, the antigen–antibody–AuNP complexes may not accumulate at the test line. Thus, to reduce the flow rate, the NC strip was partially pressed, and the reduced pore size at the pressed region increased the fluidic resistance. This allowed more time for the complexes to spend within the pores of the NC, increasing their diffusion distance and their chances of binding with the capture antibodies (Fig. 1b). The region between the test line and control line was pressed, as shown in Fig. 2a, to minimize any potential filtering of the antigen–antibody–AuNP complexes that can be caused by the reduced pore size, which may reduce the signal intensity of the test line.
Fig. 1.

Schematic of the enhanced antibody–antigen interaction in a pLFA strip. a The antigen–antibody–AuNP complex may not bind with the capture antibodies if the diffusion distance is too short. b The reduced flow rate increases the time required for the complexes to flow past the capture antibodies, increasing the diffusion distance caused by random walk and increasing their chances of binding with the capture antibodies. The area shaded in gray indicates the pressed region
Fig. 2.

a Schematic of the pLFA showing the location of the pressed zone; b SEM images of the NC structures pressed with different amounts of pressure. The images show that the NC strips pressed with relatively high pressure results in relatively small cavities; the volume of the c water and d diluted serum absorbed by the absorbent pad over time for the NC strips pressed with different pressure
Pressure-Induced Flow Delay
The pressed NC membrane reduced the flow rate because relatively small pores exerted relatively high flow resistance. The extent to which the pores collapsed depended on the applied pressure (Fig. 2b). This means that strips pressed with different pressure have different volumes of liquid flowing through in a given time. Thus, to make a fair comparison between the intensities of the signals of the LFA strips pressed with different pressure values, the intensity of the signals was compared after the same amount of sample was passed in each strip. The relationship between time and the absorbed volume was first studied to determine the time required to process a specific amount of sample. Figure 2c shows that as time passes, more liquid is absorbed by the absorbent pad, and the fluid flow rate decreases for strips pressed with relatively high pressure. The moment at which the absorbent pad absorbed 33 μL of the sample was chosen as the time to image the signal intensity. However, in clinical settings, CRP or target antigens may not be diluted in PBS; rather, they will be contained within the blood, plasma, or serum, which are more viscous. Because viscosity can cause a difference in the volume processed in a given time, the volume of serum (diluted four-fold with PBS as done in previous studies [5, 32]) absorbed by the absorbent pad was observed with respect to time. Figure 2d shows that it takes 14, 22, 34, and 52 min for the diluted serum to flow through the strips pressed at 0, 7.85, 15.69, and 23.54 MPa. The difference is not apparent for the strips pressed at 0, 7.85, and 15.69 MPa. However, it takes approximately 11 more minutes for the diluted serum to flow through a strip pressed at 23.54 MPa compared to PBS. This indicates that more viscous samples require more time to process the same volume of liquid. The data shown in Fig. 2c and d are used to determine the timing of the imaging of the detection results.
Flow Delay-Induced Signal Enhancement of CRP Detection
To observe the signal enhancement in the pLFA strips, CRP was chosen as a model analyte and diluted in PBS at varying concentrations. Various CRP concentrations (0, 0.05, 0.1, 0.25, 0.5, and 1 μg/mL) were tested, and the concentration range was chosen to be comparable to that of the high-sensitivity CRP (hs-CRP) test, which detect CRP between 0.5 and 1.0 μg/mL. The NC strips were pressed at 0, 7.85, 15.69, and 23.54 MPa to observe the effect of flow reduction on the signal intensity. Figure 3a, c shows that the pLFA strips fabricated using a relatively high pressure exhibit a relatively high test signal intensity. Compared to the non-pressed LFA strip, the signal intensity was amplified more than twice (2.11 times) for 0.5 μg/mL of the CRP detected in a pLFA strip pressed at 23.54 MPa (Fig. 3b). The values above each bar indicated the ratio of the signal intensity of pLFA compared to that of the non-pressed LFA, which was calculated by dividing the average value of the signal intensity measured in the pLFA by the average of the intensity measured in the non-pressed strip. Additionally, the LOD of the pLFA strips was lower than that of the non-pressed strip, which indicated that the enhanced signal intensity improved the LOD (Table 1). As it is well known, immunoassay-based tests have a hook effect at high concentrations. This phenomenon occurs when an excessive amount of analyte occupies the binding sites of the antibodies conjugated with AuNPs and also occupies the antibodies at the test line without forming a sandwich immunocomplex [33, 34]. Figure 3a shows that between 0.5 and 1 μg/mL, the hook effect begins to occur at the pLFA strips pressed at 15.69 and 23.54 MPa. This indicates that the analytes flowing through the strips with relatively low flow rates have relatively high effective concentrations owing to the reduced flow rate, as reported previously [35, 36], resulting in increased signal intensity.
Fig. 3.

Result of the CRP detection using the pLFA strips; a graph showing the quantified test signal intensity (n = 3), b bar graph showing the ratio of the signal intensity of the pLFA compared to that of the non-pressed LFA, and c photos showing the test results of the CRP diluted in PBS; c indicates the control line, and T indicates the test line; Result of the CRP diluted in serum detection using the pLFA strips; d graph showing the quantified test signal intensity (n = 3); e bar graph showing the ratio of the signal intensity of the pLFA compared to that of the non-pressed LFA; and f photos showing the test results of the CRP diluted in serum
Table 1.
LOD of the CRP diluted in PBS and serum using lab-made LFA strips fabricated by applying various pressure
| CRP LOD (in PBS) | CRP LOD (in serum) | |
|---|---|---|
| 0 MPa | 4.84 ng/mL | 3.79 ng/mL |
| 7.85 MPa | 2.40 ng/mL | 2.60 ng/mL |
| 15.69 MPa | 2.10 ng/mL | 1.50 ng/mL |
| 23.54 MPa | 2.98 ng/mL | 1.94 ng/mL |
Furthermore, to determine if the pLFA can be used to detect CRP in the actual sample, CRP was detected in serum by diluting a known amount of CRP in CRP-free human serum. Because of the high viscosity of the serum, the serum was diluted four-fold before spiking with CRP, as done in previous studies [5, 32]. The diluted serum samples containing CRP were loaded onto pLFA strips pressed with different pressure, and the intensity of the test line was measured. Similar to the result from the detection of CRP in PBS, the intensity of the test line became more vivid as the applied pressure increased (Fig. 3d–f). In the case of using a sample like serum, which contains various components such as proteins, antibodies, and hormones, it is important to make sure that there is no nonspecific binding, or cross-reactivity. Nonspecific binding can cause false-positive signals, which are false, visible signals that occur even with negative control. It is worth noting that in Fig. 3f, there is no noticeable cross-reactivity with 0 µg/mL CRP (CRP-free serum) for all LFA strips pressed at different pressures. This indicates that the enhancement in signal strength in pressed LFA strips are very unlikely to be caused by nonspecific binding.
Interestingly, when the CRP diluted in serum flowed through the pLFA pressed with 23.54 MPa, the hook effect began to occur at 0.25 μg/mL of CRP (compared to 0.5 μg/mL of CRP diluted in PBS). This indicates that the hook effect begins at a relatively low concentration when the target analyte is diluted in a more viscous medium, owing to the increased effective concentration of the target analyte. Resultantly, the LODs of the CRP diluted in serum were lower than the LODs of the CRP diluted in PBS (Table 1). It is important to note that at the 23.54 MPa condition, because the hook effect occurs at a relatively low concentration, it results in a reduced operational range. However, 23.54 MPa also results in the highest sensor sensitivity, which is another important parameter of biosensors along with LOD. Sensitivity indicates the change in the signal output (signal intensity in our case) with respect to the change in the input (sample concentration in our case), which is also the same as the slope of the signal intensity curve. Pressing the LFA strip has the effect of gaining sensitivity and improving the limit of detection while sacrificing the operation range. Such an effect may not be ideal for quantifying a target of wide concentration range, but it can be helpful in cases where the purpose of detection is a qualitative determination of the presence or absence of an analyte.
When detecting CRP from diluted serum, it takes 14, 22, 34, and 52 min for the diluted serum to flow through the strip pressed at 0, 7.85, 15.69, 23.54 MPa. Although 52 min is much longer compared to conventional LFA kits which instruct users to wait for 15 to 30 min, we would like to address that it can still be considered rapid according to World Health Organization (WHO)’s ASSURED (affordable, sensitive, specific, user-friendly, rapid, equipment-free, delivered) criteria, which suggests that POCT should deliver the result within 60 min [37].
Overall, we conclude that increasing the amount of applied pressure on the pLFA results in a relatively strong signal of the CRP in PBS, as well as diluted serum, which suggests the applicability of the pLFA in real samples.
Flow Delay-Induced Signal Enhancement of SARS-CoV-2 Antigen Detection
To further demonstrate the potential of pLFA, self-diagnostic LFA kits were purchased, and their NC strips were partially pressed to demonstrate that the simple modification method of the pLFA strip is readily applicable to commercial products and can be used to improve their detection performance. The strips of two companies (Humasis and SD Biosensor) were removed from their cartridges, pressed, and assembled back into the cartridge. Thereafter, the signal enhancement of the pressed LFA kits was observed using N proteins diluted in the extraction buffer provided in the kits. Figure 4 shows that the strips of both companies show increased signal intensity as the strips are pressed with increased pressure, without showing any apparent nonspecific binding. Notably, when 0.5 ng/mL of the N protein diluted in lysis buffer was added to the strips manufactured by both companies, the non-pressed strip showed no apparent signal (Fig. 4a, d). However, for the strips pressed at 23.54 MPa, the signal of the test line became visible to the naked eye and distinguishable from that of the non-pressed LFA. The differences in the signal intensity between the non-pressed LFA and pLFA strips became more apparent as the concentration of the target protein increased (Fig. 4b, e). The graphs in Fig. 4c, f show the ratio of the signal intensity of the pLFA to that of the non-pressed LFA. In pressed commercial LFA kits, the detection signal can be amplified by as much as two-fold, and the amplification can be achieved by applying pressure to the already-manufactured product. This result indicates that pLFA effectively enhances the signal intensity compared to a conventional, non-pressed LFA and also suggests that the simple modification method can easily be added to the existing manufacturing process to improve the detection result.
Fig. 4.

Photos showing the detection result of the N protein of SARS-CoV-2 using a Humasis COVID-19 Ag Home Test kit and d STANDARD™ Q COVID-19 Ag Home Test kit without pressing (left strips) and pressed with 23.54 MPa (right strips); graphs showing the quantified test signal intensity of the detection result b of Humasis and e SD Biosensor LFA strips; bar graphs show the signal intensity ratio of pressed strips compared to non-pressed strips using c Humasis and f SD Biosensor strips
Conclusions
In this study, we demonstrated that the signal intensity of an LFA strip can be increased by pressing the top of the strip. The NC membrane of the LFA can be pressed to reduce the flow rate of the sample, which enhances the antibody–antigen reaction and ultimately results in an increased detection signal. Based on the experimental results, pressing LFA strip at 15.69 MPa is the optimal condition for CRP detection from both PBS and serum, and 23.54 MPa is the optimal condition for both of the commercial COVID-19 test kits. Additionally, the results presented herein suggest that the effective concentration of the sample is increased in pLFA compared to non-pressed LFA. This indicates that using pLFA can allow the collection of reduced sample volumes and still perform the test after dilution using a buffer. This feature can be advantageous to situations in which collecting minimum sample volume can be beneficial, as in the collection of the blood of infants or using blood collected by fingerstick. Furthermore, the modification method can be considered suitable and readily applicable to mass production because physically pressing the NC strip is a quick process that involves a simple stamping motion, and it does not require embedding any additional materials or chemical treatment. Owing to the simple nature of the fabrication process, the modification or pressing step was applied easily to commercial products and proved to enhance their signal strength. This suggests that the method of fabricating pLFA can be easily added to the current manufacturing process to improve the detection results of existing products. Overall, the results of this study suggest that pLFA can reduce the LOD and increase the detection sensitivity and can be beneficial to COVID-19 self-diagnostic kits, which are known to have low sensitivity. We expect that pLFA can be widely applied in immunoassays and point-of-care diagnostics and can contribute positively to mitigating the COVID-19 pandemic.
Supplementary Information
Below is the link to the electronic supplementary material.
Acknowledgements
The authors would like to thank Juhee Lim for preparing the experiment, diluting antigen, and LFA strip photo shooting for the Humasis and SD Biosensor LFA experiments. The authors would also like to thank Dr. Jaeho Shin for helpful discussions. This research was supported by a National Research Foundation of Korea (NRF) grant funded by the Korean government (MSIT) (grant number: 2020R1C1C1003567 and No. 2022R1A5A8023404).
Author Contributions
SBP: investigation, data curation, writing an original draft, writing review and editing, formal analysis. JHS: conceptualization, methodology, resources, writing an original draft, writing review and editing, visualization, supervision, project administration.
Declarations
Conflict of Interest
The authors declare no competing interest.
Footnotes
Publisher's Note
Springer Nature remains neutral with regard to jurisdictional claims in published maps and institutional affiliations.
References
- 1.Gong Y, Zheng Y, Jin B, You M, Wang J, Li X, Lin M, Xu F, Li F. A portable and universal upconversion nanoparticle-based lateral flow assay platform for point-of-care testing. Talanta. 2019;201:126–133. doi: 10.1016/j.talanta.2019.03.105. [DOI] [PubMed] [Google Scholar]
- 2.Tran V, Walkenfort B, König M, Salehi M, Schlücker S. Rapid, quantitative, and ultrasensitive point-of-care testing: a portable SERS reader for lateral flow assays in clinical chemistry. Angew Chem Int Ed. 2019;58:442–446. doi: 10.1002/anie.201810917. [DOI] [PMC free article] [PubMed] [Google Scholar]
- 3.White PL, Parr C, Thornton C, Barnes RA. Evaluation of real-time PCR, galactomannan enzyme-linked immunosorbent assay (ELISA), and a novel lateral-flow device for diagnosis of invasive aspergillosis. J Clin Microbiol. 2013;51:1510–1516. doi: 10.1128/JCM.03189-12. [DOI] [PMC free article] [PubMed] [Google Scholar]
- 4.Lee JS, Ahn JJ, Kim SJ, Yu SY, Koh EJ, Kim SH, Sung HS, Huh JW, Hwang SY. POCT detection of 14 respiratory viruses using multiplex RT-PCR. BioChip J. 2021;15:371–380. doi: 10.1007/s13206-021-00037-w. [DOI] [PMC free article] [PubMed] [Google Scholar]
- 5.Zhou G, Mao X, Juncker D. Immunochromatographic assay on thread. Anal Chem. 2012;84:7736–7743. doi: 10.1021/ac301082d. [DOI] [PubMed] [Google Scholar]
- 6.Wu R, Zhou S, Chen T, Li J, Shen H, Chai Y, Li LS. Quantitative and rapid detection of C-reactive protein using quantum dot-based lateral flow test strip. Anal Chim Acta. 2018;1008:1–7. doi: 10.1016/j.aca.2017.12.031. [DOI] [PubMed] [Google Scholar]
- 7.Hassan AHA, Bergua JF, Morales-Narváez E, Mekoçi A. Validity of a single antibody-based lateral flow immunoassay depending on graphene oxide for highly sensitive determination of E. coli O157: H7 in minced beef and river water. Food Chem. 2019;297:124965. doi: 10.1016/j.foodchem.2019.124965. [DOI] [PubMed] [Google Scholar]
- 8.Kim S-K, Sung H, Hwang S-H, Kim M-N. A new quantum dot-based lateral flow immunoassay for the rapid detection of influenza viruses. BioChip J. 2022 doi: 10.1007/s13206-022-00053-4. [DOI] [PMC free article] [PubMed] [Google Scholar]
- 9.Salminen T, Juntunen E, Talha SM, Pettersson K. High-sensitivity lateral flow immunoassay with a fluorescent lanthanide nanoparticle label. J Immunol Methods. 2019;465:39–44. doi: 10.1016/j.jim.2018.12.001. [DOI] [PubMed] [Google Scholar]
- 10.Chen Z, Zhang Z, Zhai X, Li Y, Lin L, Zhao H, Bian L, Li P, Yu L, Wu Y, Lin G. Rapid and sensitive detection of anti-SARS-CoV-2 IgG, using lanthanide-doped nanoparticles-based lateral flow immunoassay. Anal Chem. 2020;92:7226–7231. doi: 10.1021/acs.analchem.0c00784. [DOI] [PubMed] [Google Scholar]
- 11.Fu X, Cheng Z, Yu J, Choo P, Chen L, Choo J. A SERS-based lateral flow assay biosensor for highly sensitive detection of HIV-1 DNA. Biosens Bioelectron. 2016;78:530–537. doi: 10.1016/j.bios.2015.11.099. [DOI] [PubMed] [Google Scholar]
- 12.Liu H, Dai E, Xiao R, Zhou Z, Zhang M, Bai Z, Shao Y, Qi K, Tu J, Wang C, Wang S. Development of a SERS-based lateral flow immunoassay for rapid and ultra-sensitive detection of anti-SARS-CoV-2 IgM/IgG in clinical samples. Sens Actuators B Chem. 2021;329:129196. doi: 10.1016/j.snb.2020.129196. [DOI] [PMC free article] [PubMed] [Google Scholar]
- 13.Ye H, Liu Y, Zhan L, Liu Y, Qin Z. Signal amplification and quantification on lateral flow assays by laser excitation of plasmonic nanomaterials. Theranostics. 2020;10:4359–4373. doi: 10.7150/thno.44298. [DOI] [PMC free article] [PubMed] [Google Scholar]
- 14.Zhao Y, Huang Y, Zhao X, McClelland JF, Lu M. Nanoparticle-based photoacoustic analysis for highly sensitive lateral flow assays. Nanoscale. 2016;8:19204–19210. doi: 10.1039/C6NR05312B. [DOI] [PubMed] [Google Scholar]
- 15.Sena-Torralba A, Ngo DB, Parolo C, Hu L, Álvarez-Diduk R, Bergua JF, Rosati G, Surareungchai W, Merkoçi A. Lateral flow assay modified with time-delay wax barriers as a sensitivity and signal enhancement strategy. Biosens Bioelectron. 2020;168:112559. doi: 10.1016/j.bios.2020.112559. [DOI] [PubMed] [Google Scholar]
- 16.Zhang SF, Liu LN, Tang RH, Liu Z, He XC, Qu ZG, Li F. Sensitivity enhancement of lateral flow assay by embedding cotton threads in paper. Cellulose. 2019;26:8087–8099. doi: 10.1007/s10570-019-02677-6. [DOI] [Google Scholar]
- 17.Alam N, Tong L, He Z, Tang R, Ahsan L, Ni Y. Improving the sensitivity of cellulose fiber-based lateral flow assay by incorporating a water-dissolvable polyvinyl alcohol dam. Cellulose. 2021;28:8641–8651. doi: 10.1007/s10570-021-04083-3. [DOI] [PMC free article] [PubMed] [Google Scholar]
- 18.Parolo C, Medina-Sánchez M, De La Escosura-Muñiz A, Merkoçi A. Simple paper architecture modifications lead to enhanced sensitivity in nanoparticle based lateral flow immunoassays. Lab Chip. 2013;13:386–390. doi: 10.1039/C2LC41144J. [DOI] [PubMed] [Google Scholar]
- 19.Zadehkafi A, Siavashi M, Asiaei S, Bidgoli MR. Simple geometrical modifications for substantial color intensity and detection limit enhancements in lateral-flow immunochromatographic assays. J Chromatogr B. 2019;1110–1111:1–8. doi: 10.1016/j.jchromb.2019.01.019. [DOI] [PubMed] [Google Scholar]
- 20.Katis IN, He PJ, Eason RW, Sones CL. Improved sensitivity and limit-of-detection of lateral flow devices using spatial constrictions of the flow-path. Biosens Bioelectron. 2018;113:95–100. doi: 10.1016/j.bios.2018.05.001. [DOI] [PubMed] [Google Scholar]
- 21.Fu E, Downs C. Progress in the development and integration of fluid flow control tools in paper microfluidics. Lab Chip. 2017;17:614–628. doi: 10.1039/C6LC01451H. [DOI] [PubMed] [Google Scholar]
- 22.Choi JR, Yong KW, Tang R, Gong Y, Wen T, Yang H, Li A, Chia YC, Pingguan-Murphy B, Xu F. Lateral flow assay based on paper–hydrogel hybrid material for sensitive point-of-care detection of dengue virus. Adv Healthc Mater. 2017;6:1600920. doi: 10.1002/adhm.201600920. [DOI] [PubMed] [Google Scholar]
- 23.Tang Y, Gao H, Kurth F, Burr L, Petropoulos K, Migliorelli D, Guenat OT, Generelli S. Nanocellulose aerogel inserts for quantitative lateral flow immunoassays. Biosens Bioelectron. 2021;192:113491. doi: 10.1016/j.bios.2021.113491. [DOI] [PubMed] [Google Scholar]
- 24.Rivas L, Medina-Sánchez M, De La Escosura-Muñiz A, Merkoçi A. Improving sensitivity of gold nanoparticle-based lateral flow assays by using wax-printed pillars as delay barriers of microfluidics. Lab Chip. 2014;14:4406–4414. doi: 10.1039/c4lc00972j. [DOI] [PubMed] [Google Scholar]
- 25.Park J, Shin JH, Park JK. Pressed paper-based dipstick for detection of foodborne pathogens with multistep reactions. Anal Chem. 2016;88:3781–3788. doi: 10.1021/acs.analchem.5b04743. [DOI] [PubMed] [Google Scholar]
- 26.Shin JH, Park J, Kim SH, Park JK. Programmed sample delivery on a pressurized paper. Biomicrofluidics. 2014;8:054121. doi: 10.1063/1.4899773. [DOI] [PMC free article] [PubMed] [Google Scholar]
- 27.Ridker PM. Clinical application of C-reactive protein for cardiovascular disease detection and prevention. Circulation. 2003;107:363–369. doi: 10.1161/01.cir.0000053730.47739.3c. [DOI] [PubMed] [Google Scholar]
- 28.Hu B, Guo H, Zhou P, Shi ZL. Characteristics of SARS-CoV-2 and COVID-19. Nat. Rev. Microbiol. 2021;19:141–154. doi: 10.1038/s41579-020-00459-7. [DOI] [PMC free article] [PubMed] [Google Scholar]
- 29.Dalirirad S, Steckl AJ. Aptamer-based lateral flow assay for point of care cortisol detection in sweat. Sens Actuators B Chem. 2019;283:79–86. doi: 10.1016/j.snb.2018.11.161. [DOI] [Google Scholar]
- 30.Choi DH, Lee SK, Oh YK, Bae BW, Lee SD, Kim S, Shin YB, Kim MG. A dual gold nanoparticle conjugate-based lateral flow assay (LFA) method for the analysis of troponin I. Biosens Bioelectron. 2010;25:1999–2002. doi: 10.1016/j.bios.2010.01.019. [DOI] [PubMed] [Google Scholar]
- 31.Li X, Wu X, Wang J, Hua Q, Wu J, Shen X, Sun Y, Lei H. Three lateral flow immunochromatographic assays based on different nanoparticle probes for on-site detection of tylosin and tilmicosin in milk and pork. Sens Actuators B Chem. 2019;301:127059. doi: 10.1016/j.snb.2019.127059. [DOI] [Google Scholar]
- 32.Oh YK, Joung HA, Han HS, Suk HJ, Kim MG. A three-line lateral flow assay strip for the measurement of C-reactive protein covering a broad physiological concentration range in human sera. Biosens Bioelectron. 2014;61:285–289. doi: 10.1016/j.bios.2014.04.032. [DOI] [PubMed] [Google Scholar]
- 33.Tate J, Ward G. Interferences in immunoassay. The clinical biochemist reviews. 2004;25:105–120. [PMC free article] [PubMed] [Google Scholar]
- 34.Posthuma-Trumpie GA, Korf J, Van Amerongen A. Lateral flow (immuno) assay: its strengths, weaknesses, opportunities and threats A literature survey. Anal Bioanal Chem. 2009;393:569–582. doi: 10.1007/s00216-008-2287-2. [DOI] [PubMed] [Google Scholar]
- 35.Berli CL, Kler PA. A quantitative model for lateral flow assays. Microfluid Nanofluid. 2016;20:1–9. doi: 10.1007/s10404-016-1771-9. [DOI] [Google Scholar]
- 36.Hristov DR, Rodriguez-Quijada C, Gomez-Marquez J, Hamad-Schifferli K. Designing paper-based immunoassays for biomedical applications. Sensors. 2019;19:554. doi: 10.3390/s19030554. [DOI] [PMC free article] [PubMed] [Google Scholar]
- 37.Land KJ, Boeras DI, Chen X-S, Ramsay AR, Peeling RW. REASSURED diagnostics to inform disease control strategies, strengthen health systems and improve patient outcomes. Nat. Microbiol. 2019;4:46–54. doi: 10.1038/s41564-018-0295-3. [DOI] [PMC free article] [PubMed] [Google Scholar]
Associated Data
This section collects any data citations, data availability statements, or supplementary materials included in this article.