Abstract
An innovative ADE-TFT interpretable tourism demand forecasting model was proposed to address the issue of the insufficient interpretability of existing tourism demand forecasting. This model effectively optimizes the parameters of the Temporal Fusion Transformer (TFT) using an adaptive differential evolution algorithm (ADE). TFT is a brand-new attention-based deep learning model that excels in prediction research by fusing high-performance prediction with time-dynamic interpretable analysis. The TFT model can produce explicable predictions of tourism demand, including attention analysis of time steps and the ranking of input factors’ relevance. While doing so, this study adds something unique to the literature on tourism by using historical tourism volume, monthly new confirmed cases of travel destinations, and big data from travel forums and search engines to increase the precision of forecasting tourist volume during the COVID-19 pandemic. The mood of travelers and the many subjects they spoke about throughout off-season and peak travel periods were examined using a convolutional neural network model. In addition, a novel technique for choosing keywords from Google Trends was suggested. In other words, the Latent Dirichlet Allocation topic model was used to categorize the major travel-related subjects of forum postings, after which the most relevant search terms for each topic were determined. According to the findings, it is possible to estimate tourism demand during the COVID-19 pandemic by combining quantitative and emotion-based characteristics.
Keywords: Interpretable tourism demand forecasting, Deep learning, Text mining, COVID-19
Introduction
In many countries, the tourism industry is a pillar industry owing to its increasing contribution to the gross domestic product [1]. However, as the tourism industry is characterized by the “spatial mobility of people,” it is one of the industries most affected by coronavirus disease 2019 (COVID-19) [2]. The World Health Organization (WHO) has declared COVID-19 a global threat [3]. More than 560 million cases of infection and more than 6 million fatalities had been published globally as of July 2022. The rapid global expansion of COVID-19 is substantially impairing human life as well as international trade [4, 5]. Research on the effects of COVID-19 on the world is currently in high demand [6, 7]. During the outbreak, most countries implemented strict international and domestic travel restrictions to contain the spread of infection [8]. With the pandemic under control and many countries relaxing travel restrictions, the tourism industry has been slowly recovering. To move forward, accurate tourism demand forecasting following the COVID-19 pandemic is important to the strategic planning of tourism destinations and tourism-related enterprises [9]. However, the uncertainty resulting from COVID-19 leads to major challenges in forecasting tourism demand.
Some previous tourism volume forecasting studies have been based on large amounts of historical data. However, historical data for tourism demand forecasting cannot reflect the impact of sudden and unexpected events such as diseases, disasters, or crises. Therefore, explanatory variables that can reflect the impact of uncertain events and monitor visitor behavior and satisfaction on time are necessary when predicting tourism demand during the COVID-19 period. Big data satisfies these characteristics; hence, it can provide the possibility for accurate and timely tourism demand prediction [10, 11]. In addition, to provide high-frequency information, big data can show visitors’ preferences and changes in their preferences in real-time.
Website traffic data and search engine data have been useful in improving the accuracy of tourism demand, tourist attraction demand, and hotel room demand [12, 13]. Besides, travelers prefer to trust other travelers’ information or comments on social media platforms, rather than information from service providers [14]. As a result, online reviews and user-generated content have gained immense importance [15, 16], thus proving the usefulness of well-known sites such as TripAdvisor in forecasting travel demand success [17, 18]. Big data shared on online social media can help predict rapid changes in tourist preferences and popular trends in destinations by analyzing the topics discussed in online discourse [19].
Volume-based data like Google Trends and online media data have their pros and cons in predicting tourism volume [20]. For example, a high search volume about a travel destination on Google Trends does not necessarily reflect the great interest of travelers, and positive media messages can indicate an increase but not the exact amount. In forecasting tourism demand, integrating quantitative and emotion-based complementary variables are valuable and meaningful [21]. Poor tourism volume prediction may result from insufficient diversity of data, particularly during the COVID-19 period. Li et al. [22] emphasized that the locations where policymakers can quickly plan may be significantly impacted by the application of multi-source data. Therefore, by merging data from other complementing sources, this issue may be solved.
The coupling relationship between influencing factors and tourism volume data in the current tourism demand forecasting models is rarely examined and explained [23]. Although deep learning models have been used by some researchers to anticipate time series with excellent accuracy [24], experimental models are unable to describe how deep learning models function. The research’s findings cannot persuade those employed in the tourism industry due to a lack of explanatory power. Therefore, further research needs to be done to determine how tourism demand forecasts may be understood effectively. Given the limitations of previous research, this work improved the Temporal Fusion Transformers (TFT) using an adaptive differential evolution algorithm (ADE) and then created a high-level, understandable forecasting model for tourism demand. There are four primary contributions to this work.
This study’s main contribution was the new and thoughtful strategy which is choosing keywords from Google Trends. The primary subjects in the travel forum content were examined using the LDA topic model, and then the most pertinent search terms were chosen based on each topic.
This is one of the initial attempts to develop a temporal fusion transformed explanatory monthly tourism demand forecasting model. The TFT’s parameters were optimized using an adaptive differential evolution algorithm, which boosts prediction stability and accuracy. This work added to the knowledge in the academic community about the interpretability of input variables used in tourism forecasting and offered a fresh perspective on explicable time series forecasting.
Text from travel forum threads was automatically extracted using a deep learning algorithm. The goal of this work is to show how travel forum posts may be used to forecast tourism volume. The CNN model was used to examine the attitudes of passengers and the various subjects that they discussed both during low- and high-season travel.
Using historical tourism volume, monthly new confirmed cases of travel destinations, travel forum data, and search engine data, it is possible to project tourism volume for the COVID-19 period with satisfactory forecasting performance. The outcomes show that emotion-based and quantitative variables work together to estimate tourism demand.
The rest of the paper is organized as follows. Section 2 provides a detailed literature review of the common methods of tourism volume forecasting, tourism forecasting with online community dynamics, and tourism forecasting with search engine data. Section 3 discusses the text mining technique and the proposed ADE-TFT model. Section 4 presents the data retrieval, experiment process, results, and managerial implications. The last section concludes the study and states current limitations and potential future directions.
Literature review
Common methods of tourism volume forecasting
Various pieces of literature discuss methods of tourism demand forecasting. For example, Song et al. [25] reviewed 211 papers published between 1968 and 2018. Their study shed light on the evolution of tourism demand forecasting methods. Tourism volume forecasting models that have been applied are time series analysis approaches, econometric approaches, and emerging artificial intelligence (AI) techniques [26–30]. Popular time series analysis approaches include the autoregressive moving average model, exponential smoothing model, and structural time series model, which perform well in linear forecasting [31]. According to recent systematic reviews, examples of widely used econometric approaches models in tourism demand forecasting are error correction models, autoregressive distributed lag models, VAR, and time-varying parameters [32]. Owing to the strong nonlinear fitting ability of several AI-based techniques, an increasing number of scholars have paid attention to the application of AI in tourism demand prediction, such as artificial neural networks and support vector regression [33, 34]. For example, Bi, Li, and Fan [35] proposed a deep learning model to forecast tourism demand with time-series imaging. Although there are a number of new strategies for estimating tourism demand, none of them is necessarily superior to the others, according to the no free lunch theorems [36].
Most of the existing tourism demand forecasting models are limited to the research on the selection and processing of input variables while ignoring the analysis and interpretation of the coupling relationship between influencing factors and tourism demand [37]. The more important decision-making is in the work of tourism practitioners, the higher the explanatory power required by the model. The interpretability methods commonly used in deep learning are not suitable for time series forecasting. Different from previous studies, this study introduced a TFT model to resolve the heterogeneity of data in tourism demand forecasting to obtain high performance, and also makes time series forecasting interpretable and satisfies the needs of tourism decision-makers.
Tourism forecasting with online community dynamics
Online travel communities can influence the choices of potential visitors. Measuring potential visitors’ dynamics and emotions is necessary to see if predictive information can be extracted to make meaningful tourism demand predictions [38]. Online community dynamics are divided into two categories, namely online reviews and travel forum text. Many studies explore the effects of reviews on tourist behavior [39]. However, only a few studies used online travel community dynamics to conduct tourism forecasting. Colladon et al. [40] analyzed online community dynamics and provided new predictors for tourism demand forecasting. As online reviews sometimes include deceptive content, which is generated by people who share false experiences and judgments to promote businesses, travel forum text appears more authentic and reliable.
The use of travel forum text in tourism forecasting is only emerging [41]. In this study, the performance of travel forum text in tourism demand forecasting is further analyzed. The LDA topic model was used to identify the main topics of travel forum posts, and the CNN model was employed to analyze the mood of travelers and different topics that travelers talked about during travel off-season and peak season.
Tourism forecasting with search engine data
As the Internet develops, tourists become increasingly empowered to obtain information about their tourism destinations anytime and anywhere. Travelers search the Internet for tourism information to make decisions about their future behavior. Therefore, as search engine data have distinct advantages of high frequency and potential to sensitively capture the behavior of travelers, scholars have focused on using popular Internet search data (e.g., Google Trends and Baidu Index) to make tourism predictions [42]. In most cases, search engine data can significantly develop the forecasting performance of tourism demand [43, 44]. For example, Li and Law [45] proposed a decomposition-based perspective to forecast tourist volumes to Hong Kong using Google Trends and obtained satisfactory forecasting performances. Li et al. [46] used principal component analysis to decorrelate the selected Baidu Index to enhance the forecasting performance of tourism demand. Yang et al. [47] compared Baidu data with Google Trends in tourism demand forecasting for Hainan Province. As Baidu Index has a larger market share in China, using Baidu Index can obtain better forecasting performance. Google Trends is selected as the source of search data to forecast tourism demand in the three main European capitals because Google has the biggest market share in Europe.
Keyword selection is a critical step in search engine data modeling [48]. Li et al. [49] summarized two main methods of keyword selection. The first method is to employ Google-related categories provided by Google Trends to make tourism demand forecasts [50]. The second method is to reduce the dimension of search engine data by a few keywords or composite index. The method of choosing appropriate keywords needs to be further explored. Compared with previous studies, this study proposed an innovative method by using LDA to analyze travel forum posts and to select the most predictive search keywords.
Methodology
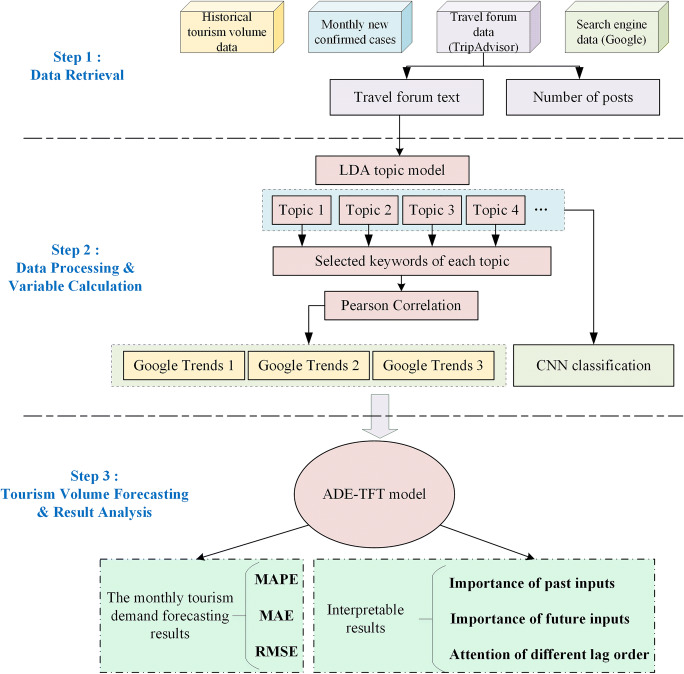
With a focus on enhancing newly confirmed cases, Google Trends, and online media data’s forecasting effectiveness, this study offered a unique data-driven strategy for interpretable tourism volume forecasting for the COVID-19 period. The suggested forecasting method is displayed in Fig. 1. The three European capitals of Paris, Amsterdam, and Lisbon were selected as examples in this study since they are the most visited cities and because the COVID-19 epidemic has a significant impact on their tourism industries. Data from travel forums were gathered from TripAdvisor. The most foretelling search terms from Google Trends were chosen for the unique analysis of travel forum posts using the Latent Dirichlet Allocation (LDA) topic model. A convolutional neural network (CNN), a deep learning model, was used to extract textual features from travel forum entries. Data on newly confirmed cases were gathered each month to reflect the epidemic scenario in popular tourist areas. The ADE-TFT model was then updated with information on textual features, historical tourism volume, monthly new confirmed cases of tourism destinations, Google Trends, and the number of postings.
Fig. 1.
Forecasting framework of this study
Text-convolutional neural network
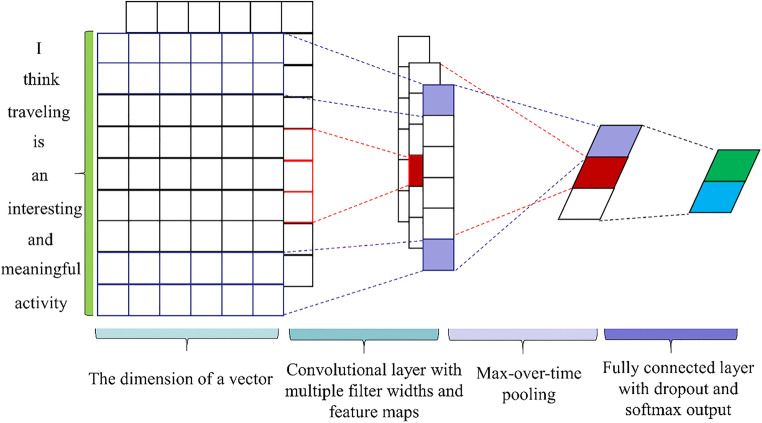
Figure 2 shows the model architecture of the convolutional neural network, which is similar to that of Wu et al. [51]. CNN can learn the interaction between the constituent semantic fragments to make full use of the semantic relations between the modes of the travel forum text [52, 53].
Fig. 2.
The model architecture of the text CNN.
The preprocessing of text data has three steps: the first step is the tokenization and filtering of stop words and punctuation (e.g., “in,” “the,” “is”). Second, we convert each sentence into the same length by the padded sequence. Specifically, a fixed sentence length is determined, then any words that exceed the specified length will be removed, and any sentences that do not reach the specified length will be filled in with zeros. Third, each word is converted into a unique vector by a word embedding model (word2vec).
In convolutional layers with different convolution kernel sizes, vectors of different dimensions are obtained. In the pooling layer, 1-Max-pooling is implemented to extract the maximum feature. Thereafter, the first full connection employs “ReLU” as an activation function, and the second full connection layer uses “Softmax” as an activation function. Finally, the CNN outputs the probability of each class. Note that the probability of each class is the final text features extracted from travel forum posts. The output represents the fluctuation of monthly tourism volume. Tourism volume movement is described as follows:
| 1 |
where represents the tourism volume at month m. When tourism volume increases from the previous month, is 1; otherwise, is 0.
Prediction models
Temporal Fusion Transformers
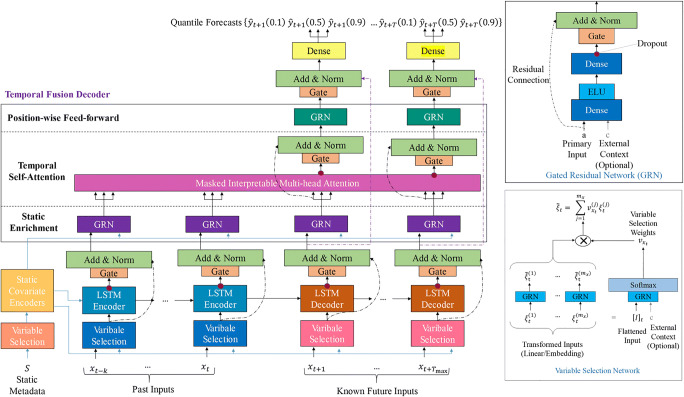
The Google Cloud AI team’s TFT model is a multi-horizon time series prediction deep learning model that is naturally interpretable [54] and has greater explanatory power than the standard black-box model. TFT combines high-performance multilevel forecasting with interpretable insights because multilevel forecasting problems frequently have complicated inputs, such as static covariates, known future inputs, and other exogenous time series that are only observed historically. Use sequence-to-sequence layers for local processing of known and observed inputs, a static covariate encoder to encode context vectors, sample-dependent variable selection to reduce irrelevant inputs, and temporal self-attention that uses a decoder to understand any long-term dependencies in the dataset. Figure 3 depicts the model architecture of the TFT. TFT can effectively create feature representations for each input type using canonical components, which enhances prediction performance for a variety of prediction tasks.
Fig. 3.
The model architecture of TFT
The gating mechanism, variable selection network, static covariate encoder, temporal processing, and multilevel prediction interval prediction are the five basic parts of the TFT. a)Gating mechanism, which has the purpose of skipping over all architectural elements that are not in use while supplying adjustable depth and network complexity to adapt to various datasets and circumstances; b)The variable selection network chooses the corresponding input variable at each time step; c) the static covariate encoder integrates static features into the network and constraints temporal dynamics by encoding context vectors; d) Temporal processing, which involves the acquisition of long-term or short-term temporal associations from observations or known time-varying inputs. Sequence-to-sequence layers are utilized for local processing, whilst long-term terms rely on a new interpretable multi-head attention block capture; e) Multi-level prediction interval prediction utilizing quantile prediction to establish the range of probable target values inside each prediction interval. The complete details of TFT are provided in the reference [54].
The proposed ADE-TFT model
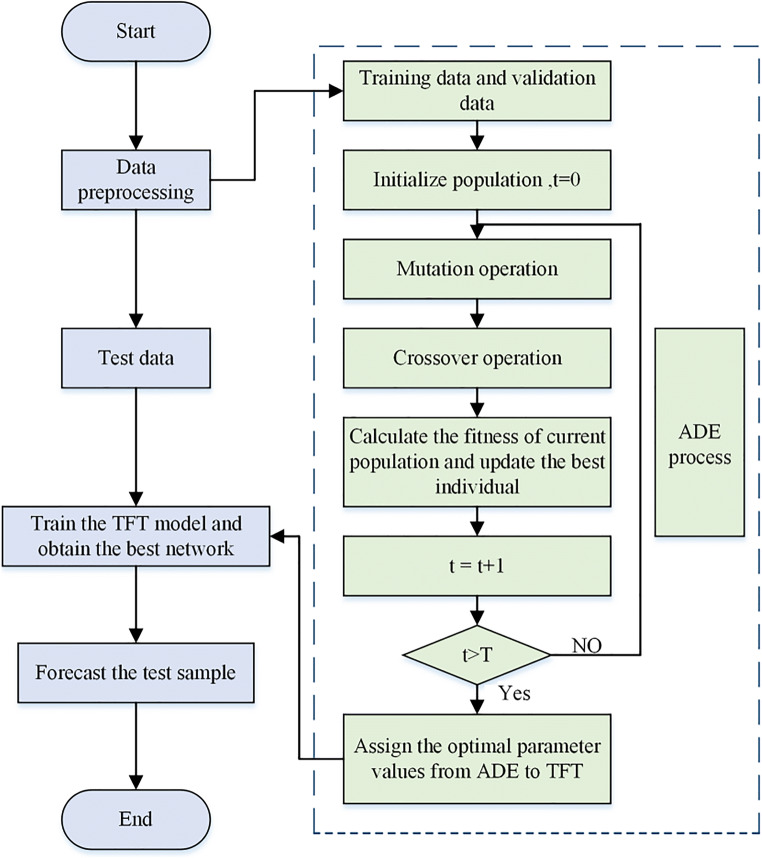
The performance and accuracy of the TFT are significantly influenced by its characteristics. The task of choosing the ideal set of six hyperparameters is quite challenging. Thus, to fulfill this work, a trustworthy and effective algorithm should be applied. Due to its effectiveness and simplicity, adaptive differential evolution (ADE) is one of the best evolutionary optimization methods [55, 56]. Evolutionary optimization algorithms can search for a larger range of parameters than the current neural network parameter tuning method, such as optimizing the input step size, which is not available in many parameters tuning methods. Therefore, in this work, the ideal TFT combination for the six hyperparameters is chosen using ADE. The parameters that have been chosen include the number of time steps, learning rates, batch sizes, hidden layer counts, consecutive hidden layer counts, and attention head counts. Figure 4 depicts ADE-TFT. The following lists the specifics of the optimization processes.
Fig. 4.
Flowchart of the ADE-TFT model
-
Step 1:
Data preparation, validation, and testing data make up the dataset.
-
Step 2:
Initializing ADE’s parameters and population. The following parameters are set: population size (NP), maximum iteration number of ADE (T), mutation factor range (F), crossover factor range (CR), and gene range. According to the gene range, a random population is created.
-
Step 3:
Following the mutation, crossover, and selection operations, the population of the following generation is created. Equation 2 determines the mutation factor. The validation set’s MAPE is used to calculate the fitness value.
| 2 |
, represent the maximum and minimum values of the variation factor, respectively. represents the maximum number of iterations, and represents the current number of iterations.
-
Step 4:
Step 3 is repeated up to the allotted number of times.
-
Step 5:
The TFT model is given the ideal hyperparameter from the ideal ADE individual. The training and validation sets of data are used to train the TFT model.
-
Step 6:
The TFT model with the best training predicts the test dataset.
Experimental study
Key tourist cities, namely Paris, Amsterdam, and Lisbon are chosen to verify the reliability of the proposed forecasting methodology. All input variables (historical tourism volume data, newly confirmed cases, Google Trends, number of posts, and CNN values) are linearly scaled to fit within the range [0.1, 0.9] to enhance forecasting performance and avoid potential numerical problems [57]. The ADE-TFT model and other comparable models were coded in Python 3.8. The computation was evaluated on an effective computer with an Intel (R) Core (TM) i7-10700 K CPU, 3.80 GHz, 32 GB RAM, and Windows 10 system. The CNN models and ADE-TFT models are available on GitHub (https://github.com/wubinrong-hub/CNN-and-ADE-TFT-model).
Data retrieval and preprocessing
The collection and preprocessing processes of tourism volume data, newly confirmed cases, travel forum data, and Google Trends data are given as follows.
-
Tourism volume data
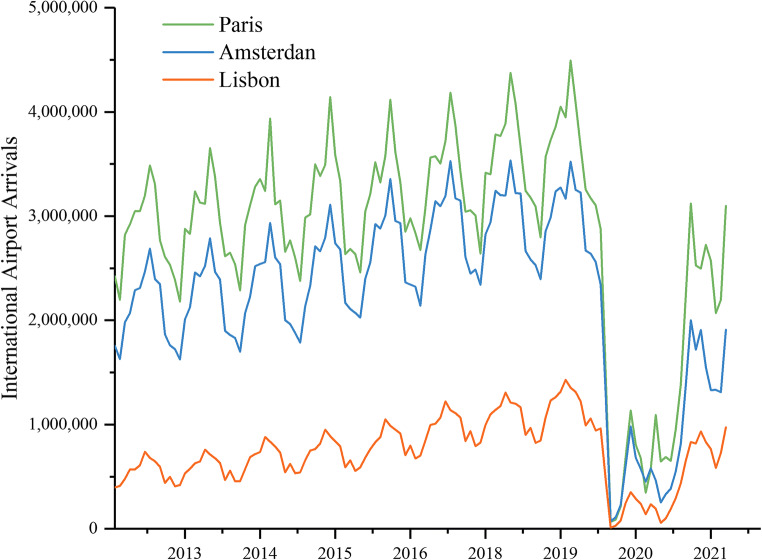
Based on the number of international arrivals for the year 2020 according to EUROSTAT (https://ec.europa.eu/eurostat/data/database), the top 3 European capitals are Paris, Amsterdam, and Lisbon. As shown in Table 1, the number of international arrivals in Paris is measured by arrivals in PARIS-CHARLES DE GAULLE airport and PARIS-ORLY airport. The number of international arrivals in Amsterdam and Lisbon is measured by arrivals in AMSTERDAM/SCHIPHOL airport and LISBOA airport, respectively. Figure 5 shows the monthly international airport arrivals from January 2012–to March 2022. In this graphic representation, the tourism volume of the three European cities presents a cyclic pattern and an increasing trend before 2020. However, since 2020, the tourism volume has changed dramatically, especially in March 2020 and April 2020.
-
Monthly new confirmed cases
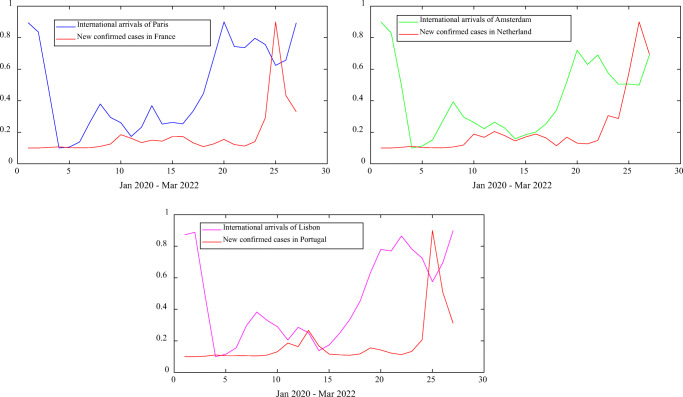
This study gathered information on new confirmed cases every month in France, Portugal, and the Netherlands from the World Health Organization’s official website (https://covid19.who.int/), as the severity of the COVID-19 outbreak in a tourist area influences the traveler’s plans. The temporal series of foreign arrivals in Paris, Amsterdam, and Lisbon as well as newly confirmed cases in France, the Netherlands, and Portugal are displayed in Fig. 6. These datasets are linearly scaled to match the range [0.1, 0.9] in order to clearly demonstrate the association between these data. From Fig. 6, it is intuitively clear that when the COVID-19 outbreak in the area is severe, visitor numbers will fall sharply, and when the number of confirmed cases falls, visitor numbers will sharply increase. Based on this, this analysis forecasts tourism demand while taking into account the number of new confirmed cases in the neighborhood to reflect the severity of the COVID-19 pandemic there.
-
Travel forum data
Internet data could facilitate forecasting tourism volume to tourist destinations. TripAdvisor (www.tripadvisor.com), which is a leading travel guidance platform, is a suitable candidate for analyzing traveler thoughts and interactions. With more than 884 million reviews and opinions about nearly 8 million businesses, TripAdvisor allows travelers to find accommodations, book experiences, book a table at restaurants, and discover key attractions. The platform features an online forum where people can exchange travel tips and opinions and share personal experiences that can influence the travel decisions of future travelers. As a well-established travel recommendation platform with a steady stream of posts, TripAdvisor can provide mass and high-quality data for our study.
We extracted two main types of data from the platform, namely the number of posts and travel forum text. The number of posts could reflect the popularity of a tourist destination. This number of posts is calculated by the sum of questions and responses in a specific forum, such as the Paris Travel Forum, Amsterdam Travel Forum, and Lisbon Travel Forum. The travel forum text consists of the topic headline of a forum. As the headline states the core information of the post and the full post contains irrelevant information, we chose to analyze post headlines in this research.
A total of 122,807 posts published from January 2012 to March 2022 were collected from Paris Forum, Amsterdam Forum, and Lisbon Forum. To facilitate the measurement of semantic analysis, we only collected posts written in the English language. Although the cities discussed in the study speaks French, Dutch, and Portuguese, more than 90% of the posts on the three forums were in English. All travel forum posts were combined according to month into a sample consisting of 123 observations.
-
Google Trends data
Google Trends data were gathered from Google’s search engine (Google Trends, http://www.google.com/trends). The search behaviors of tourists when they look for information about travel destinations to organize their trips are recorded and constitute Google Trends. Search keywords are designed according to the following steps:- LDA model was used to analyze the text in forum travel posts (e.g., Paris Forum) and to divide these posts into several topics. These topics generally refer to major aspects of traveling such as lodging, shopping, traffic, dining, recreation, and tour.
- We chose several topic words from each topic, which can reflect the main characteristic of each topic, to form search keywords. The topic words, which are obtained by using LDA, reflect hot topics or tourist destinations on the travel forum.
- Given those low-heat keywords are not reflected on Google Trends, the considered keywords were used to select Google Trends and to check whether the corresponding search query volume data exist.
- Pearson correlation was employed to refine the data from Google Trends. Three Google Trends with the highest Pearson correlation were determined as inputs to the prediction model.
Table 1.
Top 3 European capital cities with the highest number of international arrivals in 2020
| City | Airport | Period |
|---|---|---|
| Paris |
PARIS-CHARLES DE GAULLE airport PARIS-ORLY airport |
Jan 2012- Mar 2022 |
| Amsterdam | AMSTERDAM/SCHIPHOL airport | Jan 2012- Mar 2022 |
| Lisbon | LISBOA airport | Jan 2012- Mar 2022 |
Fig. 5.
International airport arrivals in Paris, Amsterdam, and Lisbon
Fig. 6.
Time series of international arrivals and new confirmed cases
Forecasting procedure
All input variables were collected on a monthly basis. Figure 7 illustrates the training, validation, and testing periods of the tourism volume forecasting model. The time span of the CNN model covered the period from 2012:1 to 2022:3. In the CNN model, the time span of the training period was from 2012:1 to 2017:8, including 68 monthly observations. The test period was from 2017:9 to 2022:3, including 55 monthly observations. The output of the CNN model in the test period is employed as the input variables of the tourism volume forecasting model. In the tourism volume forecasting model, the time span of training, validation, and testing covered the periods 2017:9 to 2021:1, 2021:2 to 2021:7, and 2021:8 to 2022:3, respectively. A rolling window was employed to estimate the tourism volume forecasting model.
Fig. 7.
Training, validation, and testing periods of tourism volume forecasting model
Text mining using the LDA topic model
The topic of travel-related forum postings was examined using the Latent Dirichlet Allocation (LDA) topic model [58]. Tables 2 and 3 show, respectively, the fuzziness and coherence of subject numbers ranging from 3 to 8. The LDA model’s prediction accuracy is measured by the perplexity evaluation metric, and topic quality is gauged by the coherence evaluation metric. So confusion and coherence are combined to determine the topic numbers. Both perplexity and coherence suggest that the ideal number of topics for the Paris dataset should be 5, whereas the ideal number for the Lisbon dataset should be 3. In contrast, the perplexity and coherence suggest different topic counts for the Amsterdam datasets. The optimal number of topics in the Amsterdam dataset is 3, as there is little difference in perplexity between the number of topics of 3, 4, and 5, but there is a significant difference in coherence; therefore, we choose the smallest coherence. As shown above, the findings imply that 5, 3, and 4 are the ideal topic numbers for Paris, Amsterdam, and Lisbon. As a result, there are primarily 5, 3, and 4 subjects in each post in the Paris, Amsterdam, and Lisbon forums, respectively.
Table 2.
The perplexity of different topic numbers
| Number of topics | Paris | Amsterdam | Lisbon |
|---|---|---|---|
| 3 | 856.12 | 743.62 | 589.53 |
| 4 | 855.84 | 740.69 | 585.98 |
| 5 | 850.39 | 743.93 | 589.90 |
| 6 | 856.33 | 746.75 | 586.72 |
| 7 | 860.11 | 749.42 | 588.85 |
| 8 | 858.67 | 751.77 | 595.80 |
The lower the perplexity, the higher the LDA model prediction accuracy
Table 3.
The coherence of different topic numbers
| Number of topics | Paris | Amsterdam | Lisbon |
|---|---|---|---|
| 3 | -6.51 | -8.24 | -11.96 |
| 4 | -7.41 | -10.19 | -11.03 |
| 5 | -6.09 | -9.88 | -11.32 |
| 6 | -8.90 | -11.40 | -12.47 |
| 7 | -9.03 | -11.35 | -12.85 |
| 8 | -9.98 | -12.65 | -12.64 |
The higher the consistency, the higher the topic quality obtained by the LDA model
Based on the statistical inferences obtained by using LDA, Table 4 depicts their topic and word distributions. The 20 topic words in each topic are identified by the largest weightings (i.e., term frequency-inverse document frequency, TF–IDF). These topic words reflect hot topics in the forum and impact factors of tourism arrivals. The following analysis takes the Paris dataset as an example. Topic 1 mainly represents words related to transportation, for example, “cdg,” “train,” “metro,” “airport,” and “gare.” The words “restaurant,” “location,” “apartment,” “hotel,” and “credit” in topic 2 may suggest questions about Paris lodging and dining. Furthermore, Topic 3 may reflect family trips according to specific words such as “Disneyland,” “kid,” and “honeymoon.” In addition, “transfer,” “cdg,” and “flying” in topic 4 may suggest discussions about tourist flight connections. Topic 5 may reflect discussions about tourist attractions (“Eiffel,” “itinerary,” “museum”, and “Louvre”) and recreation (“itinerary” and “cruise”). These topics are extracted by using LDA models and contain qualitative information that is difficult to reflect using statistical indicators. Analyzing topics discussed in travel forums in different periods may facilitate tourism volume forecasting.
Table 4.
Topic words in forum posts
| City | Type | Number of posts | Top 20 topic words |
|---|---|---|---|
| Paris (A total of 80,720 posts) | Topic 1 | 17,396 (21.55%) | Hotel, stay, cdg, train, metro, Paris, airport, gare, advice, Nord, recommendation, April, Orly, car, transportation, Lyon, Easter, lunch, shop, nightlife |
| Topic 2 | 7676 (9.51%) | Apartment, restaurant, rental, travel, location, Paris, visit, June, hotel, German, birthday, September, company, experience, centre, finding, credit, refund, tax | |
| Topic 3 | 6710 (8.31%) | Tour, France, dinner, Montparnasse, air, nice, Paris, Disneyland, private, view, walking, tourist, free, fare, parking, honeymoon, visitor, hotel, guided, kid | |
| Topic 4 | 21,037 (26.06%) | Paris, trip, day, taxi, Marais, station, transfer, 1st, flying, French, cdg, card, report, quick, central, food, buying, hotel, Halle, dining | |
| Topic 5 | 27,900 (34.56%) | Question, Eiffel, tower, itinerary, ticket, pas, bus, museum, louvre, buy, Chales, Gaulle, Paris, book, cruise, flight, Moulin, airport, Saint, hotel | |
| Amsterdam (A total of 27,444 posts) | Topic 1 | 5421 (19.75%) | Hotel, restaurant, Amsterdam, bus, layover, travel, tram, Paris, hour, airport, day, recommendation, shop, walking, family, food, train, coffee, Indonesian, tour |
| Topic 2 | 9329 (33.99%) | Amsterdam, trip, Keukenhof, tour, stay, canal, city, central, cruise, card, tulip, Schipol, visit, Brussels, bar, accommodation, rental, car, bike, Easter | |
| Topic 3 | 12,694 (46.25%) | Train, question, airport, ticket, Schipol, night, Amsterdam, museum, station, transfer, house, hotel, suggestion, location, frank, Anne, Bruges, April, day, windmill | |
| Lisbon (A total of 14,643 posts) | Topic 1 | 1525 (10.41%) | Train, Portugal, travel, station, weather, ticket, Lisbon, cost, June, local, luggage, price, purchase, advance, activity, passport, dining, bike, English, COVID-19 |
| Topic 2 | 2625 (17.93%) | Trip, stay, restaurant, question, Lisbon, Sintra, fado, apartment, beach, advice, cruise, traveling, flight, family, football, connection, July, Portugal, report, airport | |
| Topic 3 | 4927 (33.65%) | Lisbon, car, day, Porto, rental, transport, night, tour, Cascais, faro, train, airport, public, visit, Benfica, weekend, stay, food, bar, Easter | |
| Topic 4 | 5566 (38.01%) | Hotel, airport, taxi, bus, Lisbon, card, metro, hour, suggestion, recommendation, transfer, layover, transportation, Lagos, free, Oriente, market, stopover, map, breakfast |
The words in bold are selected to determine Google Trends. Repeated words are not marked
Extracting text features with CNN classification
The CNN classification was used to extract text features from travel forum posts. The hyperparameter combination of CNN was selected by the grid search method. After several parameter experiments, Table 5 depicts the final CNN parameters of the Paris, Amsterdam, and Lisbon datasets, respectively. Table 6 shows the results of the CNN model. CNN classification has achieved satisfactory performance in all three data sets.
Table 5.
CNN parameters of each dataset
| Data sets | Parameter combination |
|---|---|
| Paris | The max number of words in corpus = 11,000; the max sequence lengths = 4000; batch size = 55; number of filters = 128; filter size = 3,4,5; embedding dimension = 100; drop out probability = 0.5; l2 regulation = 0. |
| Amsterdam | The max number of words in corpus = 9000; the max sequence lengths = 850; batch size = 60; number of filters = 128; filter size = 3,4,5; embedding dimension = 200; drop out probability = 0.5; l2 regulation = 0. |
| Lisbon | The max number of words in corpus = 5500; the max sequence lengths = 450; batch size = 55; number of filters = 64; filter size = 2,3,4; embedding dimension = 200; drop out probability = 0.5; l2 regulation = 0. |
Table 6.
Results of CNN classification
| City | Accuracy | Precision | Recall | F1-measure |
|---|---|---|---|---|
| Paris | 0.67 | 0.66 | 0.61 | 0.63 |
| Amsterdam | 0.70 | 0.70 | 0.71 | 0.70 |
| Lisbon | 0.73 | 0.73 | 0.71 | 0.72 |
The following formulas are used to calculate accuracy, precision, recall, and F-measure: ; ; ; , where TP means the number of positive cases which are classified as positive; FP means the number of positive cases which are categorized as negative; TN means the number of negative cases which are classified as negative; FN is the number of positive cases which are categorized as negative
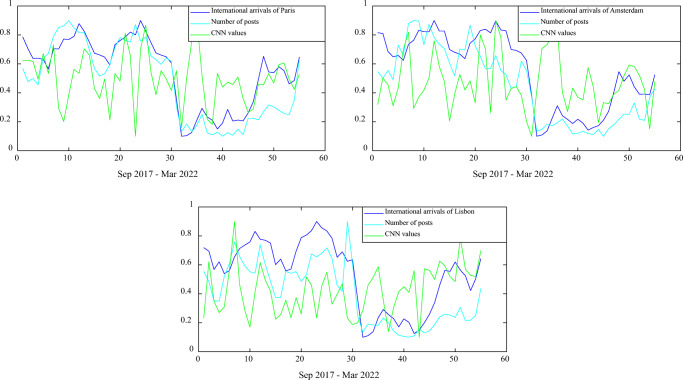
Figure 8 shows the time series of international arrivals, the number of posts, and CNN classifications. The number of posts and CNN values show similar trends in terms of tourism volume, either contemporarily or with a slight lag. The fluctuation of CNN values can be used as an indicator of the increase or decline of tourist volume. Moreover, the number of posts and Google Trends can suggest the amplitude of tourism demand fluctuation, either increase or decline. Thus, combining CNN values, the number of posts, and Google Trends is a scientific approach when forecasting precise tourism volume.
Fig. 8.
Time series of international arrivals, the number of posts, and CNN classifications
Google Trends selection by topic words
As shown in Table 7, the topic words in bold are selected to determine Google Trends. These topic words, which can reflect the main characteristic of each topic, are used to form search keywords. For example, the words “train,” “metro,” and “airport” from topic 1 in the Paris Forum reflect discussions about transportation, similar to the theme of topic 1. However, the words “stay,” “recommendation,” and “advice” are unrepresentative, and cannot search Google Trends related to Paris travel. The keywords of each topic are selected and shown in Table 7. Given that a topic word is a single word, we have supplemented it with the name of the travel destination or the special meaning of tourism. For example, “tour” from the Paris Forum denotes the keywords of the Paris tour, and “Eiffel” clearly suggests the keywords of The Eiffel Tower.
Table 7.
Keywords or search topics selected by topic words generated using the LDA model
| Type | Paris (A total of 30 keywords) | Amsterdam (A total of 20 keywords) | Lisbon (A total of 28 keywords) |
|---|---|---|---|
| Topic 1 | Cdg → Paris Charles de Gaulle Airport | Hotel → Amsterdam hotel | Train → Lisbon train |
| Train → Paris train | Restaurant → Amsterdam restaurant | Portugal → Portugal | |
| Metro → Paris metro | Amsterdam → Amsterdam | Travel → Lisbon travel | |
| Paris → Paris | Bus → Amsterdam bus | Station → Lisbon station | |
| Airport → Paris airport | Travel → Amsterdam travel | Weather → Lisbon weather | |
| Gare → Paris gare | Paris → Paris | Lisbon → Lisbon | |
| Orly → PARIS ORLY airport | Airport → Amsterdam airport | Passport → Lisbon passport | |
| Transportation → Paris transportation | Shop → Amsterdam shop | Dinner → Lisbon dinner | |
| Lyon → Lyon | Food → Amsterdam food | - | |
| Shop → Paris shop | Train → Amsterdam train | - | |
| - | Tour → Amsterdam tour | - | |
| Topic 2 | Apartment → Paris apartment | Trip → Amsterdam trip | Trip → Lisbon trip |
| Restaurant → Paris restaurant | Keukenhof → Keukenhof | Restaurant → Lisbon restaurant | |
| Travel → Paris travel | Cruise → Amsterdam cruise | Sintra → Sintra | |
| Hotel → Paris hotel | Tulip → Amsterdam tulip | Beach → Lisbon beach | |
| - | Schipol → Schipol airport | Cruise → Lisbon cruise | |
| - | Brussels →Brussels | Traveling → Lisbon traveling | |
| - | Bar → Amsterdam bar | Flight → Lisbon flight | |
| - | - | Airport → Lisbon airport | |
| Topic 3 | Tour → Paris tour | Museum → Amsterdam museum | Porto → Porto |
| France → France | Station → Amsterdam station | Transport → Lisbon transport | |
| Montparnasse → Montparnasse | - | Tour → Lisbon tour | |
| Disneyland → Disneyland Resort Paris | - | Benfica → Benfica | |
| - | - | Food → Lisbon food | |
| Bar → Lisbon bar | |||
| Topic 4 | Taxi → Paris taxi | - | Hotel → Lisbon hotel |
| Station → Paris station | - | Taxi → Lisbon taxi | |
| French → French | - | Bus → Lisbon bus | |
| Food → Paris food | - | Metro → Lisbon metro | |
| - | - | Transportation → Lisbon transportation | |
| - | - | Lagos → Lagos | |
| Topic 5 | Eiffel → The Eiffel Tower | - | - |
| Itinerary → Paris itinerary | - | - | |
| bus → Paris bus | - | - | |
| Museum → Paris museum | - | - | |
| Louvre → Louvre | - | - | |
| Chales → PARIS-CHARLES DE GAULLE airport | - | - | |
| Cruise → Paris cruise | - | - | |
| Flight → Paris flight | - | - |
“a → b” means that the topic words “a” identify the search topic of Google Trends “b”
Table 8 summarizes the Pearson correlation of the selected Google Trends with the tourism volumes of Paris, Amsterdam, and Lisbon. Three Google Trends with the highest Pearson correlation for each dataset are determined. Thus, the keywords “Paris museum,” “Paris flight,” and “Paris airport” are determined as the final Google Trends of the Paris dataset. The keywords “Amsterdam station,” “Amsterdam tour,” and “Amsterdam food,” are selected as the final Google Trends of the Amsterdam dataset. The keywords “Lisbon restaurant,” “Lisbon airport,” and “Lisbon,” are selected as the inputs of the Lisbon tourism volume forecasting.
Table 8.
Google Trends and their correlation coefficients with Paris, Amsterdam, and Lisbon tourist volume
| Paris | Amsterdam | Lisbon | |||
|---|---|---|---|---|---|
| Keywords | Pearson Correlation | Keywords | Pearson Correlation | Keywords | Pearson Correlation |
| Paris museum | Amsterdam station | Lisbon restaurant | |||
| Paris flight | Amsterdam tour | Lisbon airport | |||
| Paris airport | Amsterdam food | Lisbon | |||
| Paris cruise | Brussels | Lisbon food | |||
| Paris food | Amsterdam airport | Lisbon metro | |||
| Paris hotel | Amsterdam bus | Lisbon tour | |||
| Paris station | Amsterdam cruise | Lisbon bus | |||
| Paris train | Amsterdam | Lisbon bar | |||
| PARIS ORLY airport | Amsterdam trip | Lisbon station | |||
| Paris metro | Schipol airport | Lisbon flight | |||
The table only shows the top 10 keywords of Pearson Correlation. ** denotes that the keywords and tourism volume have a significant correlation at the 1% level (two-tailed). The words in bold are the top three Google Trends associated with tourism volume
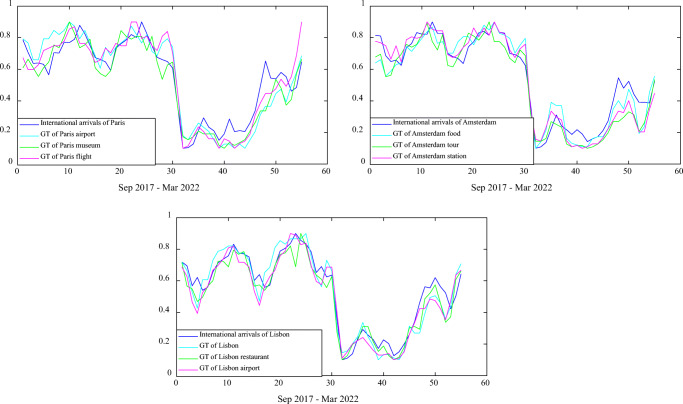
Figure 9 shows the time series of international arrivals and these Google Trends. Google Trends show very similar trends in international arrivals, either contemporarily or with a slight lag. This finding suggests that Google Trends could be a satisfactory predictor of tourist arrivals.
Fig. 9.
Time series of international arrivals and Google Trends
Tourism volume forecasting
-
Performance measures
A percentage error and two scale-dependent errors, namely MAPE, RMSE, and MAE, are employed to evaluate the accuracy of tourism volume forecasting. Their mathematical equations are as follows:3 4 5 where is the size of forecasts, denotes the actual value of tourism volume at month t, and denotes the predicted tourism volume at month t.
-
Comparable models
Popular time-series forecasting models, such as ARIMAX, SARIMAX, SVM, BPNN, and LSTM, were utilized in this work to forecast tourism volume as comparative models [59–64]. These forecasting models used monthly tourist volume as an output variable and historical tourism volume data, newly confirmed cases, and big data indices (such as Google Trends and travel forum data) as input variables. One-step-ahead prediction is used by all prediction models.-
(iii)Parameter set
The grid search method was applied to select the parameters of ADE. The parameters of the ADE-TFT model in the three data sets are listed in Table 9. The search range of TFT parameters is as follows: the range of the number of batch sizes is set within [5,20]; the number of attention heads, [1,4]; the number of hidden layers, [2,8]; the number of consecutive hidden layers [2,8]; the number of time steps, [2,12]; learning rates, [0.001,0.1]. The final parameters of ADE-TFT are shown in Table 9. With Paris dataset as an example, Table 10 shows the input variables of the TFT model.
The grid search method is applied to determine the parameters of the comparable models. According to the results of a series of experiments, Table 11 presents the final parameter values of comparable models in all examples.
-
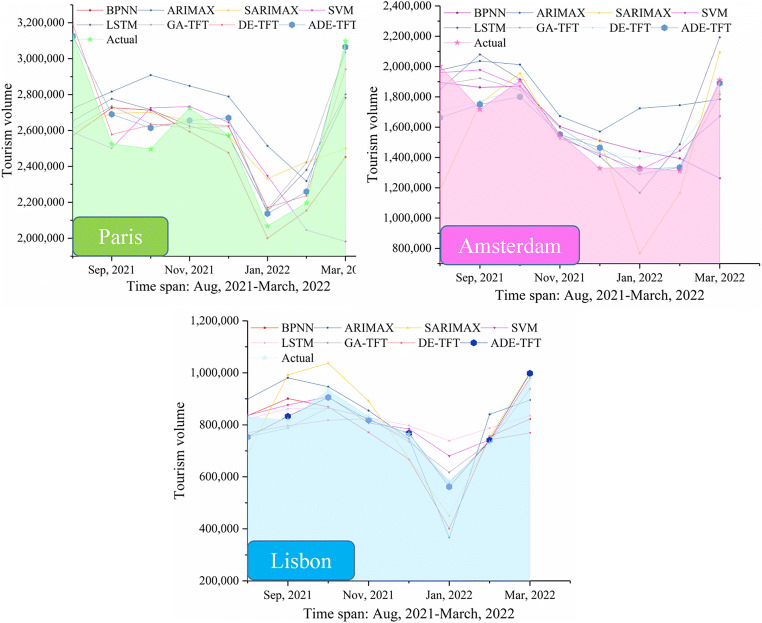
(iv)Results and discussionThe prediction performance of ADE-TFT is superior to that of BPNN, ARIMAX, SARIMAX, SVM, and LSTM, according to the results of the predictions provided in Table 12. This is because ADE-TFT has a good capacity to fit data with complicated fluctuations. Additionally, this study contrasted the ADE-TFT model with the fundamental genetic algorithm (GA) and the differential evolution algorithm (DE) to improve the TFT model in order to assess the ADE algorithm’s capacity for optimization. The findings demonstrate that the ADE algorithm is a superior way for determining appropriate parameters for the TFT model, as the ADE-TFT model predicts outcomes better than the DE-TFT model and the GA-TFT model do in the majority of circumstances. The prediction performances of various models are displayed in Fig. 10. The expected tourism volume in the graphic was forecasted using ADE-TFT models, which is closer to the actual tourism volume than it was predicted using other comparable models. This result implies that the ADF-TFT model is a reliable forecasting model for tourism demand.The predicting performances of various forecasting models using various predictors are shown in Table 13. Due to the impact of the COVID-19 pandemic, tourism volume has fluctuated sharply in recent years, so only using historical tourism volume to forecast tourism has achieved poor results as shown in Table 13. Whereas, when new confirmed cases are considered in the tourism volume prediction, the results will be significantly improved. In the majority of situations, combining historical tourism volume, fresh evidence of popular tourist destinations, Google Trends, the volume of posts, and CNN text characteristics can improve prediction performance compared to utilizing fewer factors in projecting tourism volume in Paris, Amsterdam, and Lisbon. Utilizing the Paris datasets as an example, the MAPE of the suggested model increased from 7.37 to 3.10% when compared to using only historical tourism volume, new confirmed cases of tourist destinations, and Google Trends. The outcomes show that multisource big data is preferable for predicting tourism volume over the COVID-19 period.
-
(iii)
-
Interpretable results and analysis
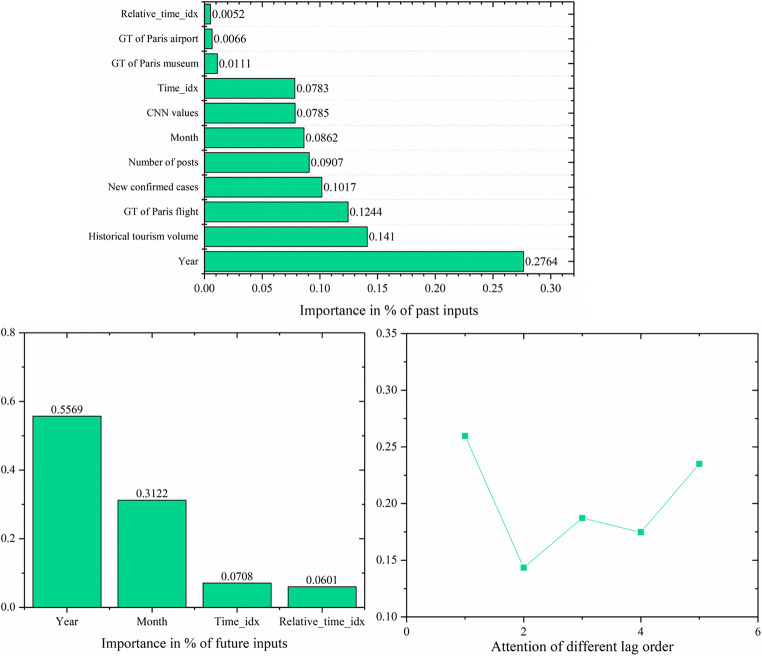
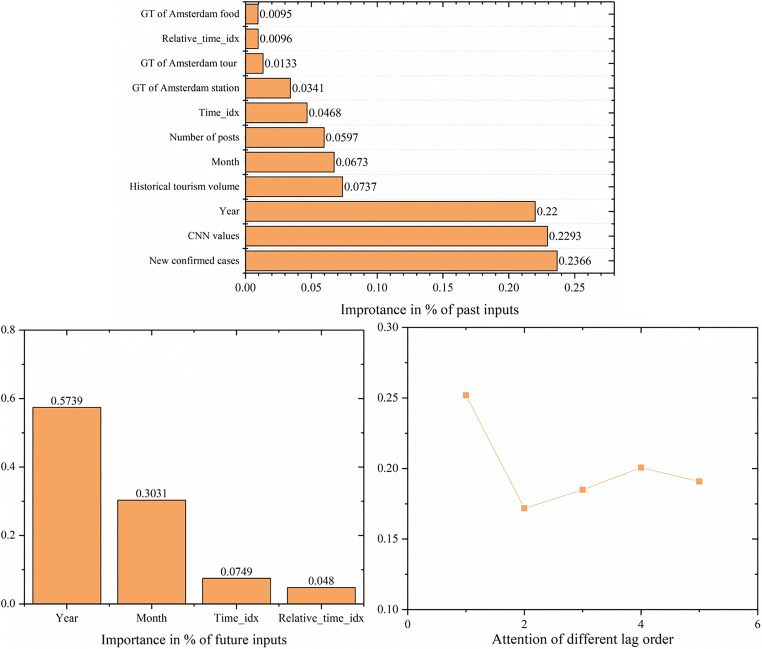
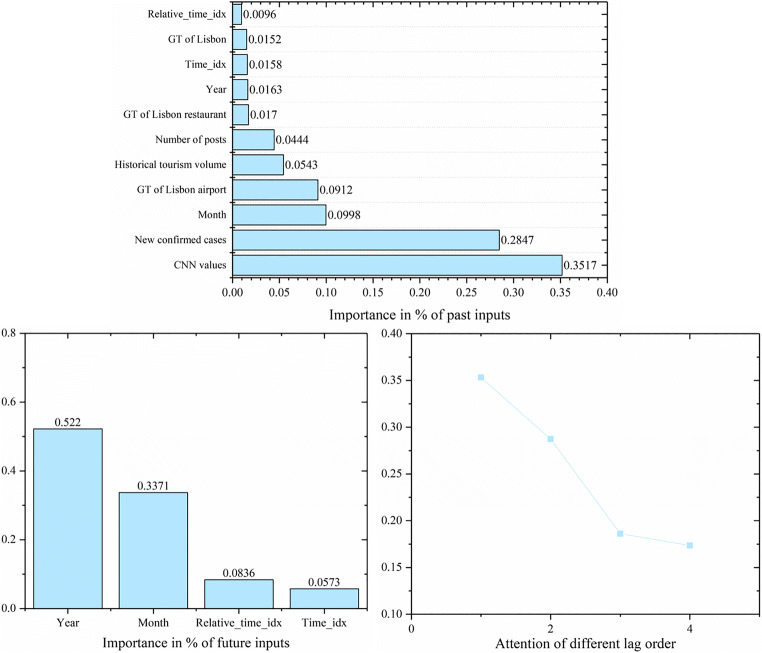
The interpretable outcomes of the ADE-TFT model are shown in Figs. 11, 12 and 13. The following explanation is broken up into three sections: the attention of various lag orders, the importance order of previous inputs, and the importance order of future variables. The following is a thorough study of the results that can be understood:- When evaluating the significance of historical inputs, it was discovered that Google Trends, CNN features, the number of postings, and monthly new confirmed instances were the most beneficial for travel forecasts. The higher contribution of the monthly new confirmed cases to the tourism prediction suggests that the epidemic condition and the policies of tourist destinations for preventing epidemics have emerged as the primary concerns and barriers to travel. As seen in Figs. 11, 12 and 13, the interpretable results indicate that CNN values and the number of posts have significant explanatory power for estimating tourism volume in the majority of situations. In other words, information from travel forums can contribute to projecting tourism volume in additional ways.
- According to the relevance of known variables, the year is more useful to the forecast of tourism demand than the month, showing that the COVID-19 pandemic has significantly affected travel demand since 2020.
- The overall tendency of attention shifts is that the input variables contribute more to the forecast of tourism demand the shorter the lag order. However, longer lag sequences can occasionally be correlated with more attentiveness. For instance, the attention value with a lag order of five in the Paris sample is 23.5%, occupying a greater component. Determining the optimal lag sequence is crucial since this necessitates that the predictive model has the memory capacity to retrieve long-term inputs, which also supports the need for employing ADE to optimize the TFT parameters suggested in this study.
Table 9.
Parameters of the ADE-TFT in the three data sets
| Parameter | Paris | Amsterdam | Lisbon | |
|---|---|---|---|---|
| ADE | Population size () | 15 | 20 | 20 |
| Maximum number of iterations () | 30 | 30 | 35 | |
| Crossover probability (CR) | 0.2 | 0.3 | 0.2 | |
| Mutation operator (F) | [0,1] | [0,1] | [0,1] | |
| TFT | Number of time steps | 5 | 5 | 4 |
| Number of batch sizes | 16 | 18 | 15 | |
| Learning rates | 0.072 | 0.048 | 0.069 | |
| Number of hidden layers | 8 | 6 | 8 | |
| Number of attention heads | 1 | 1 | 1 | |
| Number of consecutive hidden layers | 4 | 4 | 4 |
Table 10.
Inputs of the ADE-TFT in the Paris dataset
| Static covariates | Past inputs | Known future inputs |
|---|---|---|
| ID (name of tourism volume series) | GT of Paris airport | Year |
| - | GT of Paris museum | Month |
| - | GT of Paris flight | Time index |
| - | CNN values | Relative time index |
| - | Number of posts | - |
| - | Historical tourism arrivals data | - |
| - | Monthly new confirmed cases | - |
| - | Year | - |
| - | Month | - |
| Time index | ||
| Relative time index |
Table 11.
Parameters of the different comparable models
| Model and Variable | Adopted parameters |
|---|---|
| BPNN(Paris) | hidden neurons = 4; learning rate = 0.005; epochs = 200 |
| BPNN(Amsterdam) | hidden neurons = 4; learning rate = 0.005; epochs = 250 |
| BPNN(Lisbon) | hidden neurons = 5; learning rate = 0.005; epochs = 300 |
| ARIMAX(Paris) | p, d, q= (2,0,1) |
| ARIMAX(Amsterdam) | p, d, q= (1,0,1) |
| ARIMAX(Lisbon) | p, d, q= (1,0,0) |
| SARIMAX(Paris) | p, d, q= (1,0,1); P, D, Q = (0,0,1) |
| SARIMAX(Amsterdam) | p, d, q= (0,0,1); P, D, Q = (1,0,1) |
| SARIMAX(Lisbon) | p, d, q= (2,0,1); P, D, Q = (1,0,1) |
| SVM(Paris) | kernel = “rbf”; gamma = 0.1.; C = 3.1 |
| SVM(Amsterdam) | kernel = “rbf”; gamma = 0.24; C = 2.2 |
| SVM(Lisbon) | kernel = “rbf”; gamma = 0.03; C = 3.2 |
| LSTM(Paris) | batch size = 22; hidden neurons = 15; epochs = 300 |
| LSTM(Amsterdam) | batch size = 23; hidden neurons = 20; epochs = 350 |
| LSTM (Lisbon) | batch size = 25; hidden neurons = 25; epochs = 300 |
Table 12.
MAPE, MAE, and RMSE of each model
| Model | Paris | Amsterdam | Lisbon | ||||||
|---|---|---|---|---|---|---|---|---|---|
| MAPE (%) | MAE | RMSE | MAPE (%) | MAE | RMSE | MAPE (%) | MAE | RMSE | |
| BPNN | 8.63 | 244,662 | 324,617 | 10.12 | 170,141 | 252,206 | 11.04 | 84,110 | 101,228 |
| ARIMAX | 11.35 | 290,161 | 313,770 | 15.02 | 220,252 | 260,200 | 11.87 | 86,332 | 110,578 |
| SARIMAX | 9.60 | 257,740 | 321,591 | 15.58 | 251,838 | 367,665 | 12.26 | 94,907 | 108,025 |
| SVM | 10.84 | 301,825 | 459,945 | 6.47 | 106,071 | 139,231 | 6.99 | 56,588 | 84,579 |
| LSTM | 7.43 | 200,888 | 242,408 | 9.52 | 154,130 | 193,138 | 8.46 | 64,195 | 82,839 |
| GA-TFT | 6.61 | 174,910 | 224,792 | 5.24 | 87,321 | 102,849 | 4.39 | 35,918 | 43,197 |
| DE-TFT | 3.32 | 86,347 | 94,911 | 5.99 | 98,611 | 129,738 | 3.59 | 30,844 | 47,916 |
| ADE-TFT | 3.10 | 76,826 | 89,724 | 4.76 | 83,398 | 135,584 | 3.02 | 24,442 | 32,532 |
The bold values denote the best prediction performance of all models
Fig. 10.
Predicted and actual tourism volume in Paris, Amsterdam, and Lisbon from August 2021 to March 2022
Table 13.
MAPE, MAE, and RMSE of different inputs
| Model and Variable | Paris | Amsterdam | Lisbon | ||||||
|---|---|---|---|---|---|---|---|---|---|
| MAPE (%) | MAE | RMSE | MAPE (%) | MAE | RMSE | MAPE (%) | MAE | RMSE | |
| ADE-TFT(HTV) | 12.62 | 338,397 | 400,832 | 23.37 | 406,255 | 518,923 | 19.67 | 165,162 | 226,386 |
| ADE-TFT(HTV + NCC + GT) | 7.37 | 200,840 | 251,070 | 6.74 | 109,857 | 140,365 | 7.41 | 62,004 | 85,258 |
| ADE-TFT (HTV + NCC + TF) | 8.96 | 238,611 | 279,796 | 5.58 | 94,792 | 132,050 | 10.18 | 72,382 | 100,905 |
| ADE-TFT (HTV + GT + TF) | 9.10 | 256,681 | 367,944 | 10.04 | 181,632 | 251,627 | 9.69 | 74,418 | 104,637 |
| ADE-TFT (NCC + GT + TF) | 11.09 | 298,016 | 375,972 | 4.79 | 76,314 | 98,180 | 5.14 | 42,004 | 55,944 |
| ADE-TFT (HTV + NCC + GT + TF) | 3.10 | 76,826 | 89,724 | 4.76 | 83,398 | 135,584 | 3.02 | 24,442 | 32,532 |
HTV means historical tourism volume. NCC means newly confirmed cases. GT denotes Google Trends. TF denotes travel forum data, which includes the number of posts and CNN text features
Fig. 11.
Interpretable results of the Paris dataset
Fig. 12.
Interpretable results of the Amsterdam dataset
Fig. 13.
Interpretable results of the Lisbon dataset
Managerial implications
From February 2020 to April 2020, several major airports worldwide were affected by the COVID-19 pandemic and travel bans in most countries. For example, international airport arrivals in Paris, Amsterdam, and Lisbon represent a total reduction of 97.86%, 96.98%, and 98.78%, respectively. With the reopening policy released in the middle of 2020, the tourism volume in Europe slightly recovered. Since then, forecasting tourism demand has become challenging. The main findings of this study are described as follows:
Multi-source data can help estimate tourism demand during COVID-19. In particular, Google Trends and the quantity of postings might indicate how popular a destination is for tourists, and travel forums’ content often includes evaluations of the relevant restrictions or reopening rules as well as discussions of tourist interests at various times. In the meanwhile, the recently verified cases can provide insight into the epidemic situation in popular tourist areas, which is particularly useful for predicting visitation in the post-epidemic future.
Managers in the tourism business will benefit from the interpretable result of the tourism volume prediction. Stakeholders can have a deeper knowledge of the connections between Google Trends, travel forum posts, and tourism volume volumes. The subjects and attitudes of visitors toward popular tourist sites are reflected in travel forum data, which can be utilized to determine whether or not tourists have future trip plans. The number of searches for a particular destination is shown by Google Trends. Hot subjects in travel forums can be used to filter Google Trends, which is a helpful supplement to data from travel forums.
Indexes based on big data can provide rich information about tourists’ interests and preferences to accurately predict the demand for tourist attractions and destinations. Besides, based on high-frequency prediction, tourism practitioners can forecast the amount of tourism demand recovery during the COVID-19 pandemic. In addition, they can further develop revenue management objectives by appropriate staff scheduling and applying dynamic pricing strategies. Moreover, authorities can use tourism volume forecasts to support crowd management and better guard against COVID-19.
Conclusion and future research
Due to the COVID-19 pandemic, tourism demand in well-known tourist cities exhibits violently fluctuating trends, making it difficult to predict with accuracy. This research forecasts tourist demand by combining historical travel volume, monthly new confirmed cases of travel destinations, Google Trends, and travel forum data from TripAdvisor. Google Trends and travel forum data complement one another; Google Trends shows the popularity of tourist destinations, while travel forum data reveals the many themes that travelers are interested in at various times. As a result, this approach to projecting tourism volume may produce adequate results. LDA, deep learning techniques and an interpretable forecasting model are combined to propose a comprehensive framework for anticipating tourism demand. In particular, Google Trends are chosen for each topic after LDA analyzes the topics in the travel forum text. From the travel forum posts, CNN is used to automatically extract text features. In the meantime, the revolutionary deep model ADE-TFT is suggested to forecast the volume of tourism.
The study makes a variety of contributions. To start, this study suggests a brand-new interpretable forecasting model, called ADE-TFT, that can better estimate tourism demand and explain the function of input variables. The TFT model’s performance is enhanced by using the ADE algorithm to optimize the parameter combination. Decision-makers involved in the tourism industry can benefit from interpretable analysis of forecasted tourist demand since it can help them create more reliable predictions and plans. Second, this study provides a novel approach to choose keywords from search engine data and introduces two new predictive elements, namely text qualities of travel forum content and the number of posts. This study represents the first attempt to choose Google Trends based on the generated themes using the LDA model. These results contribute to a broader understanding of the theoretical underpinnings of method prediction, which may make it easier to predict the fluctuating demand for travel during the COVID-19 pandemic using data from Google Trends and travel forums.
However, there are gaps in this study that demand more research. In the first place, using complete posts and complete answers to postings rather than just post titles could have more management consequences. Second, the number of languages and sources can increase the size of the travel forum material (e.g., Twitter, blogs, and news) [65]. Third, choosing keywords is entirely manual. Fourth, the study’s time frame was broad, spanning from January 2012 through March 2022. To make it simpler for textual categorization algorithms to understand what passengers have been interested in since the COVID-19 outbreak, periods can be cut down and daily or weekly data can be used. For the purpose of reaching a more significant and applicable conclusion, additional research is required.
Acknowledgements
The authors are very grateful for the constructive comments of editors and referees. This research is partially supported by the Humanities and Social Sciences Foundation of the Chinese Ministry of Education, China (No.22YJA630003).
Biographies
Binrong Wu
is a Ph.D. candidate in the School of Management, Huazhong University of Science and Technology, Wuhan, China. His research interests are in the areas of business analytics, text mining, and time-series forecasting. He has published several papers in international journals such as Energy, Measurement, and Neural Processing Letters. 
Lin Wang
is a Professor in the School of Management, Huazhong University of Science and Technology, Wuhan, China. His research interests are in the area of business analytics, and time series prediction. He has published over 50 papers in international journals such as Knowledge-Based Systems, Engineering Applications of Artificial Intelligence, Information Sciences, Tourism Management, Applied Energy, Energy, and European Journal of Operational Research. 
Yu-Rong Zeng
is an Associate Professor in Hubei University ofEconomics, Wuhan, China. Her research interests are in the area of neural computing, text mining, and applied intelligence.
She has published more than 20 papers in international journals such as Energy, Applied Soft Computing, and Knowledge Based Systems. 
Data availability
The datasets generated during and/or analyzed during the current study are available from the corresponding author upon reasonable request.
Declarations
Competing interest
None.
Footnotes
Publisher’s note
Springer Nature remains neutral with regard to jurisdictional claims in published maps and institutional affiliations.
Contributor Information
Binrong Wu, Email: binronghust@foxmail.com.
Lin Wang, Email: wanglin982@gmail.com.
Yu-Rong Zeng, Email: zyrhbue@gmail.com, Email: zyr@hbue.edu.cn.
References
- 1.Zhang H, Song H, Wen L, Liu C. Forecasting tourism recovery amid COVID-19. Ann Tour Res. 2021;87:103149. doi: 10.1016/j.annals.2021.103149. [DOI] [PMC free article] [PubMed] [Google Scholar]
- 2.Hu F, Teichert T, Deng S, et al. Dealing with pandemics: An investigation of the effects of COVID-19 on customers’ evaluations of hospitality services. Tour Manag. 2021;85:104320. doi: 10.1016/j.tourman.2021.104320. [DOI] [PMC free article] [PubMed] [Google Scholar]
- 3.Coronavirus disease (COVID-19). https://www.who.int/emergencies/diseases/novel-coronavirus-2019. Accessed 24 Jul 2022
- 4.Mahanty C, Kumar R, Mishra BK, et al. Prediction of COVID-19 active cases using exponential and non-linear growth models. Expert Syst. 2022;39:e12648. doi: 10.1111/exsy.12648. [DOI] [Google Scholar]
- 5.Chauhan E, Sirswal M, Gupta D, et al. Analysis of COVID-19 pandemic and forecasting using machine learning models. Int J Comput Appl Technol. 2021;66:309–333. doi: 10.1504/IJCAT.2021.120456. [DOI] [Google Scholar]
- 6.Mansour RF, Escorcia-Gutierrez J, Gamarra M et al (2021) Unsupervised deep learning based variational autoencoder model for COVID-19 Diagnosis and Classification. Pattern Recognit Lett 151:267–274. 10.1016/j.patrec.2021.08.018 [DOI] [PMC free article] [PubMed]
- 7.Castillo O, Melin P. Forecasting of COVID-19 time series for countries in the world based on a hybrid approach combining the fractal dimension and fuzzy logic. Chaos Solitons Fractals. 2020;140:110242. doi: 10.1016/j.chaos.2020.110242. [DOI] [PMC free article] [PubMed] [Google Scholar]
- 8.UNWTO Briefing Note – Tourism and COVID-19, Issue 1. How are countries supporting tourism recovery? | World Tourism Organization. https://www.e-unwto.org/doi/book/10.18111/9789284421893. Accessed 24 Jul 2022
- 9.Wickramasinghe K, Ratnasiri S. The role of disaggregated search data in improving tourism forecasts: Evidence from Sri Lanka. Curr Issues Tourism. 2021;24:2740–2754. doi: 10.1080/13683500.2020.1849049. [DOI] [Google Scholar]
- 10.Li H, Hu M, Li G. Forecasting tourism demand with multisource big data. Ann Tour Res. 2020;83:102912. doi: 10.1016/j.annals.2020.102912. [DOI] [Google Scholar]
- 11.Guizzardi A, Pons FME, Angelini G, Ranieri E (2021) Big data from dynamic pricing: a smart approach to tourism demand forecasting. Int J Forecast 37:1049–1060. 10.1016/j.ijforecast.2020.11.006
- 12.Bangwayo-Skeete PF, Skeete RW. Can Google data improve the forecasting performance of tourist arrivals? Mixed-data sampling approach. Tour Manag. 2015;46:454–464. doi: 10.1016/j.tourman.2014.07.014. [DOI] [PMC free article] [PubMed] [Google Scholar]
- 13.Pan B, Yang Y (2017) Forecasting destination weekly hotel occupancy with big data. J Travel Res 56:957–970. 10.1177/0047287516669050
- 14.Chen Y, Chen R, Hou J, et al. Research on users’ participation mechanisms in virtual tourism communities by Bayesian network. Knowl Based Syst. 2021;226:107161. doi: 10.1016/j.knosys.2021.107161. [DOI] [Google Scholar]
- 15.De Caigny A, Coussement K, De Bock KW, Lessmann S. Incorporating textual information in customer churn prediction models based on a convolutional neural network. Int J Forecast. 2020;36:1563–1578. doi: 10.1016/j.ijforecast.2019.03.029. [DOI] [Google Scholar]
- 16.Wu J, Hong Q, Cao M, et al. A group consensus-based travel destination evaluation method with online reviews. Appl Intell. 2022;52:1306–1324. doi: 10.1007/s10489-021-02410-6. [DOI] [Google Scholar]
- 17.Eslami SP, Ghasemaghaei M, Hassanein K. Which online reviews do consumers find most helpful? A multi-method investigation. Decis Support Syst. 2018;113:32–42. doi: 10.1016/j.dss.2018.06.012. [DOI] [Google Scholar]
- 18.Farhadloo M, Patterson RA, Rolland E. Modeling customer satisfaction from unstructured data using a Bayesian approach. Decis Support Syst. 2016;90:1–11. doi: 10.1016/j.dss.2016.06.010. [DOI] [Google Scholar]
- 19.Gandomi A, Haider M. Beyond the hype: Big data concepts, methods, and analytics. Int J Inf Manag. 2015;35:137–144. doi: 10.1016/j.ijinfomgt.2014.10.007. [DOI] [Google Scholar]
- 20.Kaya K, Yılmaz Y, Yaslan Y, et al. Demand forecasting model using hotel clustering findings for hospitality industry. Inf Process Manag. 2022;59:102816. doi: 10.1016/j.ipm.2021.102816. [DOI] [Google Scholar]
- 21.Song M, Shin K. Forecasting economic indicators using a consumer sentiment index: Survey-based versus text‐based data. J Forecast. 2019;38:504–518. doi: 10.1002/for.2584. [DOI] [Google Scholar]
- 22.Li X, Law R, Xie G, Wang S. Review of tourism forecasting research with internet data. Tour Manag. 2021;83:104245. doi: 10.1016/j.tourman.2020.104245. [DOI] [Google Scholar]
- 23.Tsang WK, Benoit DF. Gaussian processes for daily demand prediction in tourism planning. J Forecast. 2020;39:551–568. doi: 10.1002/for.2644. [DOI] [Google Scholar]
- 24.Makridakis S, Spiliotis E, Assimakopoulos V. The M4 Competition: 100,000 time series and 61 forecasting methods. Int J Forecast. 2020;36:54–74. doi: 10.1016/j.ijforecast.2019.04.014. [DOI] [Google Scholar]
- 25.Song H, Qiu RTR, Park J (2019) A review of research on tourism demand forecasting: launching the annals of tourism research curated collection on tourism demand forecasting. Ann Tour Res 75:338–362. 10.1016/j.annals.2018.12.001
- 26.Assaf AG, Li G, Song H, Tsionas MG (2019) Modeling and forecasting regional tourism demand using the Bayesian Global Vector Autoregressive (BGVAR) Model. J Travel Res 58:383–397. 10.1177/0047287518759226
- 27.Bi J-W, Liu Y, Li H. Daily tourism volume forecasting for tourist attractions. Ann Tour Res. 2020;83:102923. doi: 10.1016/j.annals.2020.102923. [DOI] [Google Scholar]
- 28.Li X, Pan B, Law R, Huang X. Forecasting tourism demand with composite search index. Tour Manag. 2017;59:57–66. doi: 10.1016/j.tourman.2016.07.005. [DOI] [Google Scholar]
- 29.Lijuan W, Guohua C. Seasonal SVR with FOA algorithm for single-step and multi-step ahead forecasting in monthly inbound tourist flow. Knowl Based Syst. 2016;110:157–166. doi: 10.1016/j.knosys.2016.07.023. [DOI] [Google Scholar]
- 30.Nicholas A. Forecasting US overseas travelling with univariate and multivariate models. J Forecast. 2021;40:963–976. doi: 10.1002/for.2760. [DOI] [Google Scholar]
- 31.Lim C, McAleer M. Time series forecasts of international travel demand for Australia. Tour Manag. 2002;23:389–396. doi: 10.1016/S0261-5177(01)00098-X. [DOI] [Google Scholar]
- 32.Jiao EX, Chen JL (2019) Tourism forecasting: a review of methodological developments over the last decade. Tour Econ 25:469–492. 10.1177/1354816618812588
- 33.Law R, Li G, Fong DKC, Han X. Tourism demand forecasting: a deep learning approach. Ann Tour Res. 2019;75:410–423. doi: 10.1016/j.annals.2019.01.014. [DOI] [Google Scholar]
- 34.Chen R, Liang C-Y, Hong W-C, Gu D-X. Forecasting holiday daily tourist flow based on seasonal support vector regression with adaptive genetic algorithm. Appl Soft Comput. 2015;26:435–443. doi: 10.1016/j.asoc.2014.10.022. [DOI] [Google Scholar]
- 35.Bi J-W, Li H, Fan Z-P. Tourism demand forecasting with time series imaging: a deep learning model. Ann Tour Res. 2021;90:103255. doi: 10.1016/j.annals.2021.103255. [DOI] [Google Scholar]
- 36.Sterkenburg TF, Grünwald PD. The no-free-lunch theorems of supervised learning. Synthese. 2021;199:9979–10015. doi: 10.1007/s11229-021-03233-1. [DOI] [Google Scholar]
- 37.Hu M, Song H. Data source combination for tourism demand forecasting. Tour Econ. 2020;26:1248–1265. doi: 10.1177/1354816619872592. [DOI] [Google Scholar]
- 38.Xiao K, Qian Z, Qin B. A graphical decomposition and similarity measurement approach for topic detection from online news. Inf Sci. 2021;570:262–277. doi: 10.1016/j.ins.2021.04.029. [DOI] [Google Scholar]
- 39.Siering M, Deokar AV, Janze C. Disentangling consumer recommendations: Explaining and predicting airline recommendations based on online reviews. Decis Support Syst. 2018;107:52–63. doi: 10.1016/j.dss.2018.01.002. [DOI] [Google Scholar]
- 40.Fronzetti Colladon A, Guardabascio B, Innarella R. Using social network and semantic analysis to analyze online travel forums and forecast tourism demand. Decis Support Syst. 2019;123:113075. doi: 10.1016/j.dss.2019.113075. [DOI] [Google Scholar]
- 41.Casanueva C, Gallego Á, García-Sánchez M-R. Social network analysis in tourism. Curr Issues Tourism. 2016;19:1190–1209. doi: 10.1080/13683500.2014.990422. [DOI] [Google Scholar]
- 42.Dergiades T, Mavragani E, Pan B. Google Trends and tourists’ arrivals: Emerging biases and proposed corrections. Tour Manag. 2018;66:108–120. doi: 10.1016/j.tourman.2017.10.014. [DOI] [Google Scholar]
- 43.Rivera R. A dynamic linear model to forecast hotel registrations in Puerto Rico using Google Trends data. Tour Manag. 2016;57:12–20. doi: 10.1016/j.tourman.2016.04.008. [DOI] [Google Scholar]
- 44.Gunter U, Önder I. Forecasting city arrivals with Google Analytics. Ann Tour Res. 2016;61:199–212. doi: 10.1016/j.annals.2016.10.007. [DOI] [Google Scholar]
- 45.Li X, Law R (2020) Forecasting tourism demand with decomposed search cycles. J Travel Res 59:52–68. 10.1177/0047287518824158
- 46.Li S, Chen T, Wang L, Ming C. Effective tourist volume forecasting supported by PCA and improved BPNN using Baidu index. Tour Manag. 2018;68:116–126. doi: 10.1016/j.tourman.2018.03.006. [DOI] [Google Scholar]
- 47.Yang X, Pan B, Evans JA, Lv B. Forecasting Chinese tourist volume with search engine data. Tour Manag. 2015;46:386–397. doi: 10.1016/j.tourman.2014.07.019. [DOI] [Google Scholar]
- 48.Massachusetts Institute of Technology. Brynjolfsson E, Geva T, et al. Crowd-Squared: Amplifying the Predictive Power of Search Trend Data. MISQ. 2016;40:941–961. doi: 10.25300/MISQ/2016/40.4.07. [DOI] [Google Scholar]
- 49.Li X, Shang W, Wang S, Ma J. A MIDAS modelling framework for Chinese inflation index forecast incorporating Google search data. Electron Commer Res Appl. 2015;14:112–125. doi: 10.1016/j.elerap.2015.01.001. [DOI] [Google Scholar]
- 50.Vosen S, Schmidt T. Forecasting private consumption: survey-based indicators vs. Google trends. J Forecast. 2011;30:565–578. doi: 10.1002/for.1213. [DOI] [Google Scholar]
- 51.Wu B, Wang L, Lv S-X, Zeng Y-R. Effective crude oil price forecasting using new text-based and big-data-driven model. Measurement. 2021;168:108468. doi: 10.1016/j.measurement.2020.108468. [DOI] [Google Scholar]
- 52.Huang M, Xie H, Rao Y, et al. Sentiment strength detection with a context-dependent lexicon-based convolutional neural network. Inf Sci. 2020;520:389–399. doi: 10.1016/j.ins.2020.02.026. [DOI] [Google Scholar]
- 53.Agarwal B, Ramampiaro H, Langseth H, Ruocco M. A deep network model for paraphrase detection in short text messages. Inf Process Manag. 2018;54:922–937. doi: 10.1016/j.ipm.2018.06.005. [DOI] [Google Scholar]
- 54.Lim B, Arık S, Loeff N, Pfister T. Temporal Fusion Transformers for interpretable multi-horizon time series forecasting. Int J Forecast. 2021;37:1748–1764. doi: 10.1016/j.ijforecast.2021.03.012. [DOI] [Google Scholar]
- 55.Cai Y, Wu D, Fu S, Zeng S. Self-regulated differential evolution for real parameter optimization. Appl Intell. 2021;51:5873–5897. doi: 10.1007/s10489-020-01973-0. [DOI] [Google Scholar]
- 56.Li Y, Wang S, Liu H, et al. A backtracking differential evolution with multi-mutation strategies autonomy and collaboration. Appl Intell. 2022;52:3418–3444. doi: 10.1007/s10489-021-02577-y. [DOI] [Google Scholar]
- 57.Akın M. A novel approach to model selection in tourism demand modeling. Tour Manag. 2015;48:64–72. doi: 10.1016/j.tourman.2014.11.004. [DOI] [Google Scholar]
- 58.Bi J-W, Liu Y, Fan Z-P, Zhang J. Wisdom of crowds: Conducting importance-performance analysis (IPA) through online reviews. Tour Manag. 2019;70:460–478. doi: 10.1016/j.tourman.2018.09.010. [DOI] [Google Scholar]
- 59.Tsui WHK, Balli F. International arrivals forecasting for Australian airports and the impact of tourism marketing expenditure. Tour Econ. 2017;23:403–428. doi: 10.5367/te.2015.0507. [DOI] [Google Scholar]
- 60.Kulshrestha A, Krishnaswamy V, Sharma M. Bayesian BILSTM approach for tourism demand forecasting. Ann Tour Res. 2020;83:102925. doi: 10.1016/j.annals.2020.102925. [DOI] [Google Scholar]
- 61.Niu H, Xu K, Wang W. A hybrid stock price index forecasting model based on variational mode decomposition and LSTM network. Appl Intell. 2020;50:4296–4309. doi: 10.1007/s10489-020-01814-0. [DOI] [PubMed] [Google Scholar]
- 62.Windsor E, Cao W. Improving exchange rate forecasting via a new deep multimodal fusion model. Appl Intell. 2022 doi: 10.1007/s10489-022-03342-5. [DOI] [PMC free article] [PubMed] [Google Scholar]
- 63.Wu B, Wang L, Zeng Y-R (2022) Interpretable wind speed prediction with multivariate time series and temporal fusion transformers. Energy 252:123990. 10.1016/j.energy.2022.123990
- 64.Wang L, Wang S, Yuan Z, Peng L (2021) Analyzing potential tourist behavior using PCA and modified affinity propagation clustering based on Baidu index: taking Beijing city as an example. Data Science and Management 2:12–19. 10.1016/j.dsm.2021.05.001
- 65.Wu B, Wang L, Wang S, Zeng Y-R (2021) Forecasting the US oil markets based on social media information during the COVID-19 pandemic. Energy 226:120403. 10.1016/j.energy.2021.120403 [DOI] [PMC free article] [PubMed]
Associated Data
This section collects any data citations, data availability statements, or supplementary materials included in this article.
Data Availability Statement
The datasets generated during and/or analyzed during the current study are available from the corresponding author upon reasonable request.


