

Abstract
Compared to C corporation banks, S corporation banks and credit unions are considered tax-exempt institutions, with credit unions receiving the greatest tax benefit. Institutions can choose to pass this benefit onto customers in the form of higher deposit rates and lower loan rates. We test this hypothesis by analyzing a dataset of 11 distinct deposit and loan products over 15 years and compare interest rates offered by depository institutions partitioned into three size groups. Overall, our results indicate credit unions offer higher deposit and lower loan rates compared to commercial banks, particularly for timed deposits (CDs), money market accounts, auto loans, and fixed unsecured loans. In contrast, S banks and C banks offer similar interest rates on most deposit and loan products. These findings generally hold across all size groups and differences become more pronounced when comparing larger credit unions to commercial banks. Notably, credit unions in the large size group offer better interest rates to customers for all products analyzed.
Keywords: Deposit rates, Loan rates, Interest rates, Depository institutions, Commercial banks, Credit unions, S banks, Competition, Tax exemption
Introduction
Over the last two decades, the banking industry has concentrated into three distinct types of depository institutions that now comprise the majority share in the US. These are C corporation banks (C banks), S corporation banks (S banks), and credit unions. These institutions all compete for deposits from savers by offering a variety of financial products. Deposit funds collected are then transformed by financial institutions into new products with different risk and return categories. These products primarily take the form of loans for depository institutions and are the main source of income. In competing with other institutions for both savers and borrowers, commercial banks and credit unions offer a mix of price and service that is attractive to potential customers. The price advertised by depository institutions is the interest rate and fee on deposit and loan products while additional benefits like branch location, online and mobile accessibility, customer service, and so on represent added services. In this paper, we focus on the competition in interest rates for deposit and loan products by C banks, S banks, and credit unions.
We use data from S&P Global for the period 2007 to 2021 to compare the interest rates offered on 11 distinct deposit and loan products. Overall, our results show that credit unions offer better or similar interest rates to customers compared to both C banks and S banks for all deposit and loan products analyzed. Additionally, as the size of institutions increase, the differences in deposit and loan rates between credit unions and commercial banks increase, with credit unions offering more competitive rates. Our findings also reveal significant business model differences between credit unions and commercial banks. In many instances, credit unions offer higher deposit rates while simultaneously charging lower loan rates compared to commercial banks in the same regional market. For commercial bank competition, we find that S banks offer similar interest rates to C banks in most cases. Only in auto loans do we find notable differences between S and C banks with medium-sized S banks charging higher interest rates while large S banks charge lower rates compared to similarly sized C banks.
We employ a variety of analyses to test the robustness of our results and find them consistent across all tests. We restrict our samples to state-quarter groups that have at least five institutions of each type to address the selection bias. We use the Mahalanobis distance (McLachlan 1999) to match institutions and ensure they are comparable with respect to assets, the deposit ratio, time, and location. We repeat the matching analysis on different sub-samples partitioned by different asset size groups and time periods. In all analyses, we find qualitatively similar results supporting the competitiveness of credit unions compared to C banks and S banks. We also find that tax-exempt depository institutions pass savings onto customers as they increase in size, with this benefit being more pronounced in credit unions.
The rest of the paper is organized as follows: Section 2 provides background information for depository institutions, Section 3 discusses the literature related to interest rate competition, Section 4 overviews the interest rate data, Section 5 discusses the methods and results, Section 6 concludes.
Background
The three types of financial institutions compared in this study include C banks, S banks, and credit unions. While all three are depository institutions, whereby deposits form the majority share of liabilities, they differ from each other in significant ways. C banks are corporations owned by shareholders and pay taxes at the corporate level and at the shareholder level. This institution type is considered the default, as most large and notable corporations in the US are structured in similar ways. The second institution type, S banks, are similarly corporations owned by shareholders but differ to C banks in two significant ways. First, they are not taxed at the corporate level and instead pay taxes on pass-through earnings at the shareholder income tax rate. This tax benefit is considered the primary reason C banks switch to S banks. The second major difference for S banks is the shareholder limit of 100. These 100 shareholders may be individuals, trusts, estates, or certain tax-exempt organizations. Partnerships, corporations, and nonresident aliens are not eligible as shareholders of S banks. This limit places significant restrictions on the potential size and growth from outside investors. Therefore, S banks are, on average, smaller institutions compared to C banks. The third institution type, credit unions, differ the most from both C banks and S banks as they are considered not-for-profit institutions and are therefore exempt from federal and most state taxes. Credit unions do not issue common stock and instead are legally owned by member depositors. Members have a single vote regardless of their deposit size and direct credit union management. While membership requirements in the past were strict to those sharing a common bond, today credit unions are accessible to most due to deregulation in the 1990s. Credit unions now provide multiple options in broadly stated common bonds to potential members. These changes have led credit unions to compete more directly with commercial banks for deposits and loans.1
While C banks have high visibility in the US due to their size and scope, credit unions are the most numerous depository institution by a wide margin. In 2007q1, the start of our sample period, there were 8,481 credit unions in the US. By 2021q4, this quantity is reduced to 5,046 credit unions. In contrast, there were 6,243 C banks in 2007q1 while by 2021q4 this declines to 3,422 C banks. Finally, S banks place last in quantity with 2,475 S banks in 2007q1 and 1,628 S banks by 2021q4. Figure 1 highlights this trend for all three bank types.
Fig. 1.

The total number of banks by depository institution type is shown for our sample period, 2007q1-2021q4
Business model differences
A business model is a plan for profitably operating a business using goods or services in a way that differentiates the business from its competitors. Under this definition, credit unions differ greatly to commercial banks while C banks and S banks differ with each other in less ways. Here we provide a simplified business model comparison between credit unions and commercial banks to motivate potential explanations in later results. Both C banks and S banks are for-profit institutions with the inherent goal of maximizing shareholder wealth. Therefore, a commercial bank’s interest rate spread, , which is the primary source of income, should be maximized, all else equal.2 In many instances this can lead to beneficial interest rates for customers when competition is high as commercial banks strive to attract both savers and borrowers. On the other hand, in regions where competition is sparse, commercial banks may offer lower deposit rates and higher loan rates since consumer choice is limited. In contrast, credit unions are not-for-profit institutions with managers being directed by member depositors. Additionally, credit union funds largely flow between members as deposits are turned into loans. Therefore, credit unions are incentivized to minimize the interest rate spread, , by members who hold deposit and loan accounts. Depositors want high returns on their savings while simultaneously demanding low rates on their loans. Competition from nearby institutions will similarly impact credit unions but possibly to a lesser extent. Whether competition is high or minimal, credit union members will always emphasize their own welfare. Therefore, interest rates may shift according to economic factors, but the spread between deposit and loan rates should always be minimized. These opposing goals by credit unions and commercial banks leads to our first hypothesis that credit unions will offer the most competitive interest rates.
Taxation differences
In terms of favorable tax treatment, credit unions rank higher compared to C banks and S banks. Prior to the Tax Cuts and Jobs Act of 2017 (TCJA), S banks had a preferred tax treatment to C banks since the overall tax liability to owners was typically less. Afterwards, the new corporate tax rate of 21% for C banks narrowed the gap. Overall, a reduction in tax liability for depository institutions means savings could be passed onto customers in the form of higher deposit rates or lower loan rates. Therefore, given tax benefits are passed onto customers, we hypothesize that credit unions should offer the best rates, followed by S banks, and then C banks.
Literature review
In this paper, we examine whether the differing business models and tax treatment for credit unions, S banks, and C banks are related to the interest rates offered on both deposit and loan products. One of the first papers to utilize similar data for interest rate comparisons is Depken et al. (2010). Using interest rate data for the second quarter of 2008, they examine whether subchapter S banks share their tax benefits with customers in the form of lower loan rates or higher deposit rates compared to rival C banks. They find that the deposit (loan) rates of S banks are equal to, or lower (higher) than, the rates of similar C bank. They conclude there is no empirical evidence that tax benefits are passed on to the customers of subchapter S banks. Additionally, for the second quarter of 2008, they note that credit unions charged lower rates than commercial banks for all products except mortgage loans and paid higher deposit rates compared to commercial banks.
Chang et al. (2016) use data for the period 1994 to 2012 to investigate which stakeholders receive the benefits from the conversion of C banks to subchapter S. They use a difference-in-differences approach to compare the various characteristics of the two types of banks. They find that the tax benefits from the subchapter S status are not used in expenses related to the protection of jobs, do not benefit the employees in the form of increased salaries and benefits, and do not lead to greater employment opportunities within the subchapter S banks. Their results show that bank owners are the sole beneficiaries of the tax exemption benefits.
Donohoe et al. (2019) use data on 4,462 private US commercial banks grouped by Metropolitan Statistical Area during 1997–2010 to study whether, and to what extent competition from S banks influences the future organizational choice of rival C corporations and examine the outcomes of this choice. They find that the higher level of competition from S banks increases the likelihood that rival C banks will convert to subchapter S. They estimate that the aggregate first-year tax savings from converting to subchapter S exceeded $372 million. Contrary to the findings of Depken et al. (2010), they find that converting banks increase their interest rates on customer deposits and heighten the intensity of advertising.
Our paper is most related to Depken et al. (2010) and Chang et al. (2016). However, we differ from these studies in several ways. First, while the prior literature focuses more on the comparison between C banks and S banks, our analysis emphasizes the comparison between credit unions and commercial banks. Second, we use a longer and more recent sample period from 2007q1 to 2021q4. The expanded window allows us to examine the variation in specific bank product rates, especially when the Federal Reserve aggressively intervened in the interest rate environment through their quantitative easing policies. Third, our analysis partitions depository institutions into distinct size groups to highlight differences in small, medium, and large institutions. Lastly, we provide renewed findings on whether depository institutions pass the tax savings onto customers through higher deposit rates and lower loan rates. The literature provides mixed results on this question.
In contrast to commercial bank comparisons, articles researching how credit unions fair against C banks and S banks in interest rate competition are limited. Many articles on credit unions emphasize their significant tax benefit compared to commercial banks and argue that it is an unfair advantage today. Other articles highlight the benefits to communities by arguing that the tax savings are passed onto member savers and borrowers. Our analysis contributes to this existing literature by providing insight into whether the tax treatment of credit unions is related to beneficial interest rates for savers and borrowers compared to commercial banks.
Some notable articles for and against the tax treatment of credit unions include the following. Laval (1990) notes that the credit union industry tripled during the 1980s to over $200 billion. The American Bankers Association in 1990 released a report calling for taxation and stricter capital standards for credit unions. The crux of the ABA criticism is that the credit union industry has wandered far from the purpose for which Congress authorized it to organize. As a result, credit unions enjoy unfair competitive advantages and undeserved income tax exemption.
Demangone (2010) discusses the tax exemption status for credit unions and states “When it comes to taxes on institution income, credit unions do indeed have a 100 percent, crystal-clear, undeniable advantage over their banking brethren.” However, they argue that credit unions have limited powers compared to commercial banks. Every commercial bank in the US can accept any credit union member as a customer. The reverse is not true. Additionally, credit unions have limits on lending, member business lending, interest rates, prepayment penalties, expelling members, the products and services they can offer, the ability to make charitable donations, and more. They claim that we cannot look at the tax exemption without also considering the limitations on powers and the corporate governance model.
Anderson and Liu (2013) state, “Congress has been clear regarding the social purpose of the credit union exemption: Credit unions are exempt from federal taxes because they are member-owned, democratically-operated, not-for-profit organizations generally managed by volunteer boards of directors and because they have the specified mission of meeting the credit and savings needs of consumers, especially persons of modest means." Also, “today most credit unions offer a full range of financial products and services and some have suggested that larger credit unions are effectively the equivalent to banks.” They conclude that the combined effects of the exemption from federal income taxes plus the multigroup expansion possibilities may have tilted the competitive balance away from commercial banks and towards credit unions.
Berger (2013) defends credit unions against recent attacks from the banking industry. They highlight recent studies indicating that bank business lending was largely unaffected by changes in credit unions’ business lending. Additionally, credit union business lending can help offset declines in bank business lending during recessions. During 2007–2010, bank business lending declined while credit union lending increased. They state, “Clearly, credit unions continued to serve Main Street as banks turned people away.” Berger (2013) references another study in 2012 by the National Association of Federal Credit Unions that claims all Americans would lose if credit unions lost the tax exemption status. There would be 150,000 lost jobs per year, higher loan rates, lower deposit rates, and a net loss of $15 billion over the following decade in federal income tax revenue. Berger (2013) claims, “Credit unions exist to serve their members. Whatever ‘earnings’ are made at a credit union go right back to its members in the form of higher dividends and lower rates and fees.”
Many additional articles argue both sides. Berger (2013) and a publication by the Credit Union National Association (2019) discuss the significant benefits stemming from credit unions including jobs, higher deposit rates, lower loan rates, and federal income tax revenue. In contrast, Hannley (2017), Reosti (2018), Hunt (2019), York (2019), and White (2020) all make similar claims regarding the size and profitability of credit unions and how they no longer serve their original intended purpose. They claim credit unions today operate very similarly to commercial banks and should be taxed. Our comparison of credit unions and commercial banks may provide insight into whether some of these claims are observed in interest rate offerings.
Data
Interest rates on specific deposit and loan products are acquired from S&P Global for the period 2007q1-2021q4. Of the available data, we select 11 products based on the number of observations available and their importance. For all products, the interest rates reported by banks measure the average prime rate across all their branches in the US.3 Quarterly financial statements for commercial banks and credit unions are acquired from the same database. Interest rates on deposit and loan products are collected more frequently than financial statement data with deposit products being updated every week on Friday and loan products updated every Month on the last Friday. To match our datasets, interest rates are collected on the last Friday of each quarter.
While financial statement data is complete for depository institutions, interest rate data is incomplete since it is not a legal requirement. The number of observations for interest rate data increases over time as collection methods improve. As an example, Fig. 2 shows the ratio of interest rate observations to active bank observations for 1-Year CDs by bank type. Overall, C bank and S bank data is more representative of active banks compared to credit unions, particularly in later years. The decline observed in the year 2020 is due to the Covid-19 pandemic. Also, the size of an institution influences the data availability. Figure 3 shows the same ratio for credit unions by size group where small, medium, and large indicates total assets below $100 million, between $100 million and $1 billion, and above $1 billion, respectively. For medium and large credit unions, interest rate data is available for the majority of credit unions in the early years of our sample and increases to over 90% representation in later periods. Only in small institutions is data collection limited. The same pattern applies to commercial banks, with larger institutions providing more representative data. Concerns about selection bias in earlier years is addressed by performing subsample tests using later time periods. Overall, the primary findings of the paper do not change and are robust to different time periods.
Fig. 2.

Ratio of interest rate observations to active depository institutions for 1-Year CDs
Fig. 3.
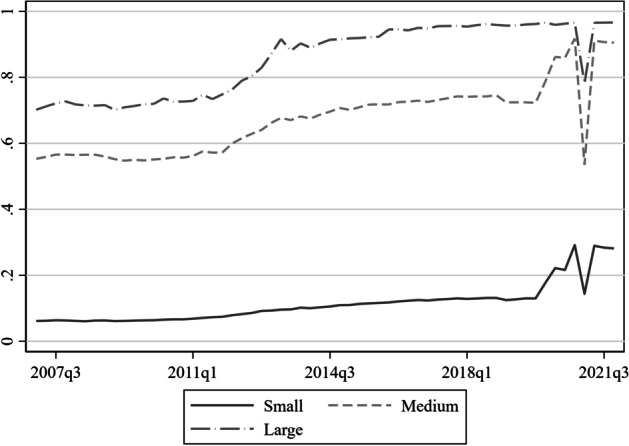
Ratio of credit union interest rate observations to active credit unions for 1-Year CDs by size group
Variables
We choose 11 bank products to compare interest rates among our three financial institutions based on the quantity of observations available over the sample period and their importance. For deposit products we collect interest rate data on certificates of deposit (CD) with maturities of one, three, and five years. All CD rates are based on a lump sum of $10,000. Different types of savings accounts collected include regular savings, interest checking, and money market accounts. These product rates are based on lump sums of $2,500.
For loan products we obtain data on auto loans, personal loans, and mortgages. Auto loan product rates are collected for two maturities: 48-months and 60-months. The interest rates are based on a loan size of $25,000 for new cars and a loan-to-value ratio of 100%. Personal loan interest rates are based off a 36-month fixed unsecured loan with a notional value of $5,000. This interest rate is based off excellent credit score ratings. Mortgage interest rates collected are for 15-year fixed and 30-year fixed. These are based on a loan of $250,000, excellent credit scores, and a loan-to-value ratio of 80%.
Summary statistics for each deposit and loan product are shown in Table 1. The average, median, and standard deviation of interest rates is reported for each bank type using the entire sample period, 2007q1-2021q4. For a comparison of average interest rates by bank type, Fig. 4 show a representative set of deposit and loan products. Economic events throughout this period led to significant changes in interest rates, so these summary statistics do not provide accurate comparisons between institutions. Nonetheless, the results provide a baseline for later comparisons. The total sample size for each deposit and loan product is shown in the last columns by bank type. For later tests, we emphasize results that come from products with larger sample sizes since they are more reliable and representative of the active banks.
Table 1.
The mean, median, standard deviation, and sample size for each product is shown by depository institution type. Results are computed using the sample period 2007q1-2021q4. Sample size varies by product variable due to limited data availability
| Credit Unions | C Banks | S Banks | Sample Size | |||||||||
| Deposit Products | Avg | Med | SD | Avg | Med | SD | Avg | Med | SD | CU | C Banks | S Banks |
| 1 Yr CD $10 k | 1.02 | 0.60 | 1.10 | 0.81 | 0.45 | 0.94 | 0.78 | 0.45 | 0.88 | 96,465 | 113,221 | 47,999 |
| 3 Yr CD $10 k | 1.48 | 1.15 | 1.08 | 1.21 | 0.90 | 0.96 | 1.18 | 0.90 | 0.89 | 86,535 | 104,952 | 43,951 |
| 5 Yr CD $10 k | 1.90 | 1.70 | 1.07 | 1.57 | 1.30 | 0.98 | 1.51 | 1.26 | 0.91 | 74,023 | 96,639 | 38,307 |
| Regular Savings $2.5 k | 0.14 | 0.10 | 0.16 | 0.14 | 0.10 | 0.16 | 0.14 | 0.10 | 0.12 | 44,860 | 54,018 | 25,233 |
| Interest Checking $2.5 k | 0.10 | 0.05 | 0.11 | 0.09 | 0.05 | 0.11 | 0.11 | 0.08 | 0.12 | 24,665 | 48,627 | 23,580 |
| Money Market $2.5 k | 0.38 | 0.20 | 0.54 | 0.25 | 0.10 | 0.39 | 0.24 | 0.13 | 0.36 | 73,577 | 102,206 | 42,834 |
| Credit Unions | C Banks | S Banks | Sample Size | |||||||||
| Loan Products | Avg | Med | SD | Avg | Med | SD | Avg | Med | SD | CU | C Banks | S Banks |
| 48Mo New Auto $25 k | 3.39 | 2.99 | 1.22 | 4.94 | 4.75 | 1.41 | 5.07 | 4.99 | 1.38 | 71,448 | 54,621 | 20,423 |
| 60Mo New Auto $25 k | 3.50 | 3.20 | 1.24 | 5.04 | 4.95 | 1.42 | 5.18 | 5.00 | 1.38 | 71,344 | 54,433 | 20,300 |
| 36Mo Fixed Unsec Loan $5 k | 9.61 | 9.50 | 2.06 | 10.64 | 10.23 | 2.85 | 9.93 | 9.50 | 3.07 | 66,523 | 32,209 | 7,761 |
| 15Yr Fixed Conforming | 3.47 | 3.38 | 0.81 | 3.48 | 3.38 | 0.79 | 3.35 | 3.25 | 0.69 | 38,496 | 43,674 | 13,176 |
| 30Yr Fixed Conforming | 4.09 | 4.00 | 0.75 | 4.06 | 4.00 | 0.72 | 3.92 | 4.00 | 0.63 | 36,401 | 42,023 | 12,773 |
Fig. 4.

The end-of-quarter average rate for products are shown by depository institution type
Deposit and loan composition
To highlight business model differences, summary statistics for deposit and loan portfolio weights are presented in Table 2 by bank type. The results are computed using the sample period 2007q1-2021q4. Data limitations between credit unions and commercial banks require broader categories to ensure they capture all relevant instruments. For example, the “Other Real Estate Loans” category combines subcategories including commercial real estate, industrial loans, agricultural loans, and so on.
Table 2.
Summary statistics of deposit and loan composition variables by depository institution type. Results are computed using the sample period 2007q1-2021q4. The sample size for credit unions, C banks, and S banks are (101,883), (95,168), and (42,040), respectively. The sample size here is smaller due to limited data availability on comparable deposit and loan composition variables for all three depository institution types
| Credit Unions | C Banks | S Banks | |||||||
| % of Total Deposits | Avg | Med | SD | Avg | Med | SD | Avg | Med | SD |
| Total Trasaction Accounts | 16.44 | 16.05 | 7.14 | 27.17 | 25.85 | 16.94 | 34.72 | 36.62 | 16.05 |
| Money Market & Savings Deposits | 54.56 | 54.92 | 12.68 | 41.67 | 37.23 | 19.66 | 36.03 | 31.68 | 17.95 |
| Time & Other Deposits | 29.01 | 27.74 | 13.84 | 31.05 | 29.02 | 16.19 | 29.26 | 27.51 | 14.29 |
| Total Non-Transaction Accounts | 83.56 | 83.95 | 7.14 | 72.72 | 74.01 | 16.96 | 65.28 | 63.38 | 16.05 |
| Credit Unions | C Banks | S Banks | |||||||
| % of Total Loans | Avg | Med | SD | Avg | Med | SD | Avg | Med | SD |
| Closed End Loans Secured by 1–4 Family Residential Properties | 32.83 | 32.46 | 19.78 | 28.83 | 23.44 | 21.15 | 22.44 | 20.00 | 14.78 |
| Open End Revolving Lines of Credit secured by 1–4 Family Residential Properties | 5.86 | 3.89 | 6.77 | 3.33 | 2.40 | 3.76 | 2.02 | 0.92 | 3.01 |
| Other Real Estate Loans | 5.59 | 3.02 | 7.36 | 44.22 | 45.24 | 18.15 | 45.01 | 45.06 | 14.95 |
| Total Real Estate Loans | 44.28 | 44.79 | 20.95 | 76.39 | 79.47 | 17.07 | 69.47 | 72.23 | 16.62 |
| Credit Card & Related Plan Loans | 4.67 | 4.03 | 4.03 | 0.62 | 0.04 | 4.85 | 0.20 | 0.03 | 0.97 |
| New & Used Auto Loans | 38.37 | 37.05 | 18.34 | 1.98 | 0.48 | 4.92 | 2.30 | 1.19 | 4.54 |
| Other Consumer Loans | 6.04 | 4.36 | 5.83 | 2.21 | 0.95 | 4.47 | 2.49 | 1.53 | 3.61 |
| Other Non-Real Estate Loans | 3.94 | 1.49 | 6.22 | 18.53 | 15.47 | 14.44 | 25.15 | 22.27 | 15.33 |
| Total Lease Financing Receivables | 0.14 | 0.00 | 1.75 | 0.32 | 0.00 | 1.85 | 0.42 | 0.00 | 2.19 |
| Total Non-Real Estate Loans | 53.16 | 52.38 | 20.54 | 23.66 | 20.57 | 17.07 | 30.56 | 27.78 | 16.60 |
The results show clear differences across all three bank types. Transaction accounts, which are bank deposits available at any time to customers, are greatest in S banks, followed by C banks, and then credit unions. Transaction accounts typically pay little to no interest to depositors. For non-transaction accounts, the money market and other savings account category represents the largest deposit share for credit unions. This is followed by C banks and then S banks. Time deposit weights are similar among all bank types.
For loan categories, the major distinction among the bank types is that credit unions primarily invest in residential mortgage loans and auto loans. C banks and S banks both primarily invest in commercial real estate loans followed by residential mortgage loans and commercial non-real estate loans. One reason for this difference is that credit unions are limited in the amount they can lend to a single entity. Also, the combined share of credit cards, auto loans, and other consumer loans is larger for credit unions compared to commercial banks, indicating a greater lending emphasis on member depositors. Results on interest rate competition from these bank types may reflect the business model differences seen in the deposit and loan portfolios.
Results
In this section we provide the baseline results for the comparison of deposit and loan rates for credit unions, S banks, and C banks using multivariate regression analysis. We provide additional robustness tests to ensure our results are due to differences in institution type and not due to other differences such as size, product mix, and location.
Interest rate comparison model
To compare interest rates on deposit and loan products among the three financial institutions we estimate the following OLS model,
| 1 |
where is the bank product interest rate, is a dummy variable equal to one for credit unions and equal to zero otherwise, is a dummy variable equal to one for S banks and equal to zero otherwise, and is a vector of control variables. Our estimates of interest are and which measure the average difference in bank product interest rates between financial institutions (= credit unions vs C banks, = S banks vs C banks). The control variables include the natural log of total assets, dummy variables for quarterly time periods, and dummy variables for the state location of bank headquarters. Standard errors are estimated using bank-level clustering.
Throughout our sample period, bank interest rates are significantly influenced by time-varying economic factors. For instance, changes in the federal funds rate, which is set by the Federal Reserve, is highly correlated with interest rates offered by banks, particularly for certificate of deposits. In addition, the financial crisis of 2007–08 and the economic fluctuations in 2020–21 due to Covid-19 affect banks in our sample. The average impact from these and other events on product interest rates are controlled using quarterly dummy variables in a panel regression. To control average effects stemming from state policies and regional economies, state dummy variables are included for the location of bank headquarters.
Additionally, for all tests we require a minimum of 5 bank observations in each state-quarter combination for every bank type. This ensures comparability and excludes bank observations where competition from differing bank types is not present. For example, if we compare interest rates on 1-Year CDs between C banks to S banks and the state of Hawaii in 2015q2 contains six C bank observations and three S bank observations, we exclude all observations from that state-quarter combination.
The size of financial institutions has a significant impact on many bank variables that influence performance and risk. Economies and diseconomies of scale are both present in the banking industry. Preliminary findings show that larger banks incur more noninterest expense relative to total assets which may affect interest rates offered on bank products. To control for the influence of size, we include the log of total assets in our model. Additionally, we divide our sample into small, medium, and large banks indicating total assets below $100 million, between $100 million and $1 billion, and above $1 billion, respectively. This ensures similar bank categories are being compared such as community banks (small), regional banks (medium), and national banks (large). Table 3 shows the average and median statistic for total assets by bank type and size group. Results are computed using the sample period 2007q1-2021q4 and drops observations if interest rate data is not available.
Table 3.
Summary statistics of total assets by size group and depository institution type. Results are computed using the sample period 2007q1-2021q4 and drops observations if interest rate data is not available
| Total Assets ($000) | Credit Unions | C Banks | S Banks | Sample Size | |||||
|---|---|---|---|---|---|---|---|---|---|
| Size Group | Avg | Med | Avg | Med | Avg | Med | CU | C Banks | S Banks |
| < 100 M | 49,951 | 47,968 | 62,933 | 63,823 | 66,187 | 68,384 | 34,495 | 14,131 | 9,780 |
| 100 M – 1,000 M | 343,960 | 264,108 | 386,122 | 322,749 | 319,586 | 252,508 | 53,935 | 74,804 | 35,981 |
| > 1,000 M | 3,034,110 | 1,751,903 | 26,847,618 | 2,295,179 | 2,225,427 | 1,564,696 | 13,552 | 27,360 | 3,558 |
| All | 601,996 | 179,702 | 6,572,283 | 381,408 | 406,829 | 217,335 | 101,982 | 116,295 | 49,319 |
Results from model (1) are shown in Tables 4, 5, and 6 for small, medium, and large banks, respectively. The first column shows the estimate for , second column shows the estimate for , and the third column shows the coefficient estimate for bank size. To conserve space, estimates for quarter and state dummy variables are not shown. The sample size for each test is listed on the last three columns. Tests on the small size group sample exclude results for fixed unsecured loans and mortgage loans due to limited data availability.
Table 4.
Results from OLS model (1). We estimate the difference in bank product rates among credit unions, C banks, and S banks. We control for size measured by Ln(TA), quarterly time effects, and headquarters state location. A minimum of five depository institution of each type is required for every quarter-state combination, otherwise observations are dropped. Results are computed using the sample period 2007q1-2021q4. Omitted results for fixed unsecured loans and mortgage loans are due to limited data availability in small depository institutions
| Small Banks (TA below $100 Million) | ||||||
|---|---|---|---|---|---|---|
| Credit Unions | S Banks | Ln(TA) | Sample Size | |||
| CU | C Banks | S Banks | ||||
| Deposit Products | ||||||
| 1 Yr CD $10 k | 0.05*** | 0.00 | 0.00 | 8,736 | 6,721 | 6,818 |
| 3 Yr CD $10 k | 0.03 | -0.02 | 0.04** | 5,556 | 4,827 | 5,193 |
| 5 Yr CD $10 k | 0.05 | 0.00 | 0.08*** | 3,416 | 3,699 | 4,024 |
| Regular Savings $2.5 k | -0.01 | 0.00 | -0.03*** | 4,855 | 3,679 | 3,652 |
| Interest Checking $2.5 k | -0.02** | -0.01 | 0.00 | 2,413 | 3,007 | 2,930 |
| Money Market $2.5 k | 0.04** | -0.01 | 0.00 | 4,738 | 4,948 | 5,051 |
| Loan Products | ||||||
| 48Mo New Auto $25 k | -1.98*** | 0.24 | -0.16 | 1,443 | 900 | 973 |
| 60Mo New Auto $25 k | -2.01*** | 0.20 | -0.17 | 1,442 | 899 | 957 |
***p < 0.01. **p < 0.05. *p < 0.1
Table 5.
Results from OLS model (1). We estimate the difference in product rates among credit unions, C banks, and S banks. We control for size measured by Ln(TA), quarterly time effects, and headquarters state location. A minimum of five depository institutions of each type is required for every quarter-state combination, otherwise observations are dropped. Results are computed using the sample period 2007q1-2021q4
| Medium Banks (TA between $100 Million and $1 Billion) | ||||||
|---|---|---|---|---|---|---|
| Credit Unions | S Banks | Ln(TA) | Sample Size | |||
| CU | C Banks | S Banks | ||||
| Deposit Products | ||||||
| 1 Yr CD $10 k | 0.14*** | -0.02*** | 0.00 | 25,426 | 42,833 | 30,820 |
| 3 Yr CD $10 k | 0.19*** | -0.03*** | 0.00 | 23,088 | 38,671 | 28,139 |
| 5 Yr CD $10 k | 0.25*** | -0.04*** | -0.01 | 20,275 | 34,817 | 24,016 |
| Regular Savings $2.5 k | -0.01 | -0.01* | -0.01** | 12,998 | 22,440 | 17,156 |
| Interest Checking $2.5 k | 0.00 | 0.00 | -0.01** | 7,356 | 19,289 | 15,015 |
| Money Market $2.5 k | 0.10*** | 0.00 | -0.01*** | 19,356 | 37,609 | 27,352 |
| Loan Products | ||||||
| 48Mo New Auto $25 k | -1.88*** | 0.20*** | -0.03 | 13,495 | 16,860 | 12,399 |
| 60Mo New Auto $25 k | -1.88*** | 0.21*** | -0.04 | 13,468 | 16,799 | 12,348 |
| 36Mo Fixed Unsec Loan $5 k | -0.46** | 0.37 | 0.00 | 7,570 | 5,147 | 3,396 |
| 15Yr Fixed Conforming | -0.05** | -0.04** | -0.09*** | 6,539 | 10,510 | 7,174 |
| 30Yr Fixed Conforming | 0.00 | -0.03 | -0.04*** | 5,937 | 9,797 | 6,900 |
***p < 0.01. **p < 0.05. *p < 0.1
Table 6.
Results from OLS model (1). We estimate the difference in product rates among credit unions, C banks, and S banks. We control for size measured by Ln(TA), quarterly time effects, and headquarters state location. A minimum of five depository institutions of each type is required for every quarter-state combination, otherwise observations are dropped. Results are computed using the sample period 2007q1-2021q4
| Large Banks (TA above $1 Billion) | ||||||
|---|---|---|---|---|---|---|
| Credit Unions | S Banks | Ln(TA) | Sample Size | |||
| CU | C Banks | S Banks | ||||
| Deposit Products | ||||||
| 1 Yr CD $10 k | 0.35*** | 0.00 | -0.02 | 1,386 | 2,758 | 1,092 |
| 3 Yr CD $10 k | 0.48*** | 0.02 | -0.05* | 1,212 | 2,439 | 887 |
| 5 Yr CD $10 k | 0.59*** | -0.04 | -0.06* | 1,191 | 2,325 | 931 |
| Regular Savings $2.5 k | 0.12** | -0.01 | 0.01 | 878 | 2,066 | 746 |
| Interest Checking $2.5 k | 0.00 | 0.01 | 0.01 | 536 | 976 | 477 |
| Money Market $2.5 k | 0.15*** | 0.01 | 0.00 | 1,186 | 2,405 | 977 |
| Loan Products | ||||||
| 48Mo New Auto $25 k | -1.93*** | -0.54** | -0.21*** | 1,123 | 2,010 | 794 |
| 60Mo New Auto $25 k | -1.91*** | -0.51** | -0.21*** | 1,120 | 2,011 | 798 |
| 36Mo Fixed Unsec Loan $5 k | -0.14 | 1.11 | 0.25 | 657 | 572 | 196 |
| 15Yr Fixed Conforming | -0.21*** | -0.08** | -0.01 | 939 | 1,716 | 577 |
| 30Yr Fixed Conforming | -0.12*** | -0.06** | 0.00 | 916 | 1,659 | 561 |
***p < 0.01. **p < 0.05. *p < 0.1
Overall, the results indicate credit unions differ significantly compared to both C banks and S banks in interest rate offerings for most products across all size groups. For small institutions, interest rates are mostly comparable among all bank types with results showing insignificant differences or materially small estimates. One exception is that small credit unions offer significantly lower auto loan rates compared to commercial banks with an estimate of -2%.
In medium sized institutions, more significant differences are observed. For deposit products, credit unions offer significantly higher rates for timed deposits and money market accounts compared to commercial banks. Auto loans rates by credit unions remain competitive in this size group with estimated differences of -1.88%. Surprisingly, medium sized S banks charge higher auto loan rates compared to C banks by about 20 basis points. Otherwise, commercial bank differences are minimal.
Results for the large size group show even greater differences in most products compared to the medium and small size groups. Credit union estimates for deposit products are significant with 5-year CDs offering about 60 basis points more than C banks. Auto loan rates differences between credit unions and C banks increase in this size group to about -1.93%. Also, only in this subsample do we find credit unions offering mortgage rates significantly lower to C banks with 15-year and 30-year mortgage differences at -21 and -12 basis points, respectively. For commercial banks, deposit rate differences among large institutions are not present. In auto loans, we find that large S banks charge lower rates compared to C banks with a difference of -54 basis points. This is in contrast to the findings for medium sized institutions. Also, large S banks charge lower mortgage rates compared to C banks with estimated differences between -6 and -8 basis points. These findings hint that large S banks may pass some of the tax savings onto customers, though the magnitudes are economically small compared to credit unions.
Matching comparison model
In our second test, we match banks using the Mahalanobis distance method and then repeat our comparison of interest rates for the three depository institution types. We match observations by minimizing the vector distance of covariates. The covariates chosen are size, measured by Ln(TA), and deposits, measured by the ratio of total deposits to assets. For institutions in our sample, total deposits comprise about 85% of total assets on average. Deposits are considered low-cost and reliable capital compared to other instruments like long-term bonds and stock. The share of deposits used by institutions, rather than other forms of debt and equity, affect asset portfolio decisions and profitability. Matching banks on this second covariate, in addition to size, provides a sample of comparable banks. We keep our selection of covariates parsimonious so the weight and importance of each variable remains high when computing the vector distance. In addition, we also require exact matching based on quarter and state. The resulting sample of matched banks is used to run the following OLS models,
| 2 |
| 3 |
| 4 |
where is the bank product interest rate, is a dummy variable equal to one for credit unions and equal to zero for C banks, is a dummy variable equal to one for credit unions and equal to zero for S banks, is a dummy variable equal to one for S banks and equal to zero for C banks, and is a vector of control variables. Our estimate of interest is which measures the average difference in bank product interest rates between financial institutions. The control variables include the natural log of total assets, dummy variables for quarterly time periods, and dummy variables for the state location of bank headquarters. Standard errors are estimated using bank-level clustering.
Restrictions on this sample are the same as in Section 5.1 where we ensure at least 5 observations are available for each bank type and for every state-quarter combination. The sample size in this analysis is larger than the prior since the observation requirements only apply to the pair groups. For example, when matching credit unions and C banks, a valid state-quarter combination can have credit union and C bank observations greater than 5 while there may be zero observations for S banks. However, if S banks are then matched with C banks, that same state-quarter combination would be dropped. Lastly, the matching method and analysis are conducted using the three size group subsamples.
Results from models (2), (3), and (4) are shown in Tables 7, 8, and 9 for small, medium, and large banks, respectively. Results are estimated for the sample period 2007q1-2021q4. Estimates of for each model are shown in the first three columns. The sample size for each model is given in the last six columns. Overall, the results using the matching method are stronger compared to the baseline results in Section 5.1.
Table 7.
Results from OLS models (2), (3), and (4) using Mahalanobis distance matching. For each comparison, depository institutions are exactly matched based on date and location and vector distance matched based on size and the deposit to asset ratio. We estimate the difference in product rates among credit unions, C banks, and S banks. We control for size measured by Ln(TA), quarterly time effects, and headquarters state location. A minimum of five depository institution of each type is required for every quarter-state combination, otherwise observations are dropped. Results are computed using the sample period 2007q1-2021q4. Omitted results for fixed unsecured loans and mortgage loans are due to limited data availability in small banks
| Small Banks (TA below $100 Million) | |||||||||
|---|---|---|---|---|---|---|---|---|---|
| (2) | (3) | (4) | Sample (2) | Sample (3) | Sample (4) | ||||
| CU vs C | CU vs S | S vs C | CU | C Banks | CU | S Banks | S Banks | C Banks | |
| Deposit Products | |||||||||
| 1 Yr CD $10 k | 0.09*** | 0.04** | 0.00 | 16,763 | 10,315 | 9,365 | 7,116 | 7,076 | 6,976 |
| 3 Yr CD $10 k | 0.09*** | 0.06** | -0.02 | 11,561 | 7,871 | 6,226 | 5,536 | 5,546 | 5,130 |
| 5 Yr CD $10 k | 0.11*** | 0.09** | 0.01 | 6,814 | 5,695 | 4,139 | 4,494 | 4,404 | 4,046 |
| Regular Savings $2.5 k | 0.00 | -0.01 | 0.00 | 9,056 | 5,285 | 5,219 | 3,837 | 3,798 | 3,793 |
| Interest Checking $2.5 k | -0.01 | -0.02 | -0.01 | 3,561 | 3,977 | 2,633 | 3,007 | 3,464 | 3,454 |
| Money Market $2.5 k | 0.06*** | 0.05*** | 0.00 | 8,160 | 7,312 | 5,174 | 5,322 | 5,924 | 5,642 |
| Loan Products | |||||||||
| 48Mo New Auto $25 k | -1.82*** | -2.54*** | 0.25 | 2,864 | 1,694 | 1,910 | 1,320 | 1,005 | 930 |
| 60Mo New Auto $25 k | -1.86*** | -2.54*** | 0.22 | 2,862 | 1,694 | 1,910 | 1,300 | 988 | 929 |
***p < 0.01. **p < 0.05. *p < 0.1
Table 8.
Results from OLS models (2), (3), and (4) using Mahalanobis distance matching. For each comparison, depository institution are exactly matched based on date and location and vector distance matched based on size and the deposit to asset ratio. We estimate the difference in product rates among credit unions, C banks, and S banks. We control for depository institution size measured by Ln(TA), quarterly time effects, and headquarters state location. A minimum of five depository institution of each type is required for every quarter-state combination, otherwise observations are dropped. Results are computed using the sample period 2007q1-2021q4
| Medium Banks (TA between $100 Million and $1 Billion) | |||||||||
|---|---|---|---|---|---|---|---|---|---|
| (2) | (3) | (4) | Sample (2) | Sample (3) | Sample (4) | ||||
| CU vs C | CU vs S | S vs C | CU | C Banks | CU | S Banks | S Banks | C Banks | |
| Deposit Products | |||||||||
| 1 Yr CD $10 k | 0.18*** | 0.19*** | -0.02** | 47,374 | 68,347 | 26,274 | 31,704 | 32,032 | 44,321 |
| 3 Yr CD $10 k | 0.23*** | 0.25*** | -0.03*** | 44,178 | 62,896 | 23,884 | 28,857 | 29,592 | 40,637 |
| 5 Yr CD $10 k | 0.27*** | 0.31*** | -0.05*** | 39,340 | 57,105 | 20,972 | 25,065 | 25,256 | 36,318 |
| Regular Savings $2.5 k | 0.00 | 0.01 | -0.01 | 21,602 | 31,714 | 13,186 | 17,359 | 17,887 | 23,214 |
| Interest Checking $2.5 k | 0.00 | 0.01 | 0.00 | 11,803 | 26,876 | 7,470 | 15,201 | 16,775 | 21,340 |
| Money Market $2.5 k | 0.11*** | 0.10*** | 0.00 | 38,734 | 61,404 | 20,040 | 28,210 | 28,571 | 39,268 |
| Loan Products | |||||||||
| 48Mo New Auto $25 k | -1.89*** | -2.14*** | 0.18*** | 28,637 | 28,861 | 14,110 | 13,032 | 13,100 | 17,461 |
| 60Mo New Auto $25 k | -1.88*** | -2.15*** | 0.19*** | 28,621 | 28,701 | 14,074 | 12,975 | 13,039 | 17,399 |
| 36Mo Fixed Unsec Loan $5 k | -1.21*** | -0.77*** | 0.47 | 22,290 | 14,505 | 8,734 | 4,033 | 3,489 | 5,229 |
| 15Yr Fixed Conforming | -0.10*** | 0.00 | -0.05** | 14,774 | 19,500 | 7,159 | 7,605 | 8,113 | 11,465 |
| 30Yr Fixed Conforming | -0.04** | 0.05** | -0.03* | 13,998 | 18,370 | 6,527 | 7,347 | 7,807 | 10,776 |
***p < 0.01. **p < 0.05. *p < 0.1
Table 9.
Results from OLS models (2), (3), and (4) using Mahalanobis distance matching. For each comparison, depository institutions are exactly matched based on date and location and vector distance matched based on size and the deposit to asset ratio. We estimate the difference in product rates among credit unions, C banks, and S banks. We control for depository institution size measured by Ln(TA), quarterly time effects, and headquarters state location. A minimum of five depository institution of each type is required for every quarter-state combination, otherwise observations are dropped. Results are computed using the sample period 2007q1-2021q4
| Large Banks (TA above $1 Billion) | |||||||||
|---|---|---|---|---|---|---|---|---|---|
| (2) | (3) | (4) | Sample (2) | Sample (3) | Sample (4) | ||||
| CU vs C | CU vs S | S vs C | CU | C Banks | CU | S Banks | S Banks | C Banks | |
| Deposit Products | |||||||||
| 1 Yr CD $10 k | 0.33*** | 0.35*** | 0.01 | 9,385 | 14,914 | 1,386 | 1,092 | 1,481 | 3,613 |
| 3 Yr CD $10 k | 0.44*** | 0.43*** | 0.04 | 8,997 | 14,150 | 1,212 | 887 | 1,272 | 3,266 |
| 5 Yr CD $10 k | 0.53*** | 0.63*** | 0.02 | 8,781 | 13,606 | 1,191 | 931 | 1,291 | 3,124 |
| Regular Savings $2.5 k | 0.06*** | 0.10*** | -0.01 | 5,795 | 9,701 | 878 | 746 | 905 | 2,344 |
| Interest Checking $2.5 k | 0.05*** | -0.01 | 0.01 | 3,808 | 7,168 | 536 | 477 | 794 | 1,946 |
| Money Market $2.5 k | 0.18*** | 0.11*** | 0.03* | 8,268 | 12,787 | 1,186 | 977 | 1,314 | 3,170 |
| Loan Products | |||||||||
| 48Mo New Auto $25 k | -1.69*** | -1.37*** | -0.69*** | 7,895 | 9,666 | 1,123 | 794 | 982 | 2,419 |
| 60Mo New Auto $25 k | -1.69*** | -1.38*** | -0.64*** | 7,902 | 9,656 | 1,120 | 798 | 986 | 2,420 |
| 36Mo Fixed Unsec Loan $5 k | -1.50*** | -1.81 | 1.28 | 6,300 | 6,071 | 657 | 196 | 196 | 572 |
| 15Yr Fixed Conforming | -0.14*** | -0.13*** | -0.07 | 7,121 | 9,473 | 939 | 577 | 748 | 2,056 |
| 30Yr Fixed Conforming | -0.08*** | -0.07** | -0.04 | 6,931 | 9,005 | 916 | 561 | 728 | 1,993 |
***p < 0.01. **p < 0.05. *p < 0.1
In small institutions, credit unions offer significantly higher rates for all timed deposit products and money market accounts. These results contrast those from model (1) where credit unions displayed mixed results. As before, auto loan rates by credit unions are significantly more competitive than commercial banks. For small S banks, no significant differences are detected compared to C banks.
In medium sized institutions, the same pattern is detected for credit unions. This time, in contrast to model (1) findings, all loan products by credit unions charge lower interest rates compared to C banks. Fixed unsecured loans stand out as credit unions charge 1.21% less than C banks. For medium sized S banks, we still observe lower deposit rates in timed products and higher auto loan rates compared to C banks.
In large credit unions we find uniform results compared to C banks—all credit union deposit products offer significantly higher rates and all loan products charge significantly lower rates. The same pattern largely applies when comparing credit unions to S banks. Between large commercial banks, the only significant result observed is that auto loan rates are lower in S banks by about 69 basis points. If S banks are passing tax savings onto customers in the form of better interest rates, we can only detect it in auto loans and only in S banks with total assets above $1 billion.
Quartile comparison
Results in Section 5.1 and 5.2 show that interest rates differ significantly between credit unions and commercial banks, particularly for CD and money market rates and auto loan rates. In contrast, commercial banks are largely similar with the exception that S banks charge more or less interest on auto loans compared to C banks depending on their size. To examine whether the patterns we find hold consistently across high- and low-interest rate banks, we form quartiles based on the 5-year CD rate for each institution type.4 This is a way of seeing whether our results are driven by institutions that offer low interest rates or those that offer high interest rates. For this analysis we do not match institutions by characteristics and therefore the results should be interpreted with caution. In particular, we may be comparing banks of very different sizes given that C banks are, on average, larger than S banks and credit unions.
Table 10 reports summary statistics for the 5-year CD rate and 60-month auto loan rate by quartile groups and by institution type. The results are estimated using the sample period 2007q1-2021q4. As before, we require at least 5 observations of each bank type for state-quarter combinations. Overall, the results indicate credit unions offer the most competitive deposit rates while simultaneously charging the lowest loan rates for all quartile groups. To highlight this, in the fourth quartile, credit unions offer a deposit rate of about 2.5% while C banks and S banks both offer deposit rates of 2.03%. In the same quartile, credit unions charge 3.56% for auto loans while C banks charge 4.91% and S banks charge 5.18%. A surprising result is that credit unions do not charge higher auto loan rates in the first three quartiles as deposit rates rise. In contrast, commercial banks increase their auto loan rates as the CD rate increases. These results further emphasize the gap between credit unions and commercial banks in interest rate competition.
Table 10.
Summary statistics for 5-year CD rates and 60-month auto loan rates by quartiles and by depository institution type. Quartiles are based on the 5-year CD rate and ranked from lowest to highest. 60-month auto loan rate summary statistics are computed for each quartile group. A minimum of five depository institution of each type is required for every quarter-state combination, otherwise observations are dropped. Results are computed using the sample period 2007q1-2021q4
| CU | 5-Year CD Rate | Auto Loan Rate | |||||
| Quartile | Avg | Med | SD | Avg | Med | SD | Sample |
| 1 | 0.76 | 0.80 | 0.22 | 2.93 | 2.95 | 0.71 | 4,496 |
| 2 | 1.30 | 1.30 | 0.14 | 2.91 | 2.85 | 0.79 | 5,079 |
| 3 | 1.76 | 1.75 | 0.15 | 2.92 | 2.90 | 0.71 | 4,700 |
| 4 | 2.50 | 2.35 | 0.49 | 3.56 | 3.49 | 0.95 | 4,414 |
| C | 5-Year CD Rate | Auto Loan Rate | |||||
| Quartile | Avg | Med | SD | Avg | Med | SD | Sample |
| 1 | 0.55 | 0.56 | 0.19 | 4.68 | 4.50 | 1.21 | 5,863 |
| 2 | 0.99 | 1.00 | 0.08 | 4.71 | 4.50 | 1.24 | 5,060 |
| 3 | 1.31 | 1.29 | 0.11 | 4.77 | 4.75 | 1.19 | 5,801 |
| 4 | 2.03 | 1.95 | 0.49 | 4.91 | 4.90 | 1.22 | 6,105 |
| S | 5-Year CD Rate | Auto Loan Rate | |||||
| Quartile | Avg | Med | SD | Avg | Med | SD | Sample |
| 1 | 0.58 | 0.60 | 0.17 | 4.93 | 4.75 | 1.33 | 3,397 |
| 2 | 0.99 | 1.00 | 0.08 | 4.96 | 4.80 | 1.33 | 3,108 |
| 3 | 1.30 | 1.26 | 0.11 | 5.02 | 4.99 | 1.24 | 3,388 |
| 4 | 2.03 | 1.90 | 0.52 | 5.18 | 5.00 | 1.28 | 3,657 |
In a similar analysis, we form additional quartile groups by ranking the auto loan portfolio weight for depository institutions and then compare auto loan rates across groups. This analysis explores whether the portfolio concentration in auto loans relative to total loans is related to the interest rate charged on auto loans. Table 11 presents the summary statistics for auto loan portfolio weights and auto loan rates by quartile groups and by institution type. The same restrictions are placed as in Table 10 when creating the quartile groups. The results for credit unions indicate the interest rates charged do not differ among the four quartile groups. This is surprising given the high proportion and variability of auto loans in credit unions, ranging between 22 and 66% for quartile groups. Average auto loan rates by credit unions remain stable at about 3% regardless of portfolio concentration. Commercial banks, in contrast, have auto loan portfolio weights ranging from under 1% to about 6.5%. Also, auto loan interest rates for commercial banks decline as auto loans make up a bigger portion of a bank’s portfolio. For instance, C bank auto loan rates range from 5.28% at low portfolio weights to 4.44% at higher weights. As before, the results here indicate credit unions charge lower interest rates compared to commercial banks, regardless of auto loan portfolio weight, whereas the differences between S banks and C banks are minor.
Table 11.
Summary statistics for auto loan portfolio weights and auto loan interest rates by quartiles and by depository institution type. Quartiles are based on the auto loan portfolio weight and ranked from lowest to highest. 60-month auto loan rate statistics are computed for each quartile group. A minimum of five depository institution of each type is required for every quarter-state combination, otherwise observations are dropped. Results are computed using the sample period 2007q1-2021q4
| CU | Auto Loans / L | Auto Loan Rate | |||||
| Quartile | Avg | Med | SD | Avg | Med | SD | Sample |
| 1 | 22.48 | 23.93 | 6.73 | 3.05 | 2.99 | 0.79 | 6,663 |
| 2 | 37.33 | 37.38 | 3.27 | 3.00 | 2.99 | 0.79 | 6,662 |
| 3 | 49.30 | 49.22 | 3.72 | 2.97 | 2.95 | 0.74 | 6,659 |
| 4 | 66.36 | 64.55 | 8.07 | 3.06 | 2.99 | 0.76 | 6,655 |
| C | Auto Loans / L | Auto Loan Rate | |||||
| Quartile | Avg | Med | SD | Avg | Med | SD | Sample |
| 1 | 0.07 | 0.05 | 0.06 | 5.28 | 5.20 | 1.19 | 7,138 |
| 2 | 0.45 | 0.44 | 0.16 | 4.80 | 4.75 | 1.12 | 7,048 |
| 3 | 1.31 | 1.23 | 0.41 | 4.70 | 4.50 | 1.14 | 7,082 |
| 4 | 6.46 | 4.07 | 7.59 | 4.44 | 4.25 | 1.26 | 7,060 |
| S | Auto Loans / L | Auto Loan Rate | |||||
| Quartile | Avg | Med | SD | Avg | Med | SD | Sample |
| 1 | 0.21 | 0.19 | 0.13 | 5.36 | 5.25 | 1.28 | 4,308 |
| 2 | 0.76 | 0.76 | 0.19 | 5.10 | 5.00 | 1.14 | 4,231 |
| 3 | 1.66 | 1.63 | 0.38 | 4.97 | 4.92 | 1.23 | 4,238 |
| 4 | 6.56 | 3.97 | 7.82 | 4.90 | 4.74 | 1.58 | 4,241 |
Subsample analysis
The time period we study between 2007 to 2021 includes both the financial crisis, the Covid-19 crisis, and a period of very low interest rates. To confirm the validity of our findings we perform subsample analyses for the period 2010 to 2019 which excludes the financial crisis and Covid crisis, for the period 2015 to 2019 when the federal funds rate was rising, and for periods before and after the TCJA.5 In untabulated results we find that, irrespective of the time period and asset size, credit unions provide better deposit and loan rates to customers compared to the S banks and C banks. The estimates from these tests using different subsample periods are similar to those reported in Tables 4, 5, 6, 7, 8, 9.6
Conclusion
Depository institutions largely compete over the same depositors and borrowers due to deregulation over the last thirty years, particularly in the 1990s. In this study we investigate how the three primary financial institution types in the US – credit unions, C banks, and S banks – compete for deposit and loan customers by comparing interest rates offered on specific products. Our a priori expectation is that credit unions and S banks should offer more competitive deposit and loan interest rates compared to C banks due to their tax benefit. This benefit is greater for credit unions than S banks since the latter must pay taxes on all pass-through income. Additionally, due to shareholder/member motivational differences, we expect credit unions to offer better interest rates to customers than commercial banks since they are managed by member depositors and are not-for-profit institutions.
Our results from analyzing 11 distinct deposit and loan products from depository institutions partitioned into three size groups show that credit unions offer better deposit and loan interest rates to customers overall compared to commercial banks, particularly for timed deposits (CDs), money market accounts, auto loans, and fixed unsecured loans. In contrast, S banks, while tax-exempt at the corporate level, do not display consistent differences to C banks. These findings generally hold across all size groups and differences become more pronounced when comparing larger credit unions to commercial banks. Notably, credit unions in the large size group offer better interest rates to customers for all products analyzed. Between commercial banks, only in auto loans do we find significant differences with medium-sized S banks charging higher interest rates while large S banks charge lower rates compared to similarly sized C banks. The overall trend suggests tax-exempt depository institutions pass savings onto customers as they increase in size, with this benefit being more pronounced in credit unions.
Tax-exemption in depository institutions has been a controversial topic since the 1990s when credit unions were able to compete with commercial banks for the same depositors due to deregulation in membership requirements. Additionally, policy changes in 1996 allowed commercial banks to restructure as S corporations and avoid double taxation. Our results show the tax-exemption status in credit unions, alongside business model differences, provide significant benefits to customers through better deposit and loan interest rates. S banks, however, do not show similar benefits compared to C banks. This may be because S banks still pay taxes on all pass-through income and therefore experience a smaller tax benefit. Also, S banks are for-profit institutions and may direct tax savings toward shareholders.
Overall, credit unions display an economic form of dominance to commercial banks in their interest rate offerings. This means credit unions offer higher deposit rates while simultaneously charging lower loan rates, a situation that could shift funds from savers and borrowers away from commercial banks. This is most readily seen when comparing timed deposits like CDs and consumer loans like auto loans or unsecured personal loans. Further research in interest rate competition may provide insight into how credit unions and commercial banks are responding to these differences.
Declarations
Conflicts of Interests/Competing Interests
The authors have no relevant financial or non-financial interests to disclose. The authors have no competing interests to declare that are relevant to the content of this article.
Footnotes
Summers (2001) in his report to the United States Department of the Treasury on “Comparing Credit Unions with Other Depository Institutions” states that “Significant differences have existed in the past but have been gradually disappearing. Recently, most of the remaining major regulatory differences between credit unions and other depository institutions were removed”. https://home.treasury.gov/system/files/131/Report-Credit-Unions-2001.pdf
Where is the average interest rate on loans that DIs charge and is the average interest rate on deposits offered by DIs.
We have included all the DIs that were present and active in each of the quarters i.e. the DIs that were acquired or failed were not dropped from the sample. Also, the status of the DIs is as they were in the sample year and not as they were in the final year of the sample. As per S&P Global Market Intelligence, the rates data available on the platform is sourced from 1) the rate sheets that Bank Representatives submit, 2) rates on the company websites or 3) by directly contacting the Bank Representatives.
We thank an anonymous referee for suggesting to expand our analysis for the observed differences in the auto loan rates and to also check if our results are driven by few states or a few years. In untabulated results we summarize the auto loan rate variable by depository institution type, by state, and by quarter. We do not find any significant outlier year or state to drive the observed results.
We thank an anonymous referee for suggesting us to do the subsample analysis for 2010–2019 and 2015–2019.
To conserve space we do not provide the results for these tests. They are available from authors upon request.
Publisher's Note
Springer Nature remains neutral with regard to jurisdictional claims in published maps and institutional affiliations.
Contributor Information
Edward R. Lawrence, Email: elawrenc@fiu.edu
Ca Nguyen, Email: ca.nguyen@uafs.edu.
Alejandro Pacheco, Email: alex.pacheco@uafs.edu.
References
- Anderson R, Liu Y (2013) Banks and credit unions: competition not going away. Fed Reserve Bank St. Louis. https://www.stlouisfed.org/publications/regional-economist/april-2013/banks-and-credit-unions--competition-not-going-away. Accessed 15 Apr 2022
- Berger DB (2013) BankThink back down, credit union tax exemption has merit. American Banker. https://www.americanbanker.com/opinion/back-down-bankers-credit-union-tax-exemption-has-merit. Accessed 15 Apr 2022
- Chang CH, Jain A, Lawrence ER, Prakash AJ. The Tax exemption to subchapter S banks: who gets the benefit. Financ Rev. 2016;51(3):329–362. doi: 10.1111/fire.12107. [DOI] [Google Scholar]
- Credit Union National Association (2019) Credit union not-for-profit tax status. https://www.cuna.org/uploadedFiles/Global/About_Credit_Unions/CUTaxStatusWhitePaper_April19.pdf. Accessed 15 Apr 2022
- Demangone A (2010) Credit unions and their "Unfair" advantage. National Association of Federally Insured Credit Unions. https://www.nafcu.org/compliance-blog/credit-unions-and-their-unfair-advantage. Accessed 15 Apr 2022
- Depken CA, II, Hollans H, Swidler S. Do tax benefits conferred to Sub-S banks affect their deposit or loan rates. Financ Res Lett. 2010;7(4):238–245. doi: 10.1016/j.frl.2010.09.002. [DOI] [Google Scholar]
- Donohoe MP, Lisowsky P, Mayberry MA. The effects of competition from S corporations on the organizational form choice of rival C corporations. Contemp Account Res. 2019;36(3):1784–1823. doi: 10.1111/1911-3846.12464. [DOI] [Google Scholar]
- Hannley M (2017) Credit unions have unfair tax advantage over banks. Tucson. https://tucson.com/opinion/local/mike-hannley-credit-unions-have-unfair-tax-advantage-over-banks/article_cd038974-a4b3-5ca2-937f-8fbf66fa19ee.html. Accessed 15 Apr 2022
- Hunt C (2019) The difference between banks and credit unions could not be clearer. The Hill. https://thehill.com/opinion/finance/428546-the-difference-between-banks-and-credit-unions-could-not-be-clearer
- Laval K (1990) Bankers claim credit unions have unfair advantage. The Oklahoman. https://www.oklahoman.com/article/2312359/bankers-claim-credit-unions-have-unfair-advantage. Accessed 15 Apr 2022
- McLachlan GJ. Mahalanobis distance. Resonance. 1999;4(6):20–26. doi: 10.1007/BF02834632. [DOI] [Google Scholar]
- Reosti J (2018) Do credit unions still warrant a tax exemption. American Banker. https://www.americanbanker.com/news/do-credit-unions-still-warrant-a-tax-exemption. Accessed 15 Apr 2022
- Summers L. H. (2001) Comparing credit unions with other depository institutions. Report to the United States Department of Treasury. https://home.treasury.gov/system/files/131/Report-Credit-Unions-2001.pdf
- White L (2020) Credit unions have unfair advantage over banks. Indianap Bus J. https://www.ibj.com/articles/credit-unions-have-unfair-advantage-over-banks. Accessed 15 Apr 2022
- York E (2019) Repealing the federal tax exemption for credit unions. Tax Foundation. https://taxfoundation.org/repealing-credit-union-exemption. Accessed 15 Apr 2022