

Abstract
Presently, the prime global focus is on SARS-CoV-2, as no fully established, licensed medicine has been found thus far, in spite of the existence of various reports and administration of partially proven certain class of natural products. However, in case of natural products, the extraction and purification limit their application. This situation drives researchers to explore synthetically viable drugs. In the present investigation, twenty-three 2-pyridone synthetic derivatives (P1-P23) have been theoretically tested for their suitability as potential inhibitors for COVID-19 main protease through DFT, molecular docking, and molecular dynamics simulations. DFT calculations offer insights into structure–property relationships, while ADMET studies indicate the pharmacological characteristics of these molecules. Molecular docking studies ascertain the nature and mode of interactions of these entities with COVID-19 main protease. Furthermore, covalent docking has been carried out to verify the feasibility of the formation of a covalent bond with the active site. The top protein-inhibitor complexes, such as P18, P11, and P12, were identified based on their glide score. These molecules, along with the covalent docked complexes, namely P18 and P16, were selected and subjected to molecular dynamics simulations. The 100 ns simulation process exhibited that the covalent docked ones, due to their stable form could serve as lead compounds against SARS-CoV-2. Hence, this study affirms the potential candidature of 2-pyridone-based inhibitors.
Keywords: COVID-19 drug discovery, COVID-19 main protease, Molecular dynamics simulation, Covalent docking, 2-pyridone, SARS-CoV-2 inhibitor
Introduction
A novel variant of coronavirus has been identified as a severe acute respiratory syndrome (SARS-CoV-2) at Wuhan, China, in early December 2019 [1]. As on date, nearly 500 million people have been affected, with around 5 million deaths [2, 3], causing a global-scale economic crisis and hampering social activities [4]. Due to its widespread contagious nature and its adverse effects on millions of people, the World Health Organization (WHO) declared the COVID-19 pandemic on 11 March 2020 [5]. This virus primarily spreads among people through tiny respiratory droplets produced in sneeze or cough of infected person (airborne transmission) or by contact transmission, by touching the contaminated surface or object [6, 7]. As preventive measure, several countries imposed lockdown, social distancing, and quarantine protocols, meanwhile mask-wearing has been widely advocated to mitigate the transmission of the virus [8]. Despite implementing numerous countermeasures, the spread of disease continues in many nations in waves in various mutated forms. Several trials have been carried out to find an effective treatment for SARS-CoV-2. In one of the trials, remdesivir (ribonucleotide analog inhibitor of viral RNA dependent RNA polymerase) was suggested as one of the viable treatment options by US Food and Drug Administration (FDA) in case of an emergency use in a hospitalized patient [9, 10]. Currently, there are no targeted antiviral agents to treat this disease, and the availability of effective treatment options is limited [11, 12]. Thus, developing effective therapies and treatments for COVID-19 is the need of hour, and considering the nature of its impact, a long time permanent solution is sought to save our human community.
It is well known that designing a drug requires a comprehensive understanding on the virus and its structural features. SARS-CoV-2 is a single-stranded, enveloped positive-sense RNA virus genome of around 30 kb long belonging to the order Nidovirales, genus β. SARS-CoV-2 of the family Coronaviride is the seventh strain of coronavirus identified as pathogenic to humans as well as the first and only HCoV with pandemic potential [11, 13, 14]. This family features the largest genome of all RNA viruses found to date [15]. The viral genome is protected within the nucleocapsid protein which contains seven conserved genes in the 5′ to 3′ direction, namely ORF1a, ORF1b, S, OEF3, E, M, and N. ORF1a/b, covering around two thirds of the RNA genome and generates two viral replicase proteins known as polyprotein PP1a (~ 450 kDa) and polyprotein PP1b (~ 750 kDa) which further undergoes self-proteolysis to give 16 non-structural proteins (Nsp1-16) [16]. The other half of the RNA genome encodes four structural proteins: spike(S), envelope(E), membrane(M), nucleocapsid(N), and several other accessory proteins [17, 18]. For virus replication and transcription, the cleavage of the two polyproteins precursors (pp1a/pp1ab) into individual non-structural proteins is essential. Chymotrypsin-like cysteine protease (3CL protease also referred to as Mpro) and papain-like cysteine protease (PLpro) are the two viral proteases involved in the cleaving process. There are several viral enzymes [19, 20] which involve in the viral replication of the coronavirus. All these enzymes can act as key targets for developing antiviral drugs. However, the recent antiviral studies conducted over the course of investigation focused on inhibiting the two viral proteases, namely main protease (Mpro) and papin -like protease (PLpro). Among them, the SARS-CoV-2 Mpro exhibits high sequence identity with the SARS-CoV Mpro (i.e., > 96) with the exception of a key residue (i.e., Ala285Thr). Also, they are structurally similar to each other (i.e., a root-mean-squared deviation (RMSD) value of f 0.44 Å for Cα) [20]. In addition, Mpro cleaves at 11 sites on the large polyprotein with the recognition sequence of Leu-Gln- (Ser/Ala/Gly) which is the only human protease that solely cleaves polypeptide after glutamine (Gln) residue, and there is no other human protease with the same cleavage specificity as this [17, 21]. As a result, inhibiting the Mpro over the PLpro could be considered a key activity to prevent viral replication inside the host cell and thereby acts as a key antiviral target. This approach paves the way for the development of Mpro-specific drugs with fewer side effects [18]. Till date, SARS-CoV-2 virus lacks a specific Mpro inhibitor and this fact drives us to envisage the designing of inhibitors for this deadly species.
In search of inhibitors, heterocycles appear attractive, as the majority of pharmaceuticals and biologically important agrochemicals belong to this class [22]. Among the heterocycles, researchers have been fascinated by nitrogen-containing heterocyclic compounds for decades in the development of inhibitors due to historical development of organic synthesis [23]. Among all the nitrogen-containing heterocyclic compounds, 2-pyridone — a six-membered cyclic system with nitrogen in the ring Fig. 1 — becomes a great choice of interest by the researchers because of its considerable biological properties, which include antibacterial, anticancer, anti-inflammatory, antiproliferative, and anti-hepatitis B virus [24]. The 2-pyridone derivatives serve as SARS-CoV-2 main protease inhibitors [24]. In addition, 2-pyridone exists in the tautomeric form of 2-hydroxy pyridone, which shows desired chemical properties [24]. Therefore, 2-pyridone-based compounds continue to attract researchers due to their ease in synthesis and flexibility in chemical modification [25].
Fig. 1.
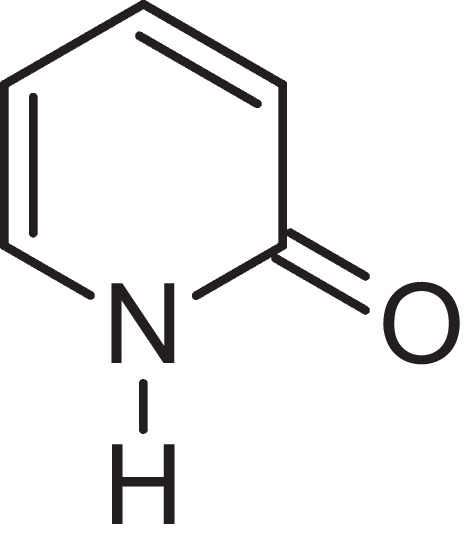
2-pyridone
It has been recently reported that 2-pyridone derivatives of the natural scaffold show good inhibitory activity against SARS-CoV-2 Mpro [25]. However, green extraction of natural products is often time and energy-consuming, in addition to the generation of huge waste [26]. The separation and purification process is a challenging task in natural products. The synthetic compounds are replacing the natural products in the industry due to the above mentioned challenges. Hence in a short span of time and to prevent the spread of the disease, a synthetically feasible drug has to be identified which is, economically viable, and exhibits maximum benefit. Here in, we report on the collection of synthetic 2-pyridone derivatives and their biological impact on the inhibition of SARS-CoV-2 main protease. The possibility of using the prepared 2-pyridone derivatives as inhibitors due to their synthetic feasibility and mass production has been explored. The electronic structures of 2-pyridone derivatives have been envisaged and the inhibition process is modeled through molecular docking and molecular dynamics simulations. Twenty-three synthesized 2-pyridone structures are chosen and screened using density functional theory calculations to understand the structure–property relationships followed by studying their pharmacokinetic and ADMET properties to evaluate their bioavailability and inhibition efficiency. Molecular docking and molecular dynamics (MD) simulations have been done to understand the inhibition mechanism against Mpro of SARS-CoV-2 to propose an effective 2-pyridone-based inhibitor.
Materials and methods
Density functional theory calculations
Theoretical calculations have made it possible to derive pertinent information and knowledge on the chemical and biological activities of molecules from their structure before the planning of experiments. Density functional theory (DFT) is the most common and widely used quantum chemical method to investigate the electronic structure, geometry, and chemical reactivity of the compound. In this study, DFT calculations have been carried out on the geometry of the chosen twenty three molecules using the Gaussian 09 package [27] at the B3LYP/6-31G (d) level in the gas phase. Optimization followed by frequency calculations is performed on the structures to confirm their ground state stability as evidenced by the absence of the imaginary frequencies. To gain a better understanding of the chemical reactivity and stability, frontier molecular orbital (FMO) and electrostatic potential (ESP) analyses are performed.
ADMET analysis
The drug-likeness and ADMET (absorption, distribution, metabolism, excretion, and toxicity) parameters play an important role in determining the efficiency of the drug in the body. QikProp module of the Schrödinger suite has been used to evaluate the pharmacokinetic properties of the compounds under this study [28] in which, the properties like solubility (QPlogp octanol/water), gastrointestinal (GI) absorption, blood–brain barrier penetration, and Lipinski rule of five violations are also analyzed. Toxicity studies have been performed using the Protox-II online tool [29] which provides information about carcinogenicity, immunotoxicity, mutagenicity, and cytotoxicity associated with the compounds. This fundamental analysis would aid to prevent the failure of appropraiate action of the compound during the clinical study and aids in the development of future drugs.
Molecular docking
Molecular docking studies play a vital role in understanding how these molecules interact with proteins in contemporary drug design and development [30]. The X-ray crystal structure of the SARS-CoV-2 main protease enzyme with N3 inhibitor is obtained from the protein data bank (PDB ID:6LU7) [31]. The molecular docking was performed using Maestro to predict the binding modes against the SARS-CoV-2 Mpro pocket [32]. Protein preparation wizard of Schrödinger suite of the program is used to prepare the protein for molecular docking. Then, Glide’s receptor grid generation was used to generate a grid with a maximal size of 20 × 20 × 20 Å and 0.5 Å spacing. CovDock module [33] of the Schrodinger software suite was used for covalent docking. Cys145 was selected as the reactive residue in the receptor to check all the reaction types and Michael addition reaction was chosen based on the possible reaction sites. Docking scores were calculated and the pose with the lowest energy was preferred. The results of the docking were analyzed using the maestro. The top three docking portions were chosen for MD analysis.
Molecular dynamics simulation
All the simulations have been performed with the OPLS-AA force field by using the academic version of the MD simulation package-Desmond (Desmond, 2022) [34]. Desmond employs the midpoint method to efficiently exploit a high degree of computational parallelism. MD simulation intends to analyze the main protease deviations in an inhibitor-bound form for the top three ligand molecules and has simulated the system for 100 ns of timescale. Initially, the system was prepared by a system build panel and the system was solvated in an orthorhombic box filled with water molecules and neutralized with appropriate number of counter-ions. Overlapping water molecules were deleted in these systems and neutralized with Na+ ions. Heavy atom bond lengths with hydrogen and the internal geometry of water molecules are constrained using the SHAKE algorithm [35] and for nonbonded interactions, the periodic boundary condition is maintained at a 9.0 Å cut-off. The system is subjected to local energy minimization using the hybrid method of the steepest descent and the limited memory Broyden Fletcher Goldfarb Shanno (LBFGS) algorithms [36] with a maximum of 5000 steps until a gradient threshold (25 kcal/mol/ Å) is reached. The system was relaxed with the constant NPT (number of atoms N, pressure P, temperature T) ensemble condition to generate simulation data for the post-simulation analyses. A constant temperature of 300 K is defined for the whole simulation process with the Nose–hoover thermostats, and stable atmospheric pressure (1 atm) is carried out by Martina–Tobias–Klein barostat method [37, 38]. The long-range electrostatic interactions are evaluated by using Particle Mesh Ewald (PME) method [39] with the simulation process using periodic boundary conditions (PBC) [40]. The final production MD was carried out for 100 ns for all systems and the results were analyzed using a simulation interactions diagram.
Results and discussion
The 2-pyridone derivatives considered for this present work are enlisted in Table 1. Throughout this study, 2-pyridone derivatives are used, and the molecules are designated as P1, P2, P3…, and P23 (Supporting Information Fig. 1).
Structural analysis
The 2-pyridone derivatives (P1-P23) have been optimized at the B3LYP/6-31G (d) level. Figure 2 represents the optimized structures of different derivatives of 2-pyridone substituted at different positions. In general, 2-pyridone compounds are planar, but the planarity of the molecule is distorted when certain alkyl group substitution has been done in the ring. In referring to the compound P1, there is an alkyl group substitution in the 6th position of the 2-pyridone ring, though the alkyl group gets substituted in the 6th position, their dihedral angle between the parent ring and alkyl group get differs only by 20 showing a close proximity with that of planar symmetry. Compounds P2, P3, P8, P16, P17, P18, P19, and P20 have a substitution of the alkyl group directly on the nitrogen (N) atom of the 2-pyridone ring resulting in the slight deviation in their dihedral angle and thereby attaining non-Planar geometry. Compound P6 has 4 substitutions on the 2-pyridone ring: they are an alkyl group, a halogen atom, alcohol, and aldehyde. Apart from the alkyl group, the attachment of the other three substitutions does not disturb the planarity of the compound but this parameter is not maintained when the alkyl group gets substituted. The planarity of the molecule gets reduced immediately by 690 thereby the optimized structure gives an image of twisted geometry. P8 exhibits the same characteristics as compound P6. The substitution of the alkyl group on the parent ring of the compound P8 reduces the dihedral angle and thereby displays a twisted geometry. Compounds P9, P10, P21, P22, and P23 are fused ring heterocyclic compounds having an alkyl substitution on the parent ring. Alike compound P1, all the mentioned fused heterocyclic ring compound systems exist in planar symmetry, and their distortion is inconsiderable. On comparing the compounds P11 and P12, they exhibit very similar structures and differ only by the methyl group attached to the pyridone unit of the parent ring. Their optimized structure has planar geometry. Compounds P16 and P17 resemble the same in structure. They are distinguished from each other only by the addition of the tert-butyloxycarbonyl group (BOC). Compounds P21, P22, and P23 are the next set of fused heterocyclic ring compound systems possessing the same structure.
Fig. 2.

Optimized geometry of 2-pyridone derivative at B3LYP/6-31 g(d) level
Frontier molecular orbitals
Frontier molecular orbitals (FMOs) of molecules are commonly used to estimate the chemical reactivity and the kinetic stability of the molecule [41, 42]. It is exemplified as a function of the interaction between the HOMO (highest occupied molecular orbital) and LUMO (lowest unoccupied molecular orbital) level of the reacting species [41]. The energy difference between the HOMO and LUMO orbitals is referred to as the “HOMO-LUMO gap”. It is well known that the lower the HOMO-LUMO gap, the higher the chemical reactivity and lesser the stability; and vice-versa [43, 44]. In Fig. 3, FMO energies are depicted with their corresponding HOMO-LUMO gap. The HOMO-LUMO gap lies in the range of 1.80–5.60eV. The HOMOs are observed in the range of −0.93 to −2.48 eV whereas the LUMOs are in the range of −3.56 to −7.36 eV. Among all the 23 compounds, the energy gap of P18 is found to be maximum and the minimum is obtained for P17. The HOMO–LUMO gap increases in the following order P17 < P21 < P23 < P22 < P14 < P13 < P11 < P19 < P9 < P12 < P6 < P5 < P3 < P7 < P8 < P4 < P16 < P2 < P20 < P1 < P10 < P15 < P18. The FMOs of all 23 molecules are given in Fig. 4. In the molecules P1, P2, P3, P4, P6, P9, P10, P11, P12, P13, P17, P18, P19, P20, P21, P22, and P23, the HOMO and LUMO are localized on both the 2-pyridone moiety and substituent.
Fig. 3.
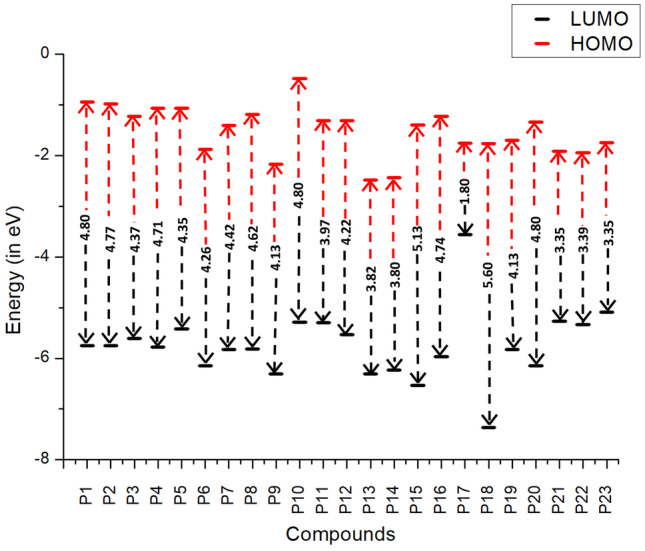
Computed HOMO, LUMO, and HOMO–LUMO energy gap (eV) of twenty-three 2-pyridone derivatives
Fig. 4.

Frontier molecular orbitals (HOMO and LUMO) of 2-pyridone derivatives obtained from DFT calculations
In the molecules P5, P7, P8, P14, P15, and P16, the HOMOs are localized uniformly over the entire molecule, but in the case of LUMO, the delocalization occurs predominantly over the substitutions. Among 23 molecules, P21, P22, and P23 differ only in the poly-heterocyclic ring substitution over the dihydrothiazolo ring fused to pyridone central fragment and thus they tend to show similar HOMO-LUMO gap (3.35eV, 3.39eV, and 3.35eV). Though the molecules P16 and P17 are structurally similar, the addition of tertiary-butyloxycarbonyl (BOC) group in the P17 molecule leads to a reduction in the HOMO-LUMO gap (1.80eV) when compared to that of P16 molecule (4.74eV). The P18 molecule has the highest HOMO-LUMO gap with 5.60eV. This can be due to the substitution of phenol, benzonitrile, and pyridine at 1st, 3rd, and 5th positions respectively. This shows that P18 will have less chemical reactivity and more stability. On the other hand, P21 and P23 are found to have the lowest HOMO-LUMO gap (3.35eV) and expected to show high chemical reactivity.
Molecular electrostatic potential
In drug design process, the first important step is to locate where the drug molecule goes and binds into the active site of the protein. This binding is essential, especially for inhibitors where the competitive binding of the inhibitor is controlling the biological process. It is widely assumed that the molecular recognition between protein and ligand molecules happens at their surface. The strength of the binding forces in the protein–ligand complex is determined by two factors: electrical distribution and the shape of the ligand’s surface [45, 46]. These factors can be anticipated from the molecular electrostatic potential surface of molecules. This is done by computing the Wang–Ford charges of all atoms of the optimized geometry. The chemical reactivity, electronegativity, and dipole moment of a molecule are frequently assessed using molecular electrostatic potential (MEP) surfaces [47–49]. MEP analysis is often helpful in understanding the interaction of a drug with its surroundings in the active site. Therefore, MEP analysis is done on all the optimized geometries (Fig. 5) and the ESP distribution is shown in red for more electron-rich areas with negative potential, blue for electron-deficient parts with a positive potential, and green for neutral with zero potential value. The MEP of the compounds P1 to P5, P12, P17, P21, P22, and P23 shows that these molecules are capable of forming at least one hydrogen bond (red patches) during the protein binding. Similarly, the compounds P6, P7, P8, P10, P11, P13, P14, P18, and P19 tend to show at least two or three hydrogen bonding interactions with the protein molecule. The electron-poor region lies mostly in the substituent molecules region. For instance, in the compound P7, the phenyl ring attached to the 2-pyridone parent moiety via sulfur atom is represented in the blue region, the oxygen part of 2-pyridone is bearing red region, and the remaining part of the compound is represented in green color indicating their neutral part. It is also to note that, MEPs are not symmetrically distributed across the molecule due to their non-planar geometry. The green and white patches on the molecule refer to their neutral and absence of ESP. The above-mentioned information sheds light on the potential interactive site of the molecule to the protein.
Fig. 5.

Molecular electrostatic positional (MEP) diagram of the twenty-three 2-pyridone derivatives
Global descriptors
DFT-derived global descriptors provide useful and insightful information on the molecule level reactivities and therefore the same has been calculated for all the compounds [45]. In Table 2, FMOs can be used to evaluate the global descriptors of organic molecules. According to Koopmans’ theorem [50, 51], Egap = (E(LUMO) − E(HOMO)) and the energy of HOMO are related to ionization potential (I), whereas the energy of LUMO is related to the electron affinity (A) of the molecule. The HOMO–LUMO energies are used to determine global reactivity characteristics such as chemical potential (μ), electronegativity (χ), hardness (η), softness (S), and electrophilicity index (ω) [52–54]. The following equations are used to calculate these quantum chemical descriptors.
Table 1.
2-pyridone derivatives with different substitution


It is commonly understood that the higher the ionization potential, the greater the energy required to remove an electron from the HOMO. A low value of electron affinity reflects how easily electrons can be extracted from a molecule. A molecule with a high electronegativity actively draws electrons from donor moieties [55, 56]. Chemical potential (μ) is a measurement of a molecule’s reactivity and stability. It refers to a molecule’s inability to simply disintegrate into its constituents. A molecule with a negative chemical potential is said to be more stable [55]. Furthermore, the chemical hardness and softness of the molecule determine its polarizability. A higher hardness and a lower softness confirm the molecules’ less polarisable nature. The ionization potential of P10 tends to show the lowest value of 0.48 eV. This shows that an electron can be knocked out of the P10 compound easily when compared to other compounds. Similarly, the electron affinity of P10 is the lowest at 5.29 eV among all the compounds suggesting that the compound has an increased possibility of undergoing substitution at the electrophilic site.
Physicochemical and drug likeness
Drug likeness assessment for the lead compounds (P1–P23) is evaluated on their physicochemical properties based on the Lipinski rule (Table 3). According to the rule, an orally active drug must possess a molecular weight ≤ 500 Dalton, log value ≤ 5, number of HBDs ≤ 5, number of HBAs ≤ 10, no more than 10 rotatable bonds, and a topological polar surface area (TPSA) within 140Å2 in order to traverse the cell membrane. The molecular weight of a substance and its absorption is always intrinsically linked. The higher the molecular weight, the lower the permeation rate in the lipid bilayer. Compounds with lower molecular weight are mostly inferred for oral activity. All the compounds have a molecular weight of less than 500 Dalton, indicating their good absorption capability. The total number of hydrogen bond donors and acceptors does not exceed the maximum (in a range of 0–6 and 2–20 respectively) and is found to be within the acceptable limit. Molecule’s lipophilicity (log P) values are also within the limit showing a good transport process. The descriptor used to calculate the aqueous solubility (log S), with a normal range of − 6.5 to 0.5 for 95% of drugs is acceptable except for the compounds P11, P12, P13, and P10.
Table 2.
HOMO LUMO energies and the global parameters computed for the 2-pyridone derivatives
| HOMO | LUMO | H–L gap (eV) | I (eV) | A (eV) | Μ | χ | η | S | ω | |
|---|---|---|---|---|---|---|---|---|---|---|
| P1 | − 0.939 | − 5.745 | 4.806 | 0.939 | 5.745 | − 3.342 | 3.342 | 2.403 | 0.208 | 2.324 |
| P2 | − 0.977 | − 5.750 | 4.773 | 0.977 | 5.750 | − 3.364 | 3.364 | 2.386 | 0.209 | 2.370 |
| P3 | − 1.230 | − 5.608 | 4.378 | 1.230 | 5.608 | − 3.419 | 3.419 | 2.189 | 0.228 | 2.670 |
| P4 | − 1.062 | − 5.780 | 4.718 | 1.062 | 5.780 | − 3.421 | 3.421 | 2.359 | 0.211 | 2.480 |
| P5 | − 1.066 | − 5.418 | 4.351 | 1.066 | 5.418 | − 3.242 | 3.242 | 2.175 | 0.229 | 2.415 |
| P6 | − 1.881 | − 6.150 | 4.268 | 1.881 | 6.150 | − 4.015 | 4.015 | 2.134 | 0.234 | 3.778 |
| P7 | − 1.404 | − 5.825 | 4.420 | 1.404 | 5.825 | − 3.614 | 3.614 | 2.210 | 0.226 | 2.956 |
| P8 | − 1.185 | − 5.811 | 4.625 | 1.185 | 5.811 | − 3.498 | 3.498 | 2.312 | 0.216 | 2.645 |
| P9 | − 2.173 | − 6.306 | 4.133 | 2.173 | 6.306 | − 4.240 | 4.240 | 2.066 | 0.241 | 4.35 |
| P10 | − 0.482 | − 5.290 | 4.807 | 0.482 | 5.290 | − 2.886 | 2.886 | 2.403 | 0.207 | 1.733 |
| P11 | − 1.314 | − 5.291 | 3.977 | 1.314 | 5.291 | − 3.302 | 3.302 | 1.988 | 0.251 | 2.742 |
| P12 | − 1.306 | − 5.528 | 4.221 | 1.306 | 5.528 | − 3.417 | 3.417 | 2.110 | 0.236 | 2.766 |
| P13 | − 2.481 | − 6.302 | 3.820 | 2.481 | 6.302 | − 4.391 | 4.391 | 1.910 | 0.261 | 5.049 |
| P14 | − 2.432 | − 6.233 | 3.801 | 2.432 | 6.233 | − 4.332 | 4.332 | 1.900 | 0.2630 | 4.938 |
| P15 | − 1.400 | − 6.532 | 5.132 | 1.400 | 6.532 | − 3.966 | 3.966 | 2.566 | 0.194 | 3.065 |
| P16 | − 1.222 | − 5.964 | 4.742 | 1.222 | 5.964 | − 3.593 | 3.593 | 2.371 | 0.210 | − 2.722 |
| P17 | − 1.754 | − 3.562 | 1.801 | 1.754 | 3.562 | − 2.658 | 2.658 | 0.904 | 0.553 | − 3.907 |
| P18 | − 1.765 | − 7.366 | 5.600 | 1.765 | 7.366 | − 4.565 | 4.565 | 2.800 | 0.178 | − 3.721 |
| P19 | − 1.697 | − 5.827 | 4.130 | 1.697 | 5.827 | − 3.762 | 3.762 | 2.065 | 0.242 | − 3.428 |
| P20 | − 1.344 | − 6.144 | 4.800 | 1.344 | 6.144 | − 3.744 | 3.744 | 2.400 | 0.208 | − 2.920 |
| P21 | − 1.914 | − 5.265 | 3.350 | 1.914 | 5.2650 | − 3.589 | 3.589 | 1.675 | 0.298 | − 3.846 |
| P22 | − 1.943 | − 5.334 | 3.391 | 1.943 | 5.334 | − 3.638 | 3.638 | 1.695 | 0.294 | − 3.904 |
| P23 | − 1.741 | − 5.092 | 3.350 | 1.741 | 5.092 | − 3.417 | 3.417 | 1.675 | 0.298 | 3.901 |
The blood–brain barrier coefficients (log BB), a predictor for access to the central nervous system, which is acceptable within a range of 3.0 to 1.2, are found to be satisfactory. Apparently, Caco-2 membrane permeability (in Boehringer scale, nm/s) is < 25 poor and > 500 great (Schrodinger software release 2015–2). Except for P10, P11, and P13, all the other compounds are found to be good, among which the compounds P1, P2, P3, P4, P8, P16, P17, P19, and P20 showed a higher permeability index. Apart from these descriptors, the toxicity properties, namely immunotoxicity, cytotoxicity, mutagenicity, and carcinogenicity, are found to be inactive for all the compounds.
Studies on Mpro-ligand interactions
Mpro, the main protease of coronavirus, plays a vital role in viral gene expression and replication and thus is considered an effective target for the development of drugs against coronavirus infections. The 3D structure of Mpro is composed of three domains, namely the chymotrypsin-like domain (domain I: residues 10–99), the picornavirus 3C protease-like domain (domain II: residues 100–182), a third domain (domain III: residues 201–303), and a long loop region (residues 185–200) that connects domains II and III [57–59]. The substrate-binding pocket lies in the cleft between domains I and II and features the catalytic dyad residues Cys145 and His41. Domains I and II form six-stranded antiparallel β barrels that harbor the substrate-binding site between them and domain III is involved in the regulation of Mpro dimerization, mainly through a salt-bridge interaction between Glu290 of one protomer and Arg4 of the other [57].
According to Zheng et al. [60] the catalytic active site is located within the pocket between domains I and II of SARS CoV Mpro that contains the following amino acids; Cys22, Gly23, Thr24, Thr25, Leu27, His41, Val42, Cys44, Thr45, Ala46, Glu47, Asp48, Met49, Leu50, Asn51, Pro52, Tyr54, Cys145, His164, Met165, Asp187, Arg188, and Gln189. Active site residues from our grid calculations are also shared by the residues of domains I and II involving the residues His41, Met49, Asp 187, Agr188, Gln189, Thr190, Gln192, Leu167, Glu166, Met165, and His164. Among the 23 compounds, around 20 compounds showed good interactions with the target based on the glide score. The results of the docking procedure including the glide score, energy, and the details of hydrogen bonding are shown in Table 4. Binding conformations of the compounds were selected carefully as per glide score, energy, and the number of hydrogen bonds they formed. The compounds bound to the substrate-binding pocket are located in a cleft between domain I and domain II as shown in (Supporting Information Fig. 2). The glide scores of the chosen pyridone derivatives range from − 7.317 to − 4.767 kcal/mol.
Table 3.
In silico ADMET prediction of the 2-pyridone compounds. The normal range for each descriptor is given in brackets
| Compounds | Molecular weight (130–725) | H-bond donor (0–6) | H-bond acceptor (2–20) | QPlogP (o/w) (− 2.0–6.5) | QPlogS (− 6.5 to 0.5) | Lipinski rule of 5 violations (Max. is 4) | % Human oral absorption (< 25% is poor) |
|---|---|---|---|---|---|---|---|
| P1 | 157.25 | 2 | 3 | 1.00 | − 0.73 | 0 | 83 |
| P2 | 171.28 | 1 | 3 | 1.51 | − 1.03 | 0 | 91 |
| P3 | 197.32 | 1 | 3 | 1.73 | − 1.82 | 0 | 91 |
| P4 | 227.34 | 1 | 4 | 1.78 | − 1.82 | 0 | 90 |
| P5 | 213.31 | 2 | 4 | 1.02 | − 1.53 | 0 | 81 |
| P6 | 263.76 | 4 | 6 | 0.31 | − 1.03 | 0 | 71 |
| P7 | 286.47 | 4 | 4 | 1.52 | − 1.04 | 0 | 72 |
| P8 | 352.26 | 1 | 8 | 1.21 | − 1.36 | 0 | 90 |
| P9 | 287.41 | 5 | 6 | − 0.58 | 0.69 | 0 | 43 |
| P10 | 172.23 | 6 | 6 | − 3.09 | 2.00 | 1 | 6 |
| P11 | 240.34 | 6 | 6 | − 2.04 | 2.00 | 1 | 12 |
| P12 | 254.37 | 5 | 6 | − 1.38 | 1.94 | 0 | 37 |
| P13 | 314.48 | 6 | 6 | − 0.96 | 1.81 | 1 | 22 |
| P14 | 329.91 | 5 | 5 | 0.75 | − 0.88 | 0 | 48 |
| P15 | 445.45 | 1 | 8 | 2.78 | − 2.75 | 0 | 87 |
| P16 | 387.55 | 3 | 8 | 2.65 | − 2.46 | 0 | 91 |
| P17 | 297.43 | 1 | 6 | 2.46 | − 2.26 | 0 | 97 |
| P18 | 377.61 | 4 | 6 | 2.20 | − 1.95 | 0 | 67 |
| P19 | 377.60 | 4 | 2 | 4.32 | − 5.04 | 0 | 100 |
| P20 | 257.37 | 2 | 7 | 0.95 | − 1.03 | 0 | 81 |
| P21 | 408.59 | 4 | 9 | 1.12 | − 2.29 | 0 | 60 |
| P22 | 412.60 | 4 | 9 | 0.85 | − 1.94 | 0 | 61 |
| P23 | 395.55 | 5 | 10 | − 0.55 | 0.24 | 0 | 40 |
Out of the selected twenty three 2-pyridone derivatives, twenty-two showed good interaction (< − 5.00 kcal/mol) based on glide score with the target. Compounds P13, P18, P11, P14, P19, P7, and P12 shared a glide score < − 6.00 kcal/mol and among which P18, P11, and P12 (Fig. 6) were chosen further for molecular dynamics simulations, considering the score, energy, and hydrogen bonds. Several studies reported Gly143 as the most important residue participating in a hydrogen bond with the ligand, followed by Glu166, Cys145, and His163 (Nguyen et al., 2020). Additionally, from Table 4, it is clear that these residues play an important role in binding with pyridone derivatives too. It was also observed that the compounds P6 and P14 showed a halogen bond (with their chlorine atom) with the residues Glu166 and Cys145 respectively apart from the hydrogen bonded interaction. The compounds P18, P11, P16, and P10 interact with at least 1 residue (Cys145 or His41) of the catalytic dyad, specifying the capability of these compounds to interrupt with the catalytic dyad. Also, it was noted that all the compounds showed either hydrophobic or polar interactions with the residues. Dimerization of the enzyme (Mpro), essential for its catalytic activity, requires the involvement of Glu166 (Goyal and Goyal, 2020). The key residue, Glu166, was shown to be actively involved in H-bond formation with the compounds P12, P13, P7, and P20.
Fig. 6.

A 3D view of the binding conformations of P11, P12, and P18 with the highest binding energy at the active site of the protein. B The 2D representation of the interactions of P11, P12, and P13 with the active site residues
Compound P13 showed the least score of − 7.317 kcal/mol possessing a single hydrogen bond, with the residue Glu166. Glu166, the key residue necessary for keeping the binding pocket in the correct shape and the enzyme inactive conformation [61], is firmly bound to the ligand.
The compound P18 showed a score of − 7.291 kcal/mol possessing two hydrogen bonds. The nitrogen atom of the benzonitrile group donates a hydrogen atom to the Cys145 residue of Mpro. Similarly, another hydrogen bond was shared by Gly143. P11 forms 3 hydrogen bonds involving the residues Cys145, Gly143, and Gln189. Similarly, P12 occupies three hydrogen bonds with the residues Glu166, Leu141, and Gly143. The 3D and 2D interaction plots of all the complexes are shown in the Supporting Information Fig. 3.
Covalent docking
Covalent inhibitors have a tremendous history in the field of drug discovery, starting from the approval of aspirin to the existing kinase inhibitors enrolling in clinical trials [62]. As the active site contains Cys145, it is possible to have covalent bond formation during the inhibition process. Being curious in finding whether the chosen compounds have the potency to act as a covalent inhibitor, covalent docking was performed for the top 15 compounds (based on the molecular docking) as shown in Table 5. Fortunately, most of the compounds showed good scores and binding affinity (MMGBSA score) in forming irreversible interactions and were assessed further on their potency to act as a covalent inhibitor.
Table 4.
The binding energy, glide score, number of hydrogen bonding, and the key interacting residues obtained from molecular docking analysis in comparison with remdesivir, ribavirin, and favipiravir
| Compound | Glide score | Energy (kcal/mol) | No. of H-bonds | Interacting residues |
|---|---|---|---|---|
| P13 | − 7.317 | − 56.805 | 1 | Glu166 |
| P18 | − 7.291 | − 71.387 | 2 | Cys145, Gly143 |
| P11 | − 6.628 | − 47.165 | 3 | Cys145, Gly143, Gln189 |
| P14 | − 6.546 | − 58.184 | 1 | Glu166 |
| P19 | − 6.274 | − 60.800 | 0 | - |
| P12 | − 6.130 | − 56.509 | 3 | Gly143, Gly141, Glu166 |
| P7 | − 6.100 | − 52.130 | 1 | Glu166 |
| P4 | − 5.919 | − 44.205 | 1 | Gly143 |
| P20 | − 5.827 | − 47.642 | 2 | Glu166, Gly143 |
| P9 | − 5.563 | − 45.744 | 0 | - |
| P3 | − 5.504 | − 38.068 | 0 | - |
| P16 | − 5.475 | − 55.428 | 2 | His41, Gly143 |
| P21 | − 5.414 | − 49.959 | 1 | Gly143 |
| P15 | − 5.359 | − 54.271 | 0 | - |
| P23 | − 5.301 | − 47.811 | 1 | Gly143 |
| P10 | − 5.592 | − 31.932 | 2 | Cys145, Gln189 |
| P1 | − 5.265 | − 31.754 | 1 | His164 |
| P5 | − 5.220 | − 39.177 | 0 | - |
| P22 | − 5.196 | − 49.074 | 1 | Gly143 |
| P8 | − 5.175 | − 44.647 | 0 | - |
| P17 | − 5.170 | − 47.133 | 1 | Gly143 |
| P6 | − 5.021 | − 36.902 | 1 | Gly143 |
| P2 | − 4.767 | − 27.189 | 0 | - |
| Remdesivir | − 7.23 | − 79.157 | 3 | Thr190, Gln189, Gly143 |
| Ribavirin | − 5.545 | − 47.008 | 3 | Thr190, Glu166, His164 |
| Favipiravir | − 3.649 | − 26.823 | 2 | Thr26, Gly143 |
All the compounds were found to possess nucleophilic addition to a double bond (having the SMARTS pattern [C,c] = [0,s] with the target protein. The covalent docking score for the compounds ranged between − 6.398 and − 3.988 kcal/mol and the docking scores and the details of the hydrogen bond apart from the irreversible bond are depicted in Table 5. It was observed that all the chosen compounds showed at least a hydrogen bond in addition to the covalent bond, thus increasing the strength of interaction. The compounds P18, P19, P4, P16, and P21 were found to have hydrogen bonded interaction with the same residues Gly143 and Cys145. Moreover, the reactive residue Cys145 interacts with most of the compounds except in P9 and P23 with an additional hydrogen bond, suggesting its importance in ligand binding by having the capability to form both reversible and irreversible interactions. Based on the score, compounds P18 and P16 were assessed for their stability and are detailed further. The 3D and 2D interaction plot of all the complexes are shown in the Supporting Information Fig. 4.
Table 5.
Interaction details from covalent docking of the selected compounds
| Compound | Docking score (kcal/mol) | MMGBSA score (kcal/mol) | No. of H-bonds | Interacting residues |
|---|---|---|---|---|
| P13 | − 5.483 | − 56.32 | 2 | Cys145, Ser144 |
| P18 | − 6.297 | − 64.73 | 2 | Gly143, Cys145 |
| P11 | − 3.971 | − 45.15 | 2 | Cys145, Leu141 |
| P14 | − 5.645 | − 52.64 | 1 | Cys145 |
| P19 | − 5.960 | − 53.26 | 2 | Cys145, Gly143 |
| P12 | − 4.524 | − 49.12 | 1 | Cys145 |
| P7 | − 4.081 | − 50.23 | 1 | Cys145 |
| P4 | − 5.505 | − 56.32 | 2 | Gly143, Cys145 |
| P20 | − 5.747 | − 57.51 | 1 | Cys145 |
| P9 | − 4.471 | − 49.35 | 1 | Gln189 |
| P3 | − 4.371 | − 48.64 | 2 | Leu141, Cys145 |
| P16 | − 6.398 | − 62.29 | 3 | Cys145, Gly143, His41 |
| P21 | − 3.988 | − 42.29 | 2 | Gly143, Cys145 |
| P15 | − 5.402 | − 52.33 | 3 | Leu141, Cys145, His41 |
| P23 | − 5.636 | − 49.67 | 1 | Gly143 |
Compound P18 showed covalent bonding with the residue Cys145 of target Mpro, possessing a docking score of − 6.297. The sulfur atom of the reactive residue Cys145 and the covalent carbon of the compound was separated by a distance of 1.81 Å. In addition to this, the ligand P18 also possesses two hydrogen bonds (with Cys145 and Gly143) as shown in Fig. 7, thus suggesting its efficacy to act as a covalent inhibitor against Mpro. Also, as evident from the HOMO–LUMO gap, compound P18 is more stable than the other complexes. The compound P16 also has the ability to form a covalent bond with the nucleophilic thiol of Mpro at a distance of 1.85 Å. Possessing the top docking score, compound P16 holds three hydrogen bonded interactions involving the residues Cys145, Gly143, and His41, apart from covalent bonding (Fig. 8). Interestingly, this showed hydrogen bonding and salt bridge with both the residues of catalytic dyads Cys145 and His41 respectively.
Fig. 7.

Schematic representation of covalent interaction made by P18. A Mpro-P18 interaction by the formation of covalent bonds. The covalent bond is represented as a yellow bond inside the blue dotted circle. Pink labels represent the H-bond distance. B 2D plot of interaction. As in the figure, 2 hydrogen bonds were formed apart from the covalent bond
Fig. 8.

Schematic representation of covalent interaction made by P16. A Mpro-P16 interaction by the formation of covalent bonds. The covalent bond is represented as a yellow bond inside the blue dotted circle. Pink labels represent the H-bond distance. B 2D plot of interaction. As in the figure, 2 hydrogen bonds were formed apart from the covalent bond
Molecular dynamics simulation studies
To gain insights into the stability and dynamic properties of the complexes, a 100 ns simulation was carried out in a water model and the stability and interaction properties of the top four complexes were assessed during the MD simulation and the root mean square deviation (RMSD) of Cα atoms and the root mean square fluctuations (RMSFs) were analyzed. RMSD is a measure describing the average change in displacement of an atom in a specific conformation against a reference conformation [63]. RMSD of the protein is monitored as it gives insights into the conformation of Mpro upon binding of the compounds throughout the simulation. This is essential to quantify the structural stability of the docked complexes. For the RMSD calculations, the Cα atoms of the protein backbone in addition to the atoms of the ligand molecules except the hydrogen atoms were considered in the post dynamics analysis (Fig. 9).
Fig. 9.

RMSD plot for the complexes A Mpro-P12, B Mpro-P18, C Mpro-P11, D Covdocked Mpro-P16, and E Covdocked Mpro-P18. The blue color represents the evolution of backbone Cα atoms of the protein, whereas red indicates the compound’s heavy atoms
Based on the MD results of XP docked complexes, P12 showed increased deviation than P18 and P11. Even though P18 and P11 show less fluctuation after 30 ns and 15 ns respectively, the difference in deviation is found to be a little high than the normal acceptable range (1–3 Å). In the Mpro-P18 complex (Fig. 9B), Mpro undergoes a conformational change and is found to be stable after 80 ns. However, the deviation is found to be minimal (~ 1.8 Å). A sudden increase in RMSD was observed around 65 ns and then found to be stable throughout the course of the simulation. Comparatively, covdocked P18 (Fig. 9E) was found to possess a minimum deviation from the XP docked complex. But the RMSD of the complexes was higher. In the case of the P16-Mpro complex, a sudden increase in RMSD was observed around 40 ns and then gradually decreased to around 1.2 Å for a few nanoseconds and continue to be stable throughout. Based on the results from XP and covalent docked complexes, covalent docked compounds were found to be more stable than the XP docked ones. In particular, P18 (Fig. 9E) was found to be more stable than the other complexes, which is also evident from the energy gap, as it has a maximum HOMO–LUMO gap, concerning its increased stability.
RMSF is the standard measure of the deviation of the particle from its original position. The RMSF plot is used to visualize the local changes or the flexibility in residues along with the protein, in which the peak shows which region of the protein fluctuates most during simulation, while lower RMSF indicates minimal conformational change. RMSF of the target protein Mpro is calculated from the complexes and is plotted in Fig. 10, which showed no major fluctuations in Mpro upon ligand binding. The regions occupying the α-helices and β-sheets are usually more rigid and fluctuate less. In the case of P12 and P18, almost all the residue fluctuations fell below 2.5 Å, whereas in P11, some residues crossed above 2.5 Å with a maximum fluctuation of 3.5 Å.
Fig. 10.

RMSF Plot of the protein in different complexes. A Mpro-P12, B Mpro-P18, C Mpro-P11, D Covdocked Mpro-P16, and E Covdocked Mpro-P18. The green vertical lines show the residues interacting with the ligand
Secondary structural features like α-helices and β-sheets are monitored and shown in Fig. 11, which shows the distribution of secondary structural elements by the residue index throughout the 100 ns simulation. Except in P11, which shows a reduction in the α-helical region, around 40% of the residues in all the other complexes are shared by α-helices and β-sheets during simulation.
Fig. 11.

Secondary structural elements of Mpro in various complexes A Mpro−P12, B Mpro-P18, C Mpro-P11, D Covdocked Mpro-P16, and E Covdocked Mpro-P18. α-helix is shown in blue and brown shows the β-strands
Hydrogen bonding plays a key role in ligand binding and is important due to its strong influence on drug specificity, metabolism, and absorption. Mpro-P18, Mpro-P12, and Mpro-P11 and covalent docked Mpro-P18 and Mpro-P16 interactions were monitored throughout the simulation time and the results of covdocked complexes are plotted in Supporting Information Fig. 5. As the cov-docked complexes were found to be more stable, they have been discussed further. For the covalent bound complexes, both the compounds showed an additional hydrogen bonding with Ser144 during simulation and P18 showed another hydrogen bond with Glu166 in a few frames. No hydrogen bonds formed during docking calculations were lost and they were also observed to persist throughout the majority of the simulation time. Apart from that, hydrophobic interactions and water bridges were observed. The residues Gly143 and Cys145 retained the hydrogen-bonded interaction for more than 95% of the simulation time with Covdocked P18. Similarly, in P16, Gly143 lasts more than 95%, whereas Cys145 was found to persist around 80% of the simulation time, which might attribute to the deviation in RMSD of the compound comparable with P18.
Hydrogen bonding interactions between the protein and the ligands were calculated within the simulation trajectory and were found to have strong interactions within the active site of the target. Also, it has shown hydrogen bonds even in the dynamic state with the ligand being perfectly placed inside the binding pocket. RMSF of the compounds in covalent docked complexes, broken down by atom, is shown in Supporting Information Fig. 6. This shows the flexibility of the regions 13 to 18 and 17 to 19 in P16 and P18, respectively. These regions were exposed at the surface, whereas the other regions are found deep inside the binding cavity.
Conclusions and future perspective
In the present work, an attempt has been made to identify a potential synthetic 2-pyridone derivative out of twenty-three molecules against SARS-CoV-2 main protease using computational techniques such as DFT calculations, molecular docking, and molecular dynamics. DFT studies imply that P6 has the highest dipole moment while P17 is found to be chemically very active with lowest HOMO–LUMO gap. Out of 23 molecules screened, twenty are found to be non-planar. The computed ADMET properties indicate that almost all the compounds obey the Lipinski rule while molecular docking study shows that compounds P18, P12, P11, and P16 are having greater affinity over the main protease. We also estimate the potency of the compounds P16 and P18 to act as covalent inhibitors. The interaction and stability of these molecules inside the binding pocket have been validated by 100 ns of MD simulations. Moreover, the ease in the synthesis of these compounds over the natural products, in particular, the 2-pyridone-based compounds is the need of the hour. Hence, we believe that these compounds could become pharmaceutically important in the near future to possibly treat COVID-19 upon completing further clinical studies.
The sudden outbreak of COVID-19 demands scientists to work together collaboratively performing interdisciplinary research by looking at the problem from different dimensions to deal with this deadly virus. In this context, computer-aided drug designing is an inevitable tool in helping us to understand the mechanism of action of drugs. One should remember that COVID-19 has the capacity to bring about mutant variants that hampers the drug discovery process. In order to expedite the progress of COVID-19 drug discovery, repurposing of known and clinically approved drugs is an attractive option compared to the traditional time-consuming drug discovery techniques. Of course, these computational screening experiments require further clinical studies (in-vitro and in-vivo techniques) considering the COVID-19 virus. Apart from repurposing known drugs, the development of antibodies against COVID-19 proteins can also be an option to explore. QSAR studies will help us to narrow down our search for potential drugs and we cannot ignore advanced techniques like machine learning, deep learning, and artificial intelligence in the current drug discovery domain. Thus, we feel that computational drug design is ever growing field and efforts in developing efficient drugs using technological developments will advance our steps in safeguarding humankind from deadly diseases.
Acknowledgements
Joseph George Samuel of 3rd B.Sc. Chemistry, Madras Christian College has done this work as part of his internship at DST-FIST Sponsored Professor Edward Barnes Computational and Instrumental Facility (PEBCIF) of the Department of Chemistry, MCC during 2021–2022. The authors profusely thank Dr. M. Aulice Scibioh, Department of Chemistry, MCC for the valuable inputs and scientific discussions in improving the standard of the article. We also acknowledge the language editing services rendered by G Publishing Service, Chennai, India (info@gpublishingservice.com). The authors thank Dr. D. Vinod, Schrödinger Company for his help in molecular dynamics studies.
Abbreviations
- S
Spike protein
- E
Envelope
- M
Membrane
- N
Nucleocapsid
- Pp1a
Polyprotein precursors a
- Pp1b
Polyprotein precursors b
- Mpro
Main protease
- 3CLpro
3-Chymotrypsin (C)-like cysteine protease
- PLpro
Papin-like protease
- CoV
Covid
- COVID-19
Coronavirus disease 2019
- SARS-CoV
Severe acute respiratory syndrome coronavirus
- SARS-CoV-2
Severe acute respiratory syndrome coronavirus 2
- RdRP
RNA-dependent RNA polymerase
- ORF
Open reading frame
- Nsp
Nonstructural protein
- DFT
Density functional theory
- FMO
Frontier molecular orbital
- ESP
Electrostatic potential
- HOMO
Highest occupied molecular orbital
- LUMO
Lowest unoccupied molecular orbital
- MD
Molecular dynamics
- RMSD
Root-mean-squared deviation
- RMSF
Root mean square fluctuations
Author contribution
Joseph George Samuel: calculations, manuscript write up, data generation, and model interpretation and data collection. Beutline Malgija: data generation, discussion, and modeling. Cheriyan Ebenezer: DFT data validation, data generation, and modeling. Rajadurai Vijay Solomon: manuscript concept and manuscript editing and review.
Availability of data and material
The data that support this research are available in the article and supporting information material.
Code availability
Schrödinger suite of program, Gaussian 09 packages, MD simulation package—Desmond.
Declarations
Conflict of interest
The authors declare no competing interests.
Footnotes
Publisher's Note
Springer Nature remains neutral with regard to jurisdictional claims in published maps and institutional affiliations.
References
- 1.McKee DL, Sternberg A, Stange U, Laufer S, Naujokat C. Pharmacol Res. 2020;157:104859. doi: 10.1016/j.phrs.2020.104859. [DOI] [PMC free article] [PubMed] [Google Scholar]
- 2.WH Organization WHO Coronavirus (COVID-19) 2022. https://covid19.who.int. (Accessed 01/08/2022)
- 3.Worldometer COVID-19 Coronavirus pandemic 2022. https://www.worldometers.info/coronavirus. (Accessed 01/08/2022)
- 4.Tam NM, Pham MQ, Nguyen HT, Hong ND, Hien NK, Quang DT, Phung HTT, Ngo ST. RSC Adv. 2021;11:22206. doi: 10.1039/D1RA03852D. [DOI] [PMC free article] [PubMed] [Google Scholar]
- 5.Bhowmick S, Saha A, Osman SM, Alasmary FA, Almutairi TM, Islam MA. Mol Divers. 2021;25:1979. doi: 10.1007/s11030-021-10214-6. [DOI] [PMC free article] [PubMed] [Google Scholar]
- 6.Medicine TLR. Lancet Respir Med. 2020;8:1159. doi: 10.1016/S2213-2600(20)30514-2. [DOI] [PMC free article] [PubMed] [Google Scholar]
- 7.Struyf T, Deeks JJ, Dinnes J, Takwoingi Y, Davenport C, Leeflang MM, Spijker R, Hooft L, Emperador D, Domen J. Cochrane Database Syst Rev. 2022;5:1465. doi: 10.1002/14651858.CD013665.pub2. [DOI] [PMC free article] [PubMed] [Google Scholar]
- 8.Kwon S, Joshi AD, Lo C-H, Drew DA, Nguyen LH, Guo C-G, Ma W, Mehta RS, Shebl FM, Warner ET. Nat Commun. 2021;12:1. doi: 10.1038/s41467-020-20314-w. [DOI] [PMC free article] [PubMed] [Google Scholar]
- 9.Mohamed NM, Ali EM, AboulMagd AM. RSC Adv. 2021;11:4523. doi: 10.1039/D0RA10141A. [DOI] [PMC free article] [PubMed] [Google Scholar]
- 10.Lamers MM, Haagmans BL. Nat Rev Microbiol. 2022;20:270. doi: 10.1038/s41579-022-00713-0. [DOI] [PubMed] [Google Scholar]
- 11.El-Demerdash A, Al-Karmalawy AA, Abdel-Aziz TM, Elhady SS, Darwish KM, Hassan AH. RSC Adv. 2021;11:31339. doi: 10.1039/D1RA05817G. [DOI] [PMC free article] [PubMed] [Google Scholar]
- 12.Pagliano P, Sellitto C, Scarpati G, Ascione T, Conti V, Franci G, Piazza O, Filippelli A. Expert Opin Drug Discov. 2022;17:9. doi: 10.1080/17460441.2021.1970743. [DOI] [PMC free article] [PubMed] [Google Scholar]
- 13.Chetta M, Rosati A, Marzullo L, Tarsitano M, Bukvic N. Heliyon. 2020;6:e05010. doi: 10.1016/j.heliyon.2020.e05010. [DOI] [PMC free article] [PubMed] [Google Scholar]
- 14.Kneller DW, Phillips G, Weiss KL, Zhang Q, Coates L, Kovalevsky A. J Med Chem. 2021;64:4991. doi: 10.1021/acs.jmedchem.1c00058. [DOI] [PMC free article] [PubMed] [Google Scholar]
- 15.Naqvi AAT, Fatima K, Mohammad T, Fatima U, Singh IK, Singh A, Atif SM, Hariprasad G, Hasan GM, Hassan MI. Biochim Biophys Acta Mol Basis Dis. 2020;1866:165878. doi: 10.1016/j.bbadis.2020.165878. [DOI] [PMC free article] [PubMed] [Google Scholar]
- 16.Rasool N, Yasmin F, Sahai S, Hussain W, Inam H, Arshad A. Chem Phys Lett. 2021;771:138463. doi: 10.1016/j.cplett.2021.138463. [DOI] [PMC free article] [PubMed] [Google Scholar]
- 17.Pillaiyar T, Manickam M, Namasivayam V, Hayashi Y, Jung S-H. J Med Chem. 2016;59:6595. doi: 10.1021/acs.jmedchem.5b01461. [DOI] [PMC free article] [PubMed] [Google Scholar]
- 18.Qiao J, Li Y-S, Zeng R, Liu F-L, Luo R-H, Huang C, Wang Y-F, Zhang J, Quan B, Shen C. Science. 2021;371:1374. doi: 10.1126/science.abf1611. [DOI] [PMC free article] [PubMed] [Google Scholar]
- 19.Imbert I, Ulferts R, Ziebuhr J, Canard B. SARS coronavirus replicative enzymes: structures and mechanisms. 1. Berlin, Heidelberg: Springer; 2010. [Google Scholar]
- 20.Gimeno A, Mestres-Truyol J, Ojeda-Montes MJ, Macip G, Saldivar-Espinoza B, Cereto-Massagué A, Pujadas G, Garcia-Vallvé S. Int J Mol Sci. 2020;21:3793. doi: 10.3390/ijms21113793. [DOI] [PMC free article] [PubMed] [Google Scholar]
- 21.Zhang L, Lin D, Kusov Y, Nian Y, Ma Q, Wang J, Von Brunn A, Leyssen P, Lanko K, Neyts J. J Med Chem. 2020;63:4562. doi: 10.1021/acs.jmedchem.9b01828. [DOI] [PubMed] [Google Scholar]
- 22.Lamberth C. Pest Manag Sci. 2013;69:1106. doi: 10.1002/ps.3615. [DOI] [PubMed] [Google Scholar]
- 23.Dua R, Shrivastava S, Sonwane S, Srivastava S. Adv Biol Res. 2011;5:120. [Google Scholar]
- 24.Amer MM, Aziz MA, Shehab WS, Abdellattif MH, Mouneir SM. J Saudi Chem Soc. 2021;25:101259. doi: 10.1016/j.jscs.2021.101259. [DOI] [Google Scholar]
- 25.Forrestall KL, Burley DE, Cash MK, Pottie IR, Darvesh S. Chem Biol Interact. 2021;335:109348. doi: 10.1016/j.cbi.2020.109348. [DOI] [PMC free article] [PubMed] [Google Scholar]
- 26.Chemat F, Abert-Vian M, Fabiano-Tixier AS, Strube J, Uhlenbrock L, Gunjevic V, Cravotto G. Trends Anal Chem. 2019;118:248. doi: 10.1016/j.trac.2019.05.037. [DOI] [Google Scholar]
- 27.Caricato M, Frisch MJ, Hiscocks J (2009) Gaussian 09: IOps Reference, Citeseer
- 28.QikProp SD (2010) Version 3.3 Schrödinger LLC: New York NY
- 29.Banerjee P, Eckert AO, Schrey AK, Preissner R. Nucleic Acids Res. 2018;46:W257. doi: 10.1093/nar/gky318. [DOI] [PMC free article] [PubMed] [Google Scholar]
- 30.Chaudhary KK, Mishra N. Databases. 2016;3:1029. [Google Scholar]
- 31.Hatada R, Okuwaki K, Mochizuki Y, Handa Y, Fukuzawa K, Komeiji Y, Okiyama Y, Tanaka S. J Chem Inf Model. 2020;60:3593. doi: 10.1021/acs.jcim.0c00283. [DOI] [PubMed] [Google Scholar]
- 32.Maestro S (2022) 2022–2 Schrödinger LLC: New York NY
- 33.Zhu K, Borrelli KW, Greenwood JR, Day T, Abel R, Farid RS, Harder E. J Chem Inf Model. 2014;54:1932. doi: 10.1021/ci500118s. [DOI] [PubMed] [Google Scholar]
- 34.Bowers KJ, Chow DE, Xu H, Dror RO, Eastwood MP, Gregersen BA, Klepeis JL, Kolossvary I, Moraes MA, Sacerdoti FD (2006) Scalable algorithms for molecular dynamics simulations on commodity clusters, SC'06: Proceedings of the 2006 ACM/IEEE Conference on Supercomputing IEEE 43
- 35.Andersen HC. J Comput Phys. 1983;52:24. doi: 10.1016/0021-9991(83)90014-1. [DOI] [Google Scholar]
- 36.Head JD, Zerner MC. Chem Phys Lett. 1985;122:264. doi: 10.1016/0009-2614(85)80574-1. [DOI] [Google Scholar]
- 37.Martyna GJ, Klein ML, Tuckerman M. J Chem Phys. 1992;97:2635. doi: 10.1063/1.463940. [DOI] [Google Scholar]
- 38.Martyna GJ, Tobias DJ, Klein ML. J Chem Phys. 1994;101:4177. doi: 10.1063/1.467468. [DOI] [Google Scholar]
- 39.Essmann U, Perera L, Berkowitz ML, Darden T, Lee H, Pedersen LG. J Chem Phys. 1995;103:8577. doi: 10.1063/1.470117. [DOI] [Google Scholar]
- 40.Makov G, Payne M. Phys Rev B. 1995;51:4014. doi: 10.1103/PhysRevB.51.4014. [DOI] [PubMed] [Google Scholar]
- 41.Solomon RV, Jagadeesan R, Vedha SA, Venuvanalingam P. Dyes Pigm. 2014;100:261. doi: 10.1016/j.dyepig.2013.09.016. [DOI] [Google Scholar]
- 42.Solomon RV, Veerapandian P, Vedha SA, Venuvanalingam P. J Phys Chem A. 2012;116:4667. doi: 10.1021/jp302276w. [DOI] [PubMed] [Google Scholar]
- 43.Aihara J-I. J Phys Chem A. 1999;103:7487. doi: 10.1021/jp990092i. [DOI] [Google Scholar]
- 44.Aihara J-I. Theor Chem Acc. 1999;102:134. doi: 10.1007/s002140050483. [DOI] [Google Scholar]
- 45.Choudhary V, Bhatt A, Dash D, Sharma N. J Comput Chem. 2019;40:2354. doi: 10.1002/jcc.26012. [DOI] [PubMed] [Google Scholar]
- 46.Lu J, Kobertz WR, Deutsch C. J Mol Biol. 2007;371:1378. doi: 10.1016/j.jmb.2007.06.038. [DOI] [PubMed] [Google Scholar]
- 47.Scrocco E, Tomasi J (1978) Electronic molecular structure, reactivity and intermolecular forces: an euristic interpretation by means of electrostatic molecular potentials, Advances in quantum chemistry, Elsevier pp. 115
- 48.Luque FJ, López JM, Orozco M. Theor Chem Acc. 2000;103:343. doi: 10.1007/s002149900013. [DOI] [Google Scholar]
- 49.Karthick T, Tandon P. J Mol Model. 2016;22:1. doi: 10.1007/s00894-016-3015-z. [DOI] [PubMed] [Google Scholar]
- 50.Young DC. A practical guide for applying techniques to real-world problems. 1. New York: Wiley-Interscience; 2001. [Google Scholar]
- 51.Zahn S, Kirchner B. J Phys Chem A. 2008;112:8430. doi: 10.1021/jp805306u. [DOI] [PubMed] [Google Scholar]
- 52.Zhou Z, Parr RG. J Am Chem Soc. 1990;112:5720. doi: 10.1021/ja00171a007. [DOI] [Google Scholar]
- 53.Parr R, Szentpaly L, Liu S. J Am Chem Soc. 1999;121:1922. doi: 10.1021/ja983494x. [DOI] [Google Scholar]
- 54.Parr RG, Pearson RG. J Am Chem Soc. 1983;105:7512. doi: 10.1021/ja00364a005. [DOI] [Google Scholar]
- 55.Lipin R, Dhanabalan AK, Gunasekaran K, Solomon RV. SN Appl Sci. 2021;3:1. doi: 10.1007/s42452-020-04051-9. [DOI] [PMC free article] [PubMed] [Google Scholar]
- 56.Padmanabhan J, Parthasarathi R, Subramanian V, Chattaraj P. J Phys Chem A. 2007;111:1358. doi: 10.1021/jp0649549. [DOI] [PubMed] [Google Scholar]
- 57.Zhao B, Ni C, Gao R, Wang Y, Yang L, Wei J, Lv T, Liang J, Zhang Q, Xu W. Protein Cell. 2020;11:771. doi: 10.1007/s13238-020-00718-6. [DOI] [PMC free article] [PubMed] [Google Scholar]
- 58.Huang C, Wang Y, Li X, Ren L, Zhao J, Hu Y, Zhang L, Fan G, Xu J, Gu X. Lancet. 2020;395:497. doi: 10.1016/S0140-6736(20)30183-5. [DOI] [PMC free article] [PubMed] [Google Scholar]
- 59.Kneller DW, Phillips G, O’Neill HM, Jedrzejczak R, Stols L, Langan P, Joachimiak A, Coates L, Kovalevsky A. Nat Commun. 2020;11:1. doi: 10.1038/s41467-020-16954-7. [DOI] [PMC free article] [PubMed] [Google Scholar]
- 60.Zheng M, Jagota A, Strano MS, Santos AP, Barone P, Chou SG, Diner BA, Dresselhaus MS, Mclean RS, Onoa GB. Science. 2003;302:1545. doi: 10.1126/science.1091911. [DOI] [PubMed] [Google Scholar]
- 61.Anand K, Ziebuhr J, Wadhwani P, Mesters JR, Hilgenfeld R. Science. 2003;300:1763. doi: 10.1126/science.1085658. [DOI] [PubMed] [Google Scholar]
- 62.Ghosh AK, Samanta I, Mondal A, Liu WR. ChemMedChem. 2019;14:889. doi: 10.1002/cmdc.201900107. [DOI] [PMC free article] [PubMed] [Google Scholar]
- 63.Kakarala KK, Jamil K. J Biomol Struct. 2015;33:2003. doi: 10.1080/07391102.2014.986197. [DOI] [PubMed] [Google Scholar]
Associated Data
This section collects any data citations, data availability statements, or supplementary materials included in this article.
Data Availability Statement
The data that support this research are available in the article and supporting information material.
Schrödinger suite of program, Gaussian 09 packages, MD simulation package—Desmond.