

SUMMARY
Goal-directed behavior requires identifying objects in the environment that can satisfy internal needs and executing actions to obtain those objects. The current study examines ventral and dorsal corticostriatal circuits that support complementary aspects of goal-directed behavior. We analyze activity from the amygdala, ventral striatum, orbitofrontal cortex and lateral prefrontal cortex (LPFC) while monkeys perform a three-armed bandit task. Information about chosen stimuli and their value is primarily encoded in the amygdala, ventral striatum, and orbitofrontal cortex, while the spatial information is primarily encoded in the LPFC. Before the options are presented, information about the to-be-chosen stimulus is represented in the amygdala, ventral striatum, and orbitofrontal cortex; at the time of choice, the information is passed to the LPFC to direct a saccade. Thus, learned value information specifying behavioral goals is maintained throughout the ventral corticostriatal circuit, and it is routed through the dorsal circuit at the time actions are selected.
INTRODUCTION
Goal-directed behavior requires the interaction of neural systems that define goals, with systems that support the cognitive and motor behaviors that achieve those goals. We have recently suggested that corticostriatal systems can be broadly grouped into ventral and dorsal systems, where we distinguish the systems on the basis of whether they project through the dorsal or ventral striatum (Averbeck and Murray, 2020; Neftci and Averbeck, 2019). The dorsal circuit is composed of the inferior parietal cortex, dorsal lateral prefrontal cortex (dlPFC), dorsal striatum, and the associated pallidal and thalamic nuclei (Goldman-Rakic, 1988). The ventral circuit is composed of the anterior temporal lobe, including the amygdala (AMY), hippocampus, rhinal cortical areas, ventral medial prefrontal cortex, caudal orbitofrontal cortex (OFC), ventral striatum (VS), and the pallidal and thalamic nuclei through which they project (Haber et al., 1993). This anatomical distinction relates to a functional distinction. Specifically, the dorsal circuit is critical for representing the spatial locations of relevant objects and for dynamically computing which actions are necessary to acquire those objects (Andersen et al., 1997). The ventral circuit, by virtue of strong anatomical interactions with the hypothalamus, is important for linking objects in the environment with specific internal states, for example, hunger and thirst (Andermann and Lowell, 2017). Therefore, the ventral circuit is critical for specifying behavioral goals, and the dorsal circuit is critical for obtaining those goals. We have, furthermore, suggested that dynamic interactions between the ventral and dorsal circuits motivate the execution of goal-directed actions (Averbeck and Murray, 2020; Neftci and Averbeck, 2019).
Within the context of value-guided decision making, ventral circuit areas, including the amygdala, VS, and OFC, have been shown to encode the values of objects, choices, and outcomes (Chau et al., 2015; Rich and Wallis, 2016; Rudebeck et al., 2013; Strait et al., 2015). Similar encoding has also been seen in reinforcement learning tasks when values develop over trials (Bartolo and Averbeck, 2020; Costa and Averbeck, 2020; Costa et al., 2019). Likewise, dorsal circuit nodes, including the dlPFC, have been shown to represent visuospatial information and have connections to other important spatial-motor areas, including the inferior and medial parietal cortex, frontal eye fields (FEF) and premotor areas (Caminiti et al., 1996; Chen and Wise, 1996; Cisek and Kalaska, 2002; Johnson et al., 1993; Lu et al., 1994; Marconi et al., 2001; Selemon and Goldman-Rakic, 1988). The dlPFC has also been shown to encode both object and action values in the context of reinforcement learning (Lee and Seo, 2007). Therefore, most of the variables relevant to goal-directed behavior are present across the ventral and dorsal circuits. These observations, collected across disparate tasks, appear to be inconsistent with our suggested distinction between these circuits.
Studies of RL usually rely on n-armed bandit tasks (Averbeck and O’Doherty, 2021). In these tasks, participants are shown 2 or 3 objects for a series of trials. In each trial, they select an object and obtain an outcome. By integrating choices and outcomes over a series of trials, they learn which object is most valuable. Therefore, the behavioral goal is defined by the object which the participants have learned has the highest value. For example, if a monkey has learned that an image of a blue car is currently the best available option, then it may maintain a representation of the blue car throughout the inter-trial hold period before the options are presented. When the images are presented, the monkey must identify the location of the blue car and direct an eye movement towards the image. This suggests that the ventral system will maintain a representation of the image to be selected. Further, this information will be routed through the dorsal system to direct an action to the object to obtain the goal when the images are presented (Tang et al., 2021).
In the present study, we recorded neural activity from nodes in both the ventral and dorsal systems while monkeys carried out an RL task. We examined time-dependent encoding and population decoding of behavioral variables relevant to goal-directed behavior and compared them across these nodes. We primarily focus on two questions that represent a physiological double-dissociation across the ventral and dorsal circuits. First, how is information about behavioral goals represented across the ventral and dorsal circuits before action is required to obtain the goal? Second, are the actions required to obtain those goals represented equally across the ventral and dorsal circuits? For comparison, we also examined the representation of choice outcomes (i.e., rewards). We find that while choice outcomes are represented approximately equally across the ventral and dorsal circuits, the stimulus that the monkeys chose in each trial was represented more strongly in the baseline hold period in the ventral circuit before the options were shown. At the time of choice, there was a phasic increase in the representation of the stimulus in the dorsal circuit, particularly in the caudal, ventral-lateral prefrontal cortex, which receives a strong input from the amygdala (Ghashghaei et al., 2007). The action required to obtain the goal, conversely, was represented only at the time of choice in lateral prefrontal areas. There was only a minimal and lagged representation of the action in ventral areas. These data confirm differential roles of ventral and dorsal circuit nodes in learning and representing behavioral goals and the actions required to obtain those goals.
RESULTS
Five rhesus monkeys were trained on a three-armed bandit RL task (Figures 1A–B). On each trial, three images were presented to the monkeys. Each image had an associated reward probability, which was unknown to the monkeys. To maximize reward, they had to learn the stimulus-outcome relationships by sampling one of the options on each trial. However, the number of opportunities they had to learn about each option’s value was limited. Every 10 to 30 trials, one of the three options was randomly replaced with a novel option. Whenever a novel option was introduced, the monkeys could not predict its assigned reward probability. To learn the value of the novel option, the monkeys had to explore it. In previous publications, we have focused on the explore-exploit problem in ventral circuit nodes (Costa and Averbeck, 2020; Costa et al., 2019). Here we focus on comparisons between goal-relevant representations in ventral and dorsal circuit nodes.
Figure 1. Task, behavior, and recording locations.
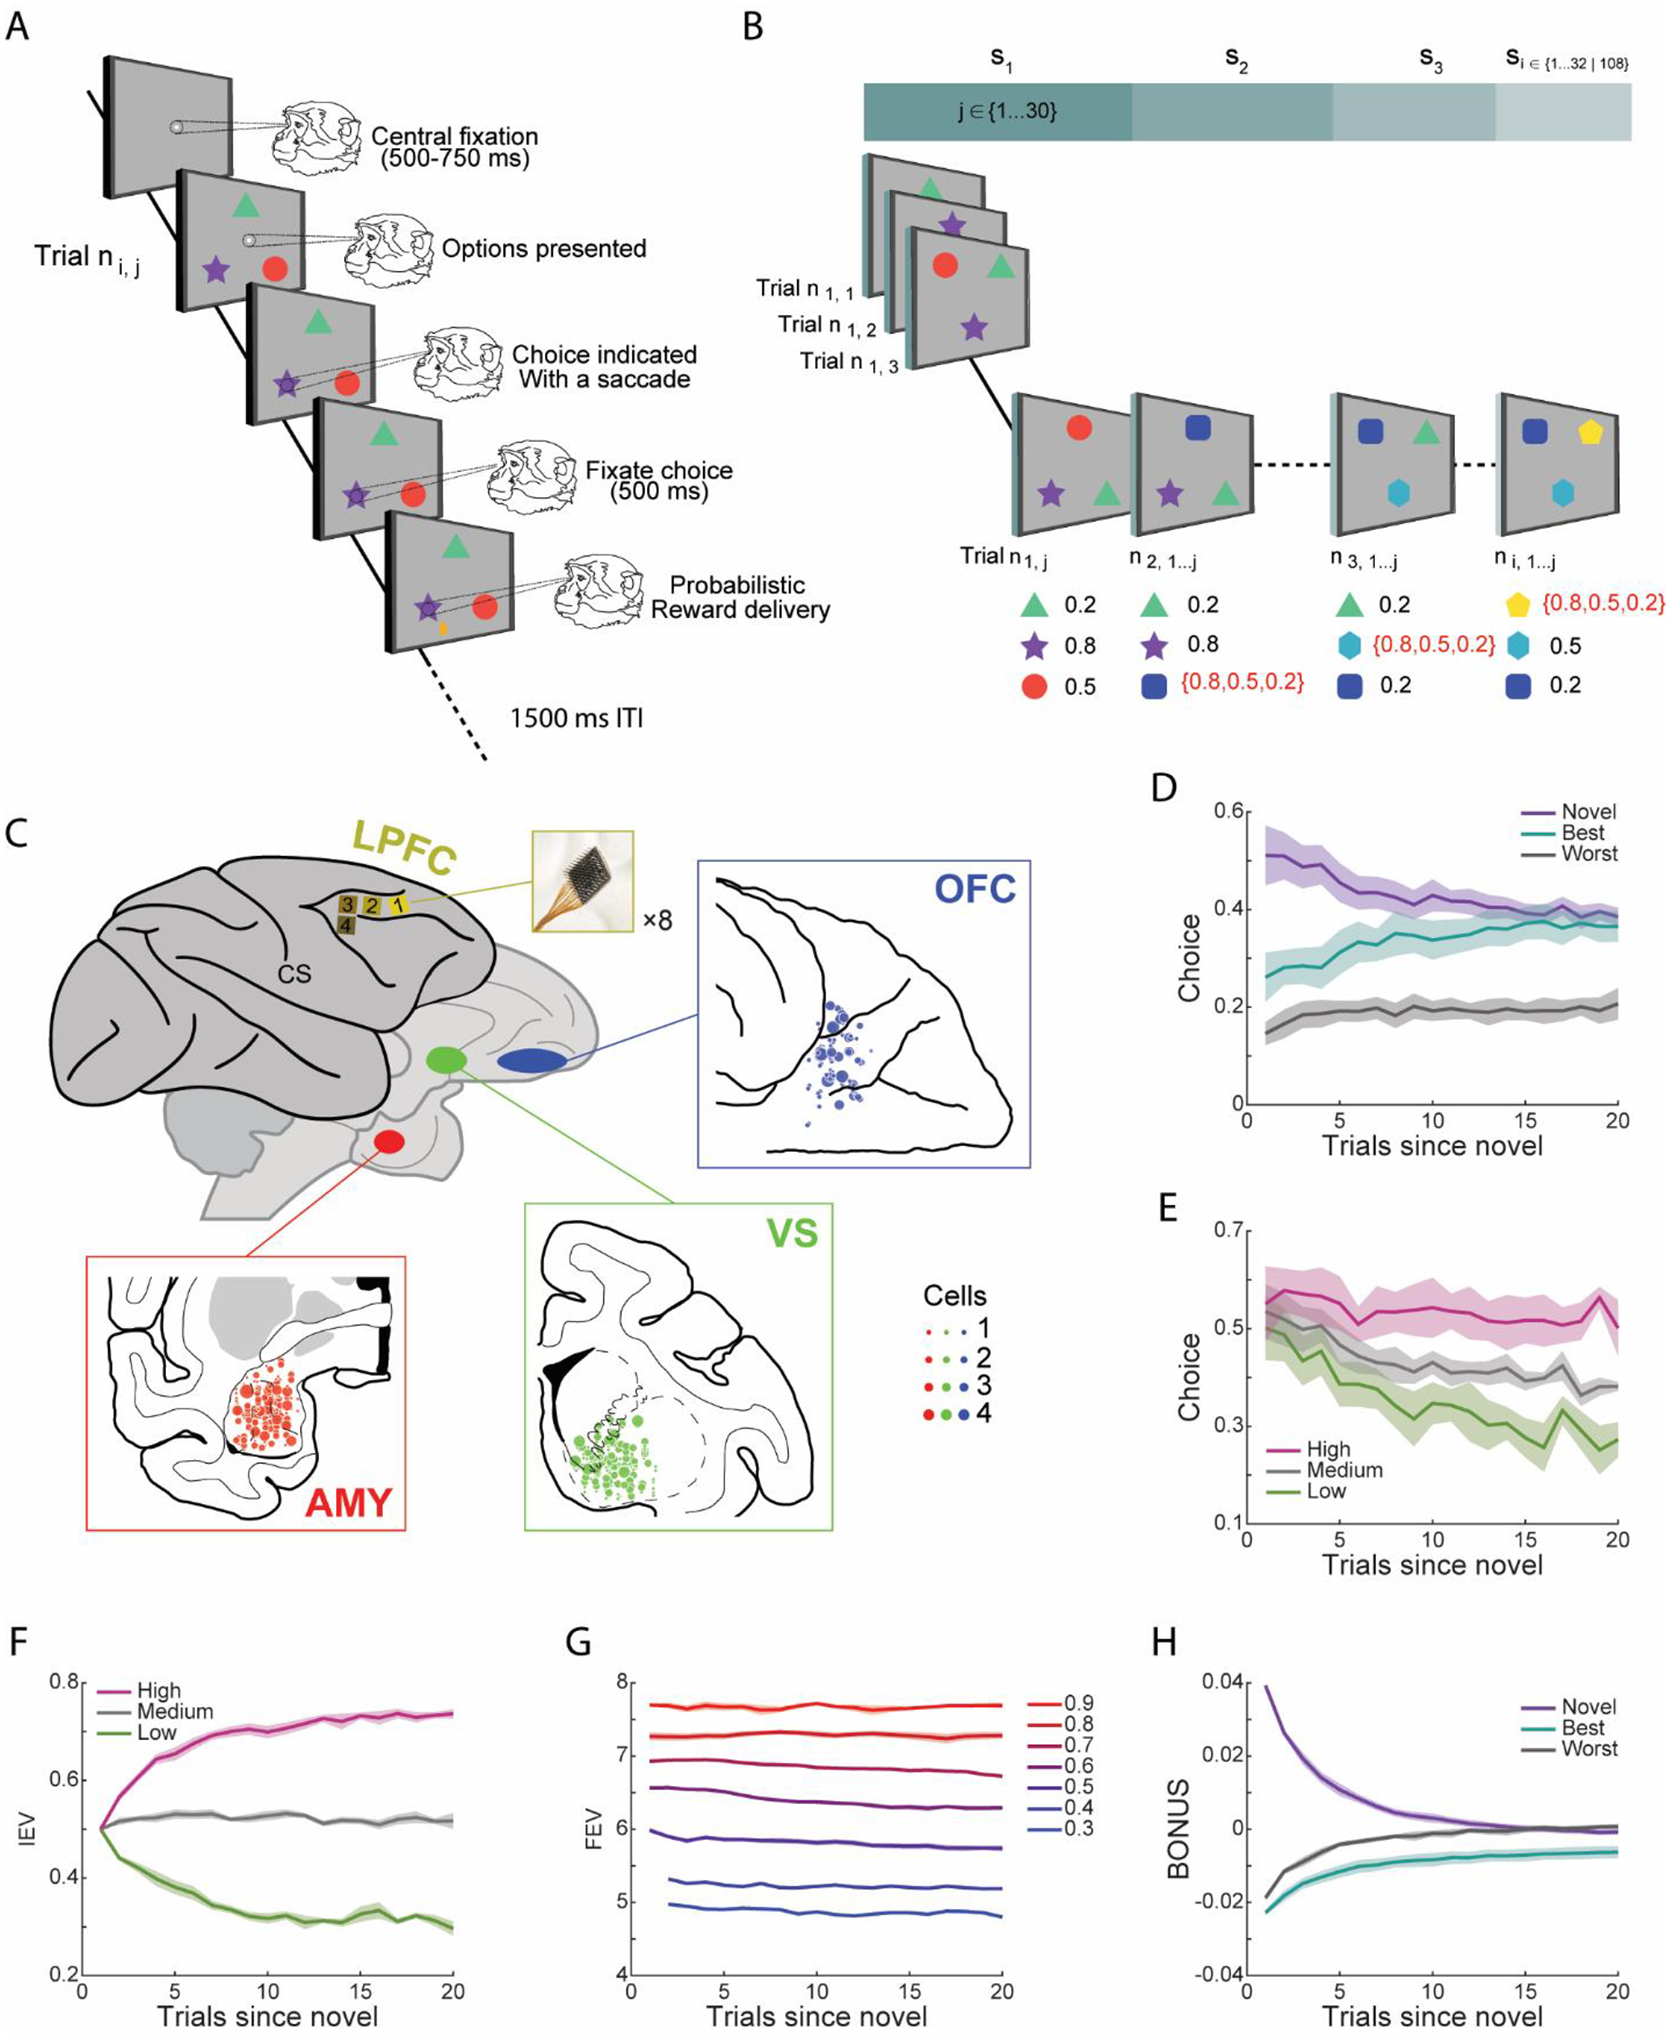
(A) Structure of an individual trial. Successive frames illustrate the sequence of events.
(B) Each session included i sets, i = 32 for acute recordings, i = 108 for chronic recordings; each set had j trials, j ∈ [10, 30]. Each session began with presenting three novel images, which were randomly assigned a reward probability of 0.2, 0.5 or 0.8. At the beginning of each new set, one of the existing options was randomly replaced with a novel image. The novel option was randomly assigned its reward probability as well. Images with naturalistic scenes were used as stimuli in the task and were never repeated across sessions. For simplicity, they are represented by simple visual stimuli here.
(C) Schematic recording locations. Four Utah arrays (yellow) were implanted in the LPFC of each hemisphere. Insets show the recording cites in the amygdala (red), ventral striatum (green) and OFC (blue).
(D) Fraction of times the monkeys chose the novel, best or worst alternative options in terms of the number of trials since a novel option was introduced.
(E) Fraction of times the monkeys chose novel options based on their a priori assigned reward values. High, medium and low means 0.8, 0.5 and 0.2.
(F) Mean trial-by-trial changes in the IEV of novel options with different a priori assigned reward values.
(G) Mean trial-by-trial changes in the FEV, averaged across all three options, as a function of the maximum available IEV.
(H) Mean trial-by-trial changes in the exploration BONUS for choosing each option type.
(D-H) Shaded zones represent mean ± SEM. Results were averaged from five monkeys, n = 5.
Choice Behavior
The monkeys often chose novel options when they were first introduced (Figure 1D; Option Type, F (2, 152) = 1136.73, p < 0.001). However, this preference reduced over trials as options were selected and became familiar (Option Type × Trial, F (38,152) = 5.92, p < 0.001). With experience, the monkeys learned to select the most valuable option (Figure 1E). Specifically, we found that the monkeys learned to discriminate between high-, medium-, and low-value options (Reward Value, F (2, 152) = 415.69, p < 0.001; Reward Value × Trial, F (38, 152) = 2.43, p < 0.001).
Modeling of Learned Values
We used a model-based RL algorithm (Averbeck, 2015) to estimate values for novel and familiar options in the task, similar to our previous study (Costa et al., 2019). The model generates immediate expected values (IEV), future expected values (FEV) and a novelty bonus (BONUS) estimate for each option in each trial, based on the number of times each option was chosen and rewarded in the past. The IEV is an estimate of the probability that the current choice will be rewarded based on past outcomes. It is given by the number of times the option has been rewarded, divided by the number of times it has been chosen. Initial IEVs, based on priors, are equal to 0.5 for novel options assigned high, medium, or low reward values. The IEVs then diverge as the options are chosen over trials (Figure 1F). The FEV is the discounted sum of future rewards. It reflects the richness of the reward environment. For example, the FEV is higher in the current state if the best available option has a high IEV compared to when the best option has a medium or low IEV (Figure 1G). This occurs because there is a greater opportunity to earn rewards across future trials when the best option has a high IEV.
In a given state, the FEV of the options differs based on how many times the monkey has sampled it, and this can be used to define an exploration bonus. On each trial, the difference in the FEV of individual options relative to the average FEV of all three options quantifies the average gain or loss in future rewards associated with choosing each option. We refer to this quantity as the “exploration BONUS” (e.g., BONUSnovel = FEVnovel − (Σj=novel,best,worst FEVj)/3). It is higher for novel options when they are first introduced than options about which one has more experience. When an option is sampled, the monkey becomes more certain about its actual value, and the exploration BONUS decreases (Figure 1H). In parallel, the exploration BONUS for the best and worst alternative options was, on average, negative when a novel option was introduced because the monkeys had already sampled each option and were more certain about their values.
Neurophysiological Recordings
Recordings were carried out in two experiments. In one experiment, acute recordings were collected from three monkeys using multiple single microelectrodes (Figure 1C). We recorded 360 neurons in the amygdala, 314 neurons in the VS and 149 neurons in the OFC (Table S1). This dataset has been published previously (Costa and Averbeck, 2020; Costa et al., 2019). In the other experiment, two monkeys were implanted with eight Utah arrays over the LPFC, surrounding the principal sulcus (Figure 1C). Four 96-electrode arrays were implanted in each hemisphere (Mitz et al., 2017; Tang et al., 2021). These arrays were located in the rostral dorsal (rdlPFC), medial dorsal (mdlPFC), caudal dorsal (cdlPFC), and ventral LPFC (vlPFC). For each monkey in the second experiment, three sessions of neurophysiology data were analyzed, in which we recorded the activity of 1657 neurons from monkey V and 1998 neurons from monkey W (Table S1). Recordings from these two monkeys, using different tasks, have been published previously (Bartolo and Averbeck, 2020; Bartolo et al., 2020a; b; Tang et al., 2021).
Stimulus, Outcome Responsiveness and Behavioral Correlates
We began by characterizing general features of the neuronal responses. The task-related neuronal activity was similar across areas, although the magnitude of firing rate changes tended to be higher in the cdlPFC and vlPFC (Figure 2). Neurons recorded in these areas showed response modulation when stimuli or outcomes (i.e., reward or no reward) were presented (Figure 2A). To assess their responses to stimuli and outcomes, we compared the z-scored firing rates in the first 100 to 400 ms following stimulus onset and within the first 300 ms following outcome (Figure 2B). The neurons in different areas showed different modulations to cues (choice options), choices, and outcomes (Figures 2D–F, Area × Event, F (6, 8776) = 8.2, p < 0.001). Specifically, the mdlPFC (paired t-test, t (963) = 4.62, p < 0.001), cdlPFC (paired t-test, t (1344) = 5.85, p < 0.001), and vlPFC (paired t-test, t (644) = 4.98, p < 0.001) showed more robust responses to choice options; the VS (paired t-test, t (313) = 3.05, p < 0.01) and OFC (paired t-test, t (148) = 2.09, p < 0.05) showed stronger responses to outcomes, and the amygdala and rdlPFC showed similar responses to both choice options and outcomes (Figure 2G).
Figure 2. Neural activity in the amygdala, ventral striatum, OFC, and LPFC.
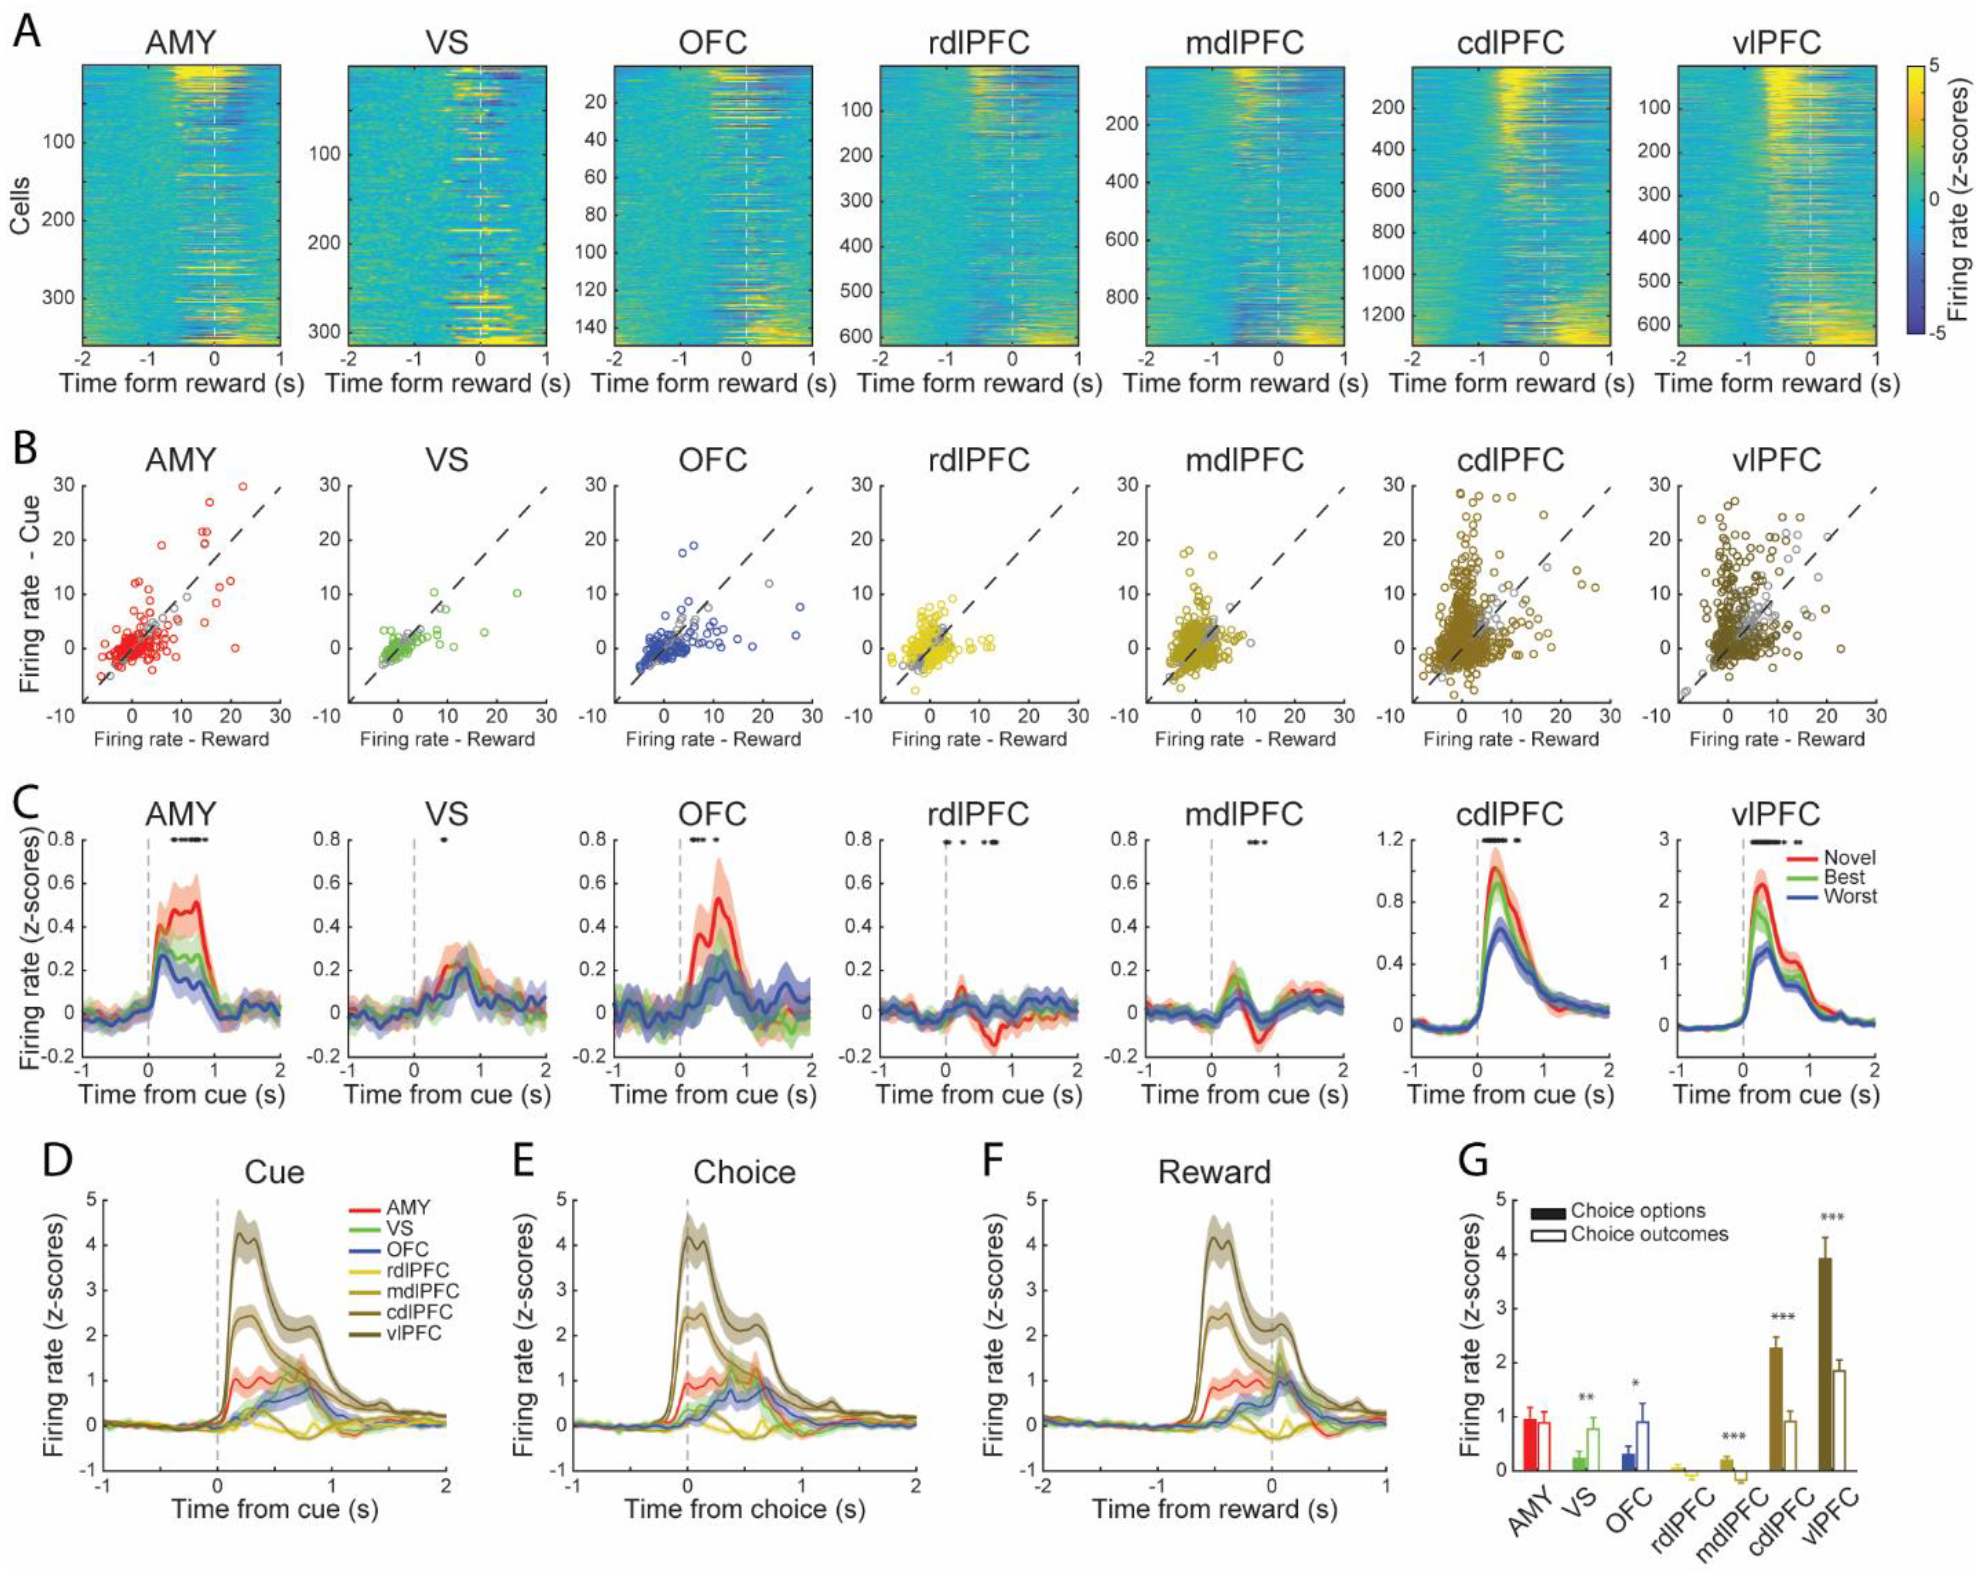
(A) Heatmaps of activity of all the neurons recorded from the amygdala (n = 360), VS (n = 314), OFC (n = 149), rdlPFC (n = 635), mdlPFC (n = 980), cdlPFC (n = 1375) and vlPFC (n = 665). Firing rates were z-scored based on activity during the hold period. Warmer colors indicate higher firing rates. Neurons were aligned to the onset of outcome, and rank-ordered by the difference between the amplitude of their responses to stimuli and outcomes.
(B) Responses to stimuli and outcomes for each neuron. Each circle represents one neuron. The colorful circles represent neurons that showed significantly different (paired t-test, p < 0.01) responses between stimuli and outcomes. The gray circles represent the non-significant neurons.
(C) Average responses of all the neurons when the animals chose the novel, best alternative, or worst alternative options. Only the first three trials since the novel options were assigned were used. The black asterisks indicate a significant difference (one-way ANOVA, p < 0.05) among different trial groups.
(D-F) Average responses of all the neurons in each area, data aligned to the onset of stimulus, choice, or outcome.
(G) Mean z-scored neuronal responses recorded in each area to stimuli and outcomes. Summary of Figure 2B. Paired t-test, *p < 0.05, **p < 0.01, ***p < 0.001.
(C-G) Shaded zones and error bars represent mean ± SEM.
The type of choice options also modulated neuronal activity. We compared responses to choices classified as the novel (i.e., the most recently introduced), best or worst alternative (i.e., the familiar option with the highest or lowest IEV). We found that neurons across areas differentiated these choices, especially in the amygdala, OFC, cdlPFC and vlPFC (Figure 2C).
These overall evaluations of firing rates revealed that, in general, the neuronal responses to stimuli and outcomes were similar across these areas. However, they also showed diversity in response to different stimuli and between chosen options and outcomes. To investigate this in detail, we next examined the coding of each behavior factor included in this experiment.
Neuronal Encoding of Stimulus Identity, Direction and Outcome
To examine how the task factors were represented in each area, we fitted the responses of single neurons with a multi-way ANOVA model. The ANOVA included nine factors which were the chosen stimulus (Stimulus), saccade direction (Direction), the orientation of stimulus set (Orientation), linear trial number since the latest novel option was introduced (TSN), the outcome of the current (Outcome) and previous (Outcome (t-1)) trial, and choice value (split into IEV, FEV, and BONUS terms). Figure 3 shows an example neuron responded to all nine factors.
Figure 3. Neuronal responses of an example neuron.
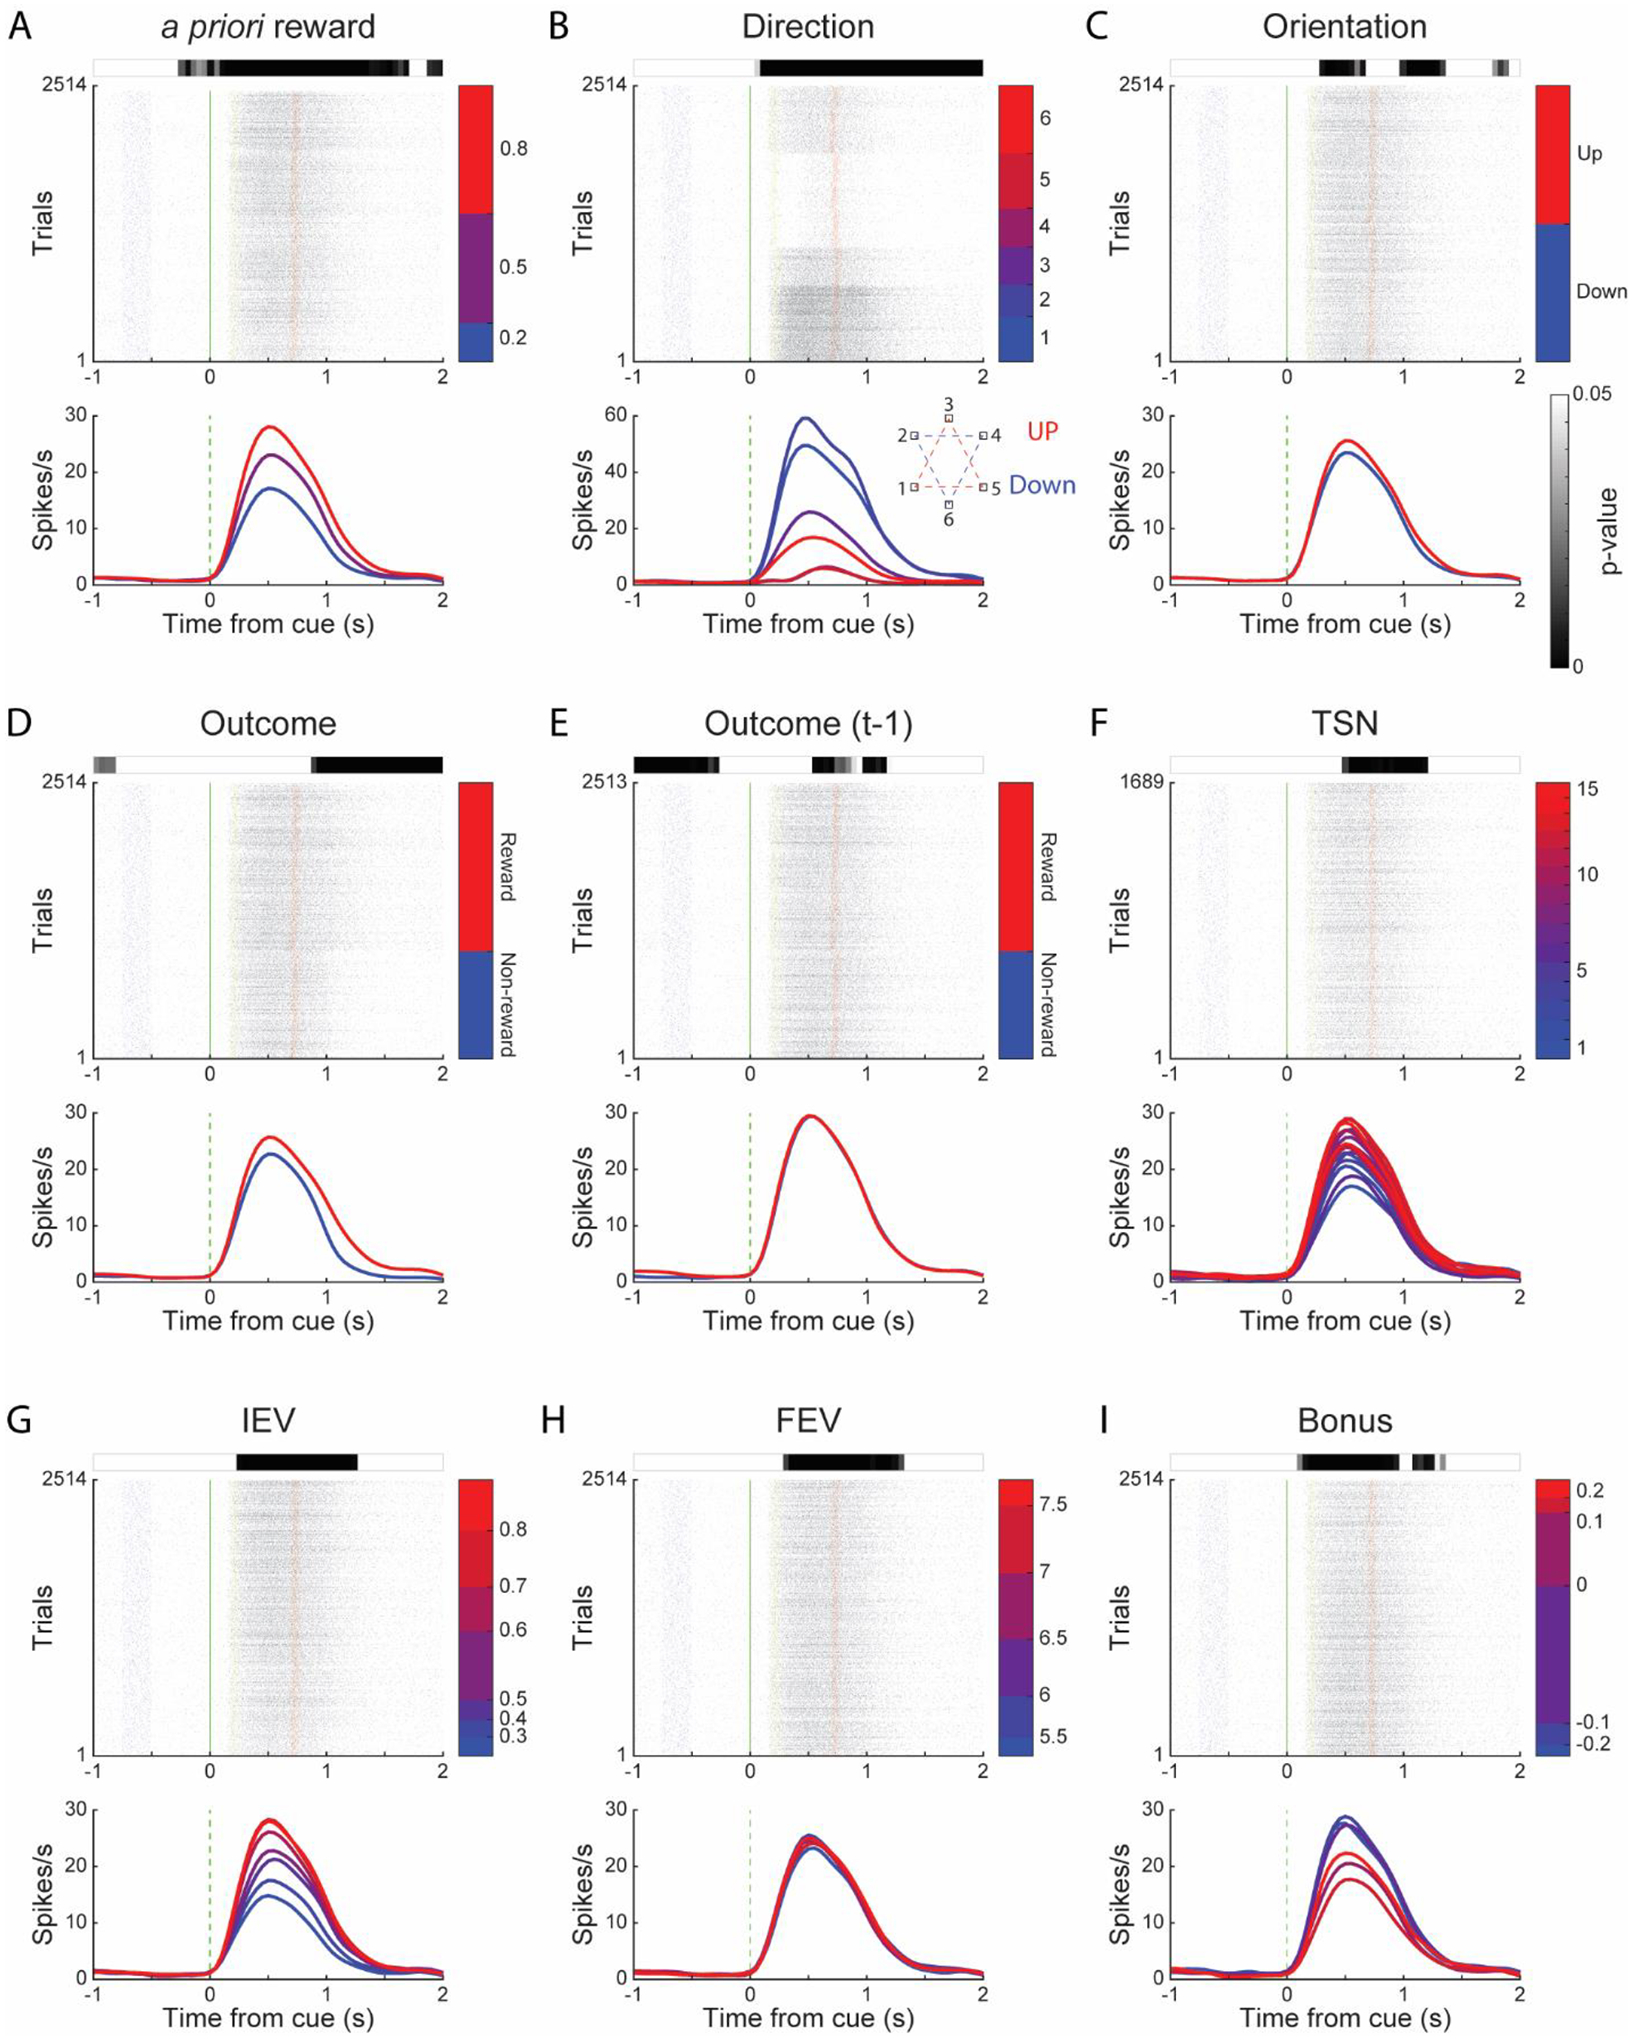
An example cdlPFC neuron responded to all nine factors used in the ANOVA model. For each factor, the raster plot is located in the medial. Each row in the raster plot represents the spikes during a trial. Blue, green, yellow and red dots represent fixations, cues, choices and outcomes. The color bars by the raster plot side show the trial groups with different conditions. The curves below the raster plot indicate this neuron’s average activity, split by the trial groups defined by the color bars. The grey-scale bar above the raster plot shows the significant level of this neuron for the specific factor along the time course of a trial, and white means not significant (p > 0.05).
2514 trials were performed in this session. For Direction (B), the inset shows the screen location of saccade directions and the relationship between Direction and Orientation. For TSN (F), only the trials appeared within the first 15 trials since novel options were included, which resulted in 1689 trials.
We characterized single-cell encoding of the chosen stimulus, direction and outcome (Figure 4). These three factors are directly observable in each trial and therefore represent the stimulus and response components of the task. Approximately 40% of amygdala, VS and OFC neurons showed a sustained representation of the to-be-chosen Stimulus during the hold period (1000 ms to 0 ms before stimulus onset). The encoding strength of neurons in the LPFC regions during the hold period was weaker than it was in the ventral areas (Figure 4A inset, Table S2; Chi-square test, X2 >= 10.25, p <= 0.001), although it was above chance (Figure 4A; binomial test, p < 0.01). The representation in the ventral-stream areas before the stimuli were presented indicates learning (Tang et al., 2019) and reflects an internal representation of the to-be-chosen option. All areas exhibited an increase in chosen Stimulus encoding when the stimuli were presented, compared to the hold period (Figure 4A; Chi-square test, p < 0.05), which was most strongly represented in the amygdala, VS, OFC and vlPFC.
Figure 4. Population encoding of chosen stimulus, direction and outcome.
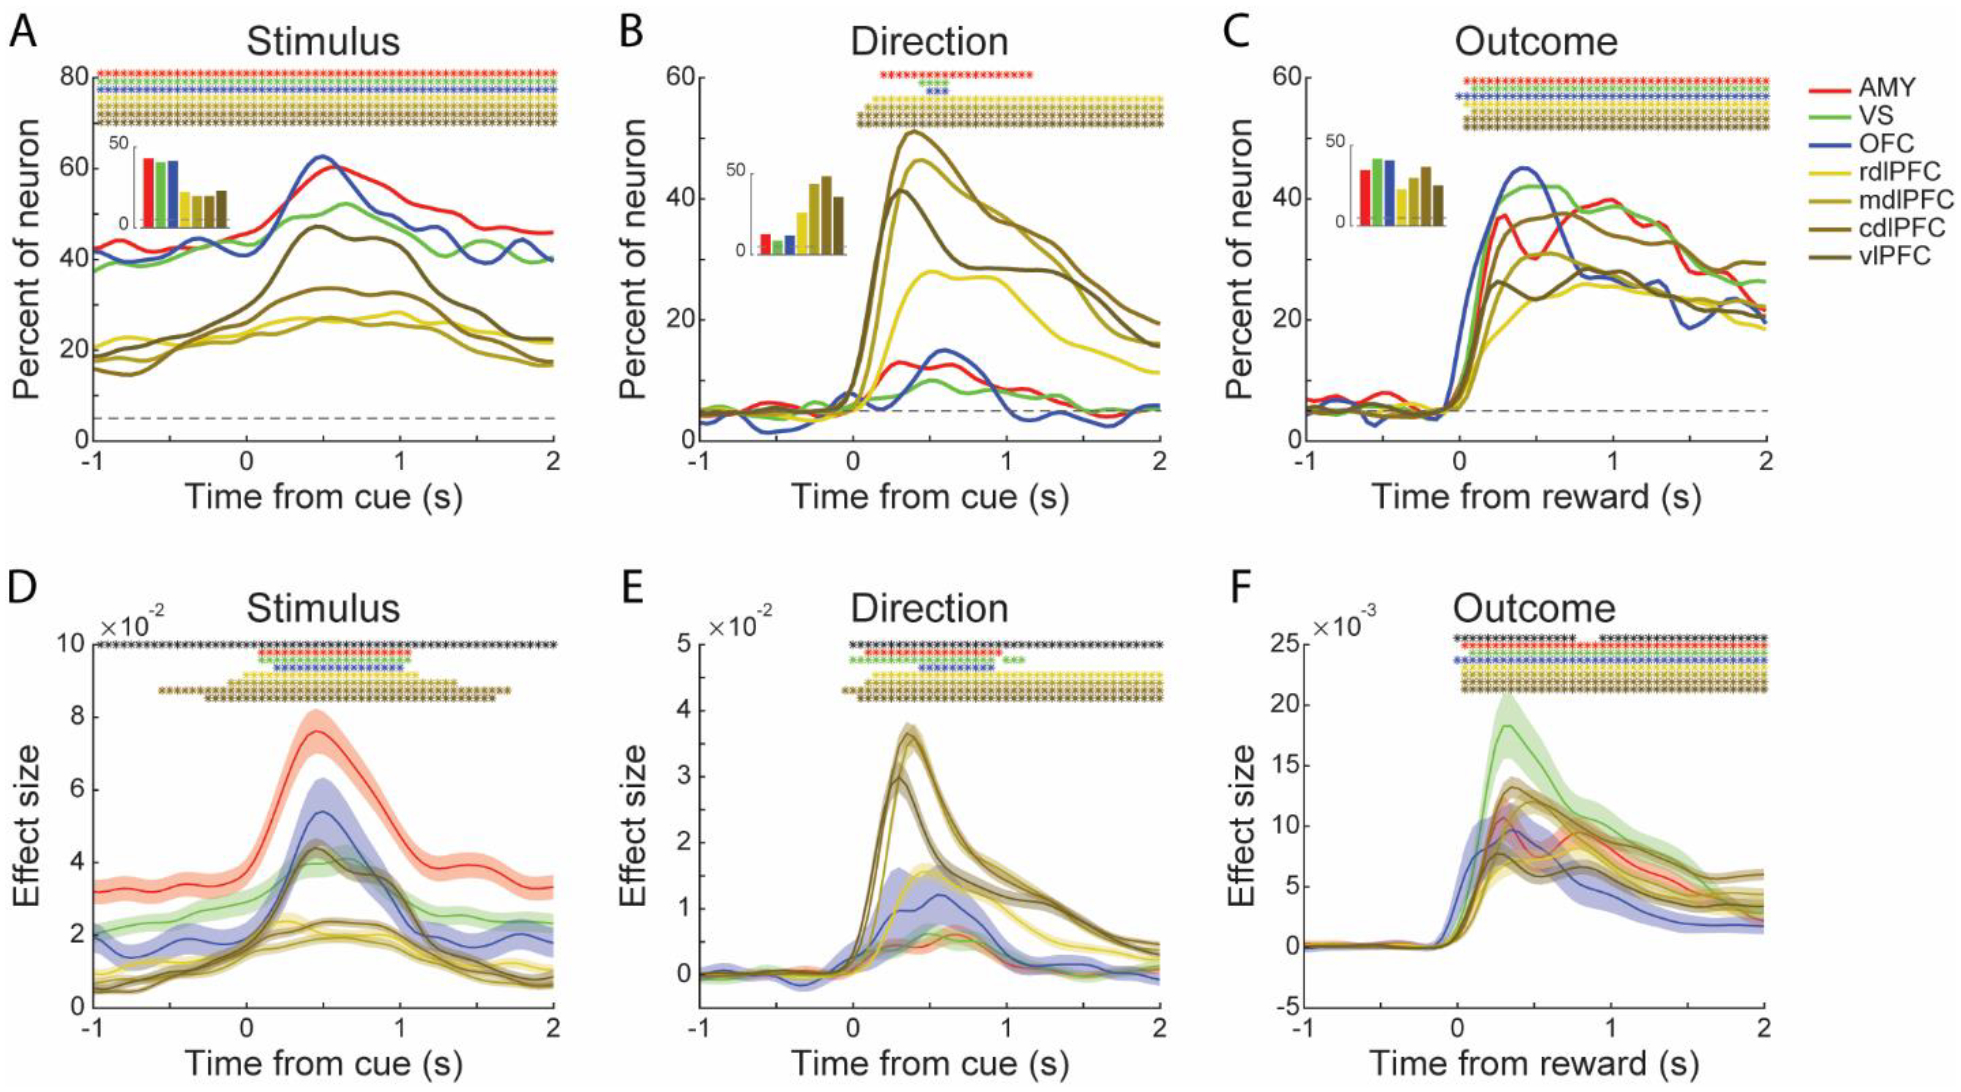
(A-C) Percentage of responsive neurons in each area encoding the Stimulus (A), Direction (B) of the chosen option, and the Outcome on the current trial (C). Data were aligned to either the onset of stimulus or outcome. Insets: mean fraction of responsive neurons during the hold period for Stimulus (A), during the following cue period (250 to 750 ms after stimulus onset) for Direction (B), during the following reward period (250 to 750 ms after outcome onset) for Outcome (C). Dashed horizontal lines represent chance levels. The colored asterisks indicate a significant difference between the corresponding area and chance level (binomial test, p < 0.01). Statistics for the between areas analyses (insets) are indicated in Table S2. Only the neuronal activity collected from the first 600 trials was used in these analyses. Results of using different numbers of trials can be found in Figure S1.
(D-F) Mean effect size (ω2) for the task-responsive neurons encoding the Stimulus (D), Direction (E) of the chosen option, and the Outcome on the current trial (F). The black asterisks at the top of each panel indicate a significant difference among the seven areas (one-way ANOVA, p < 0.01). The colored asterisks indicate a significant difference between the corresponding area and its hold period (paired t-test, p < 0.01). Shaded zones represent mean ± SEM. The number of neurons used in the effect size analyses is indicated in Table S3.
Results were similar when we considered the effect sizes of each task-responsive neuron. The mean effect sizes during the hold period were larger in the amygdala and VS than the LPFC regions (Figure 4D; Area, F (6, 2146) = 76.27, p < 0.001; Post hoc comparisons using the Tukey HSD test, amygdala, M = 0.0331, SD = 0.0372; VS, M = 0.0247, SD = 0.0265). These results indicate that more neurons in the amygdala, VS and OFC were involved in the encoding of chosen Stimulus, and the effect size of each neuron was larger.
Direction was primarily encoded in the LPFC regions (Figure 4B, Table S2; Chi-square test, p < 0.05), and the effect sizes were also larger in these areas (Figure 4E). The trial Outcome -- whether the choice was rewarded or not -- was encoded similarly across areas, with somewhat stronger encoding in the VS, amygdala, OFC and cdlPFC (Figure 4C, Table S2; Chi-square test, p < 0.05). However, the effect sizes of the responsive neurons in the VS were larger than in the other areas (Figure 4F; Post hoc comparisons using the Tukey HSD test, M = 0.0158, SD = 0.0189). A phasic response to Outcome first appeared in the OFC, and then the signal was consistently presented in the other areas (Figure 4C; asterisks).
These results show that task factors related to the sensory, motor and outcome variables were encoded widely across areas. One exception was spatial information, which was mostly encoded in the LPFC regions.
Neuronal Encoding of Value
A substantial proportion of neurons in these areas also showed responses to all three value variables. The values are latent variables that are not directly observable on each trial. Rather they are functions of previous trial choices and outcomes. Approximately 13% of neurons recorded in the amygdala showed a sustained representation of the IEV of the chosen stimulus during the hold period, larger than the LPFC regions (Figure 5A inset, Table S2; Chi-square test, X2 >= 4.98, p < 0.05). The OFC neurons showed a similar hold period response, but it was not significantly larger than the LPFC regions (Figure 5A inset, Table S2) due to the smaller sample size. This hold period representation of value reflects the learning across trials. To examine this learning directly, we compared the change in value representation across trials when a choice was or was not rewarded. We predicted that when a choice was rewarded and the same option was chosen again, the value representation should increase for neurons that preferred large values, and it should decrease for neurons that preferred small values. The opposite should hold when choices were not rewarded. We found that this was the case but only in the amygdala, VS and OFC (Figure S2). Phasic encoding of IEV was observed in all areas after the onset of stimulus (Figure 5A), but it was weaker in the rdlPFC and mdlPFC. However, the effect sizes were similar (Figure 5D).
Figure 5. Population encoding of POMDP derived value signals.
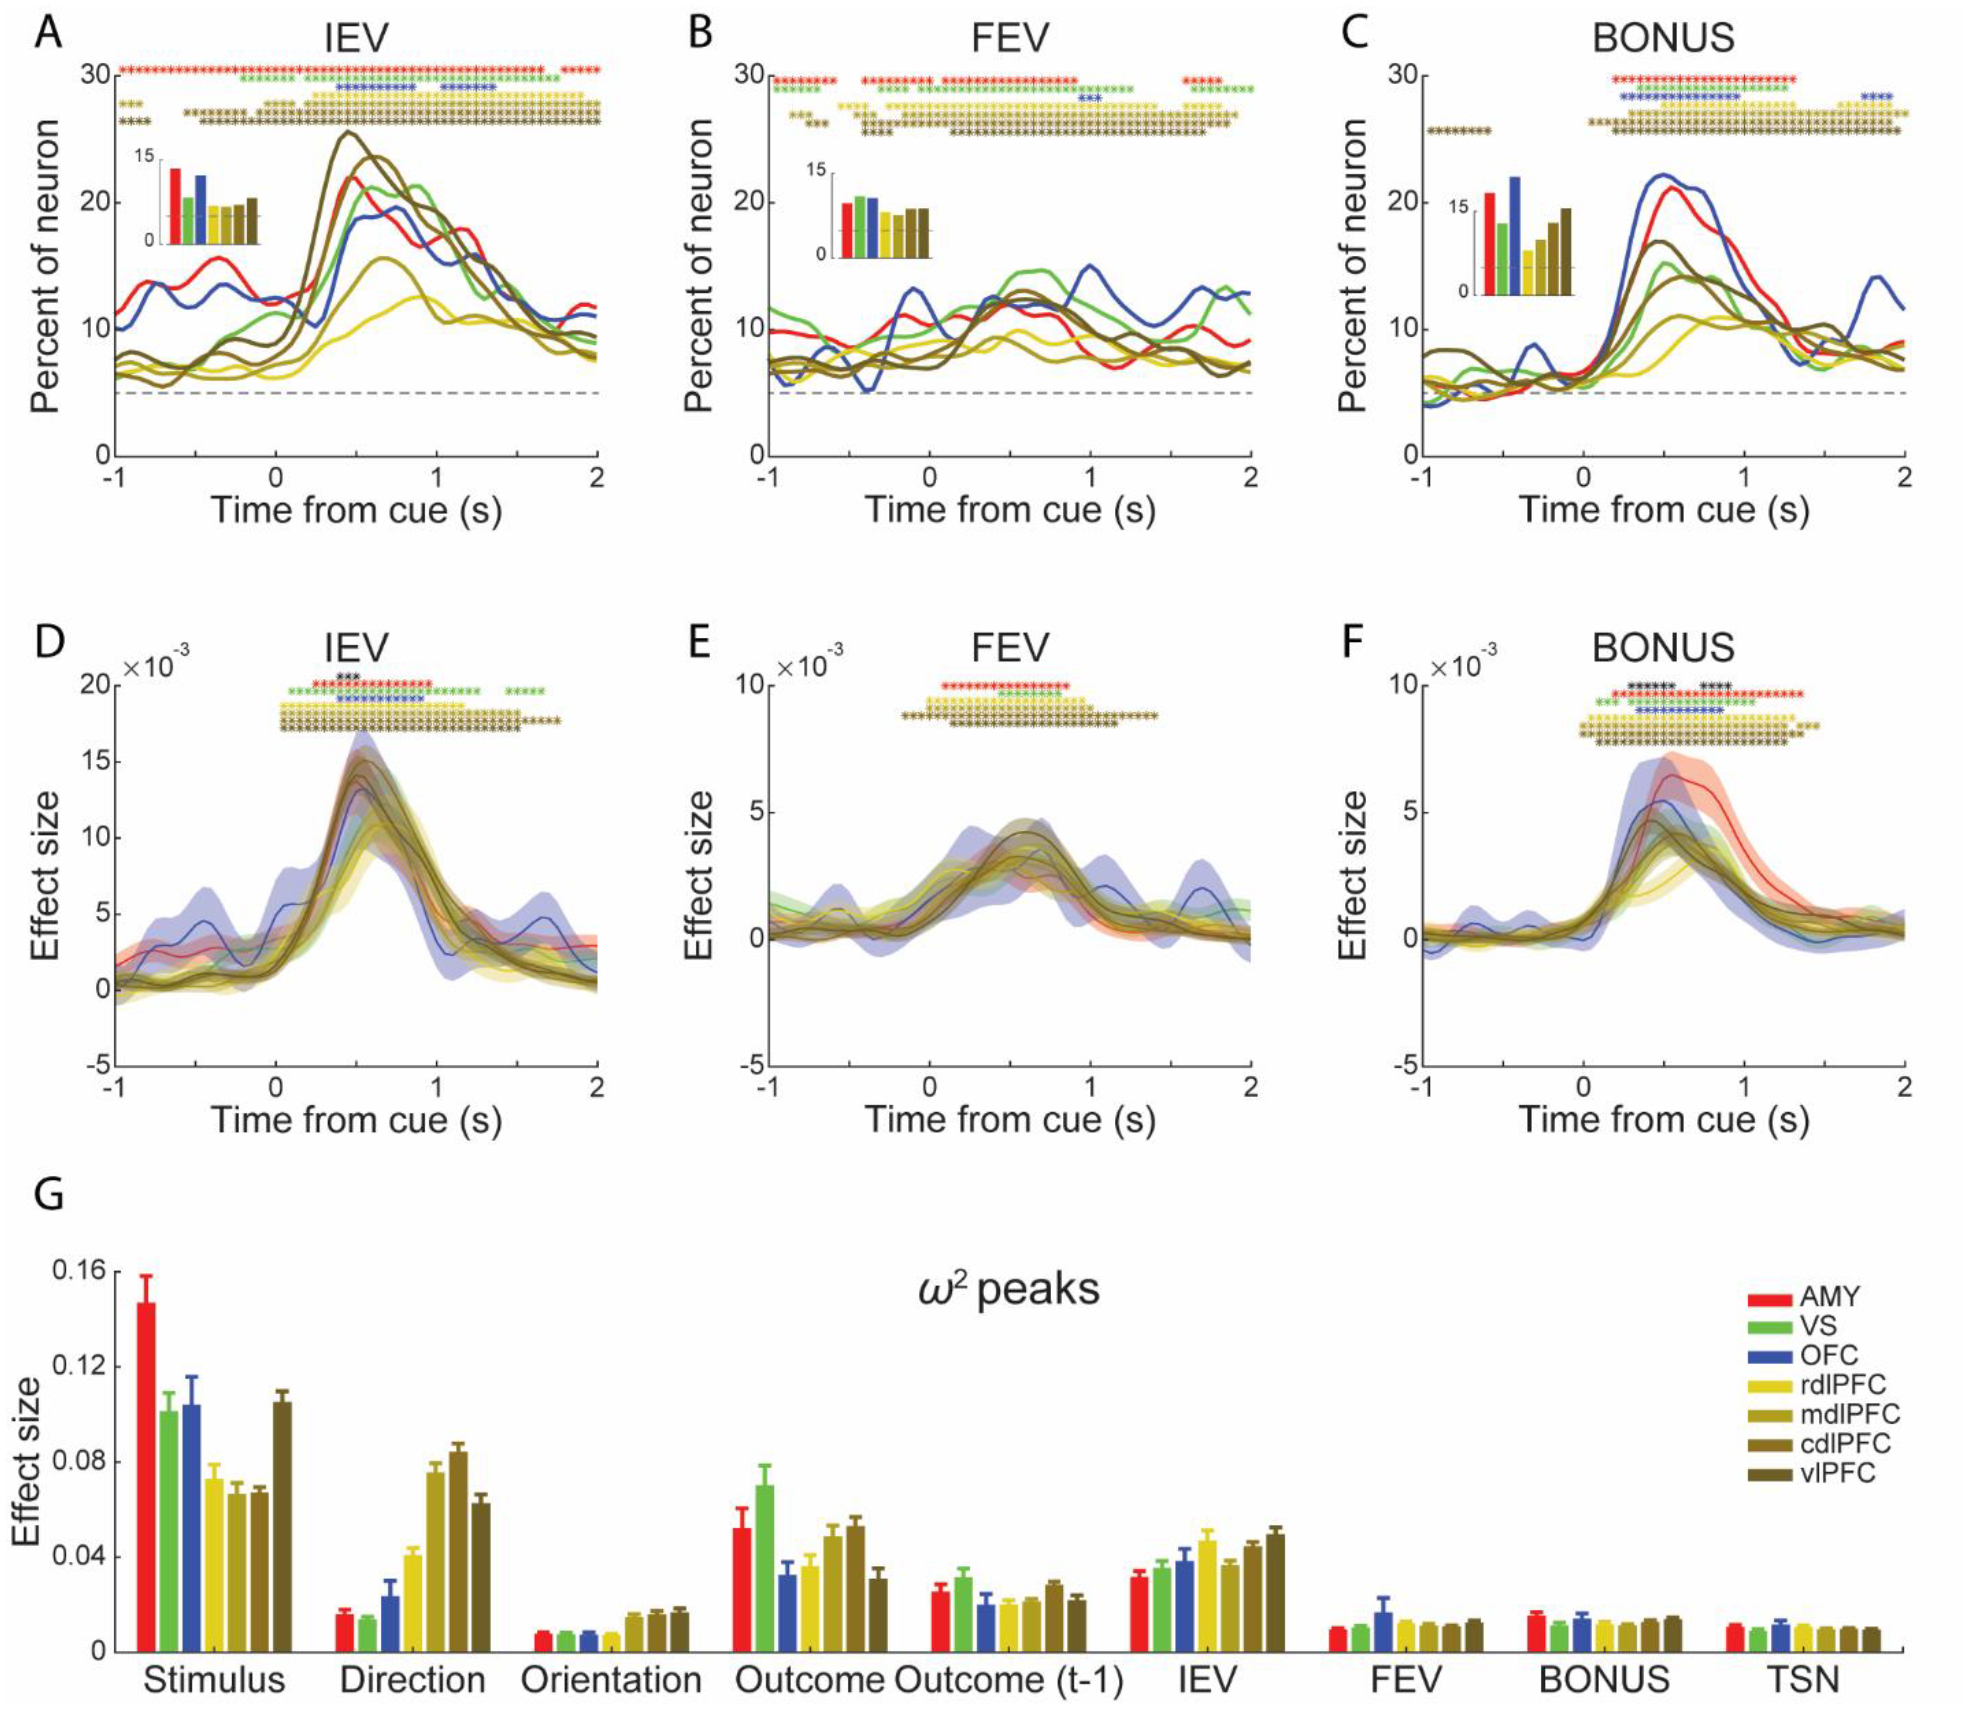
(A-C) Percentage of responsive neurons in each area encoding the IEV (A), FEV (B) and BONUS (C) of the chosen options. Insets: mean fraction of responsive neurons during the hold period for IEV (A), throughout the whole trial (-1000 to 2000 ms to stimulus onset) for FEV (B), during the following reward period for BONUS (C). Statistics for the between areas analyses (insets) are indicated in Table S2.
(D-F) Mean effect size (ω2) for the responsive neurons encoding the IEV (D), FEV (E) and BONUS (F) of the chosen options. Conventions are the same as Figure 4.
(G) Mean peak value of the effect size of the responsive neurons. Error bars represent mean ± SEM. The number of neurons used in the effect size analyses is indicated in Table S3.
Unlike the IEV, we found only a subtle phasic increase of FEV in the cdlPFC and vlPFC after the presentation of choice options, compared to hold period responses (Chi-square test, p < 0.05). Overall, the fraction of neurons encoding the FEV was constant across areas (Figure 5B inset, Table S2; Chi-square test, p > 0.05) but still above chance throughout the trial (Figure 5B; binomial test, p < 0.01). This result indicates that these areas represented the richness of the reward environment. There were no differences in effect size across areas (Figure 5E).
We observed a phasic increase in the exploration BONUS that started post-cue and peaked around trial outcome time (Figure 5C). A larger percentage of neurons in the amygdala and OFC encoded the BONUS (Figure 5C inset, Table S2; Chi-square test, p < 0.05). The effect sizes also varied among the areas (Figure 5F, black asterisks). Post hoc comparisons using the Tukey HSD test indicated that the effect size of amygdala neurons (M = 5.22 × 10⁻³, SD = 4.90 × 10⁻³) was significantly larger than neurons in the rdlPFC, mdlPFC and cdlPFC. We did not observe encoding of the exploration BONUS during the hold period before the stimuli were shown. This is likely because the BONUS was large in the first few trials, which may have driven much of the neural result (Figure 1H), and the monkeys could not anticipate the appearance of a novel option until it was presented.
To compare all the factors and effect sizes of task-responsive neurons across the areas, we calculated the peak values of effect size within the window of interest along the time course of a trial (Figure 5G for responsive neurons, Figure S3 for all neurons). The effect sizes varied among areas and factors (Figure 5G; Factor × Area, F (48, 11869) = 11.18, p < 0.001). Overall, factors related to sensory-motor processing (Stimulus, Direction), outcomes, and IEV had the largest effect sizes across all neural populations (Factor, F (9, 11869) = 169.80, p < 0.001. Post hoc comparisons using the Tukey HSD test, Stimulus, M = 0.095, SD = 0.029; Direction, M = 0.045, SD = 0.028; Orientation, M = 0.011, SD = 4.46 × 10⁻³; Outcome, M = 0.046, SD = 0.014; Outcome (t-1), M = 0.024, SD = 4.52 × 10⁻³; IEV, M = 0.041, SD = 6.61 × 10⁻³; FEV, M = 0.012, SD = 2.33 × 10⁻³; BONUS, M = 0.013, SD = 1.58× 10⁻³; TSN, M = 0.010, SD = 8.97 × 10⁻⁴). The amygdala, VS, OFC and vlPFC neurons showed a larger effect size for chosen Stimulus encoding (unpaired t-test, t (2337) = 11.13, p < 0.001) and the LPFC neurons showed a larger effect size for encoding Direction (unpaired t-test, t (2337) = 8.70, p < 0.001).
We also repeated the main single-cell analyses using only one session of PFC data per monkey to control for the possibility that the same cells were recorded on multiple days. This analysis showed similar results (Figure S4). Additional analyses examining the duration of response in each neuron confirmed that neurons across all areas showed the highest response to stimulus and outcome information and not choice values, both in the strength and duration of encoding (Figure S5).
Decoding of Choice and Outcome
To further understand how the neuronal populations code information about these variables, we used the activity of pseudo-populations to predict the choices the monkeys made and the related outcomes. We used pseudo-populations in the LPFC, even though we had simultaneous recordings, to facilitate comparisons with the other areas.
Although the individual visual stimuli were presented for a sufficient number of trials for univariate ANOVAs, they were often not presented for enough trials for decoding. Therefore, we carried out a decoding analysis on the a priori reward probability of the chosen options (i.e., low-, medium-, or high-value option). The performance was highest among the vlPFC and amygdala populations (Figure 6A). Decoding accuracy peaked at the trial outcome in some areas (Figure 6D), likely reflecting the outcome with which a priori reward is correlated and not the a priori reward itself, as these cannot be dissociated with decoding. However, the activity preceding the outcome reflects the expected value of the chosen option. In addition, decoding accuracy exceeded chance levels during both the hold period and after the stimuli were presented, indicative of learning (Figure 6D). In the hold period, the strength of representation of a priori reward was not significantly different across the areas (Figure 6G; Area, bootstrap test, p > 0.05). However, the learning-related effect in the amygdala (M = 0.50, SD = 0.04) was significantly larger than the other areas (bootstrap test, p < 0.05).
Figure 6. Decoding of choices and outcomes.
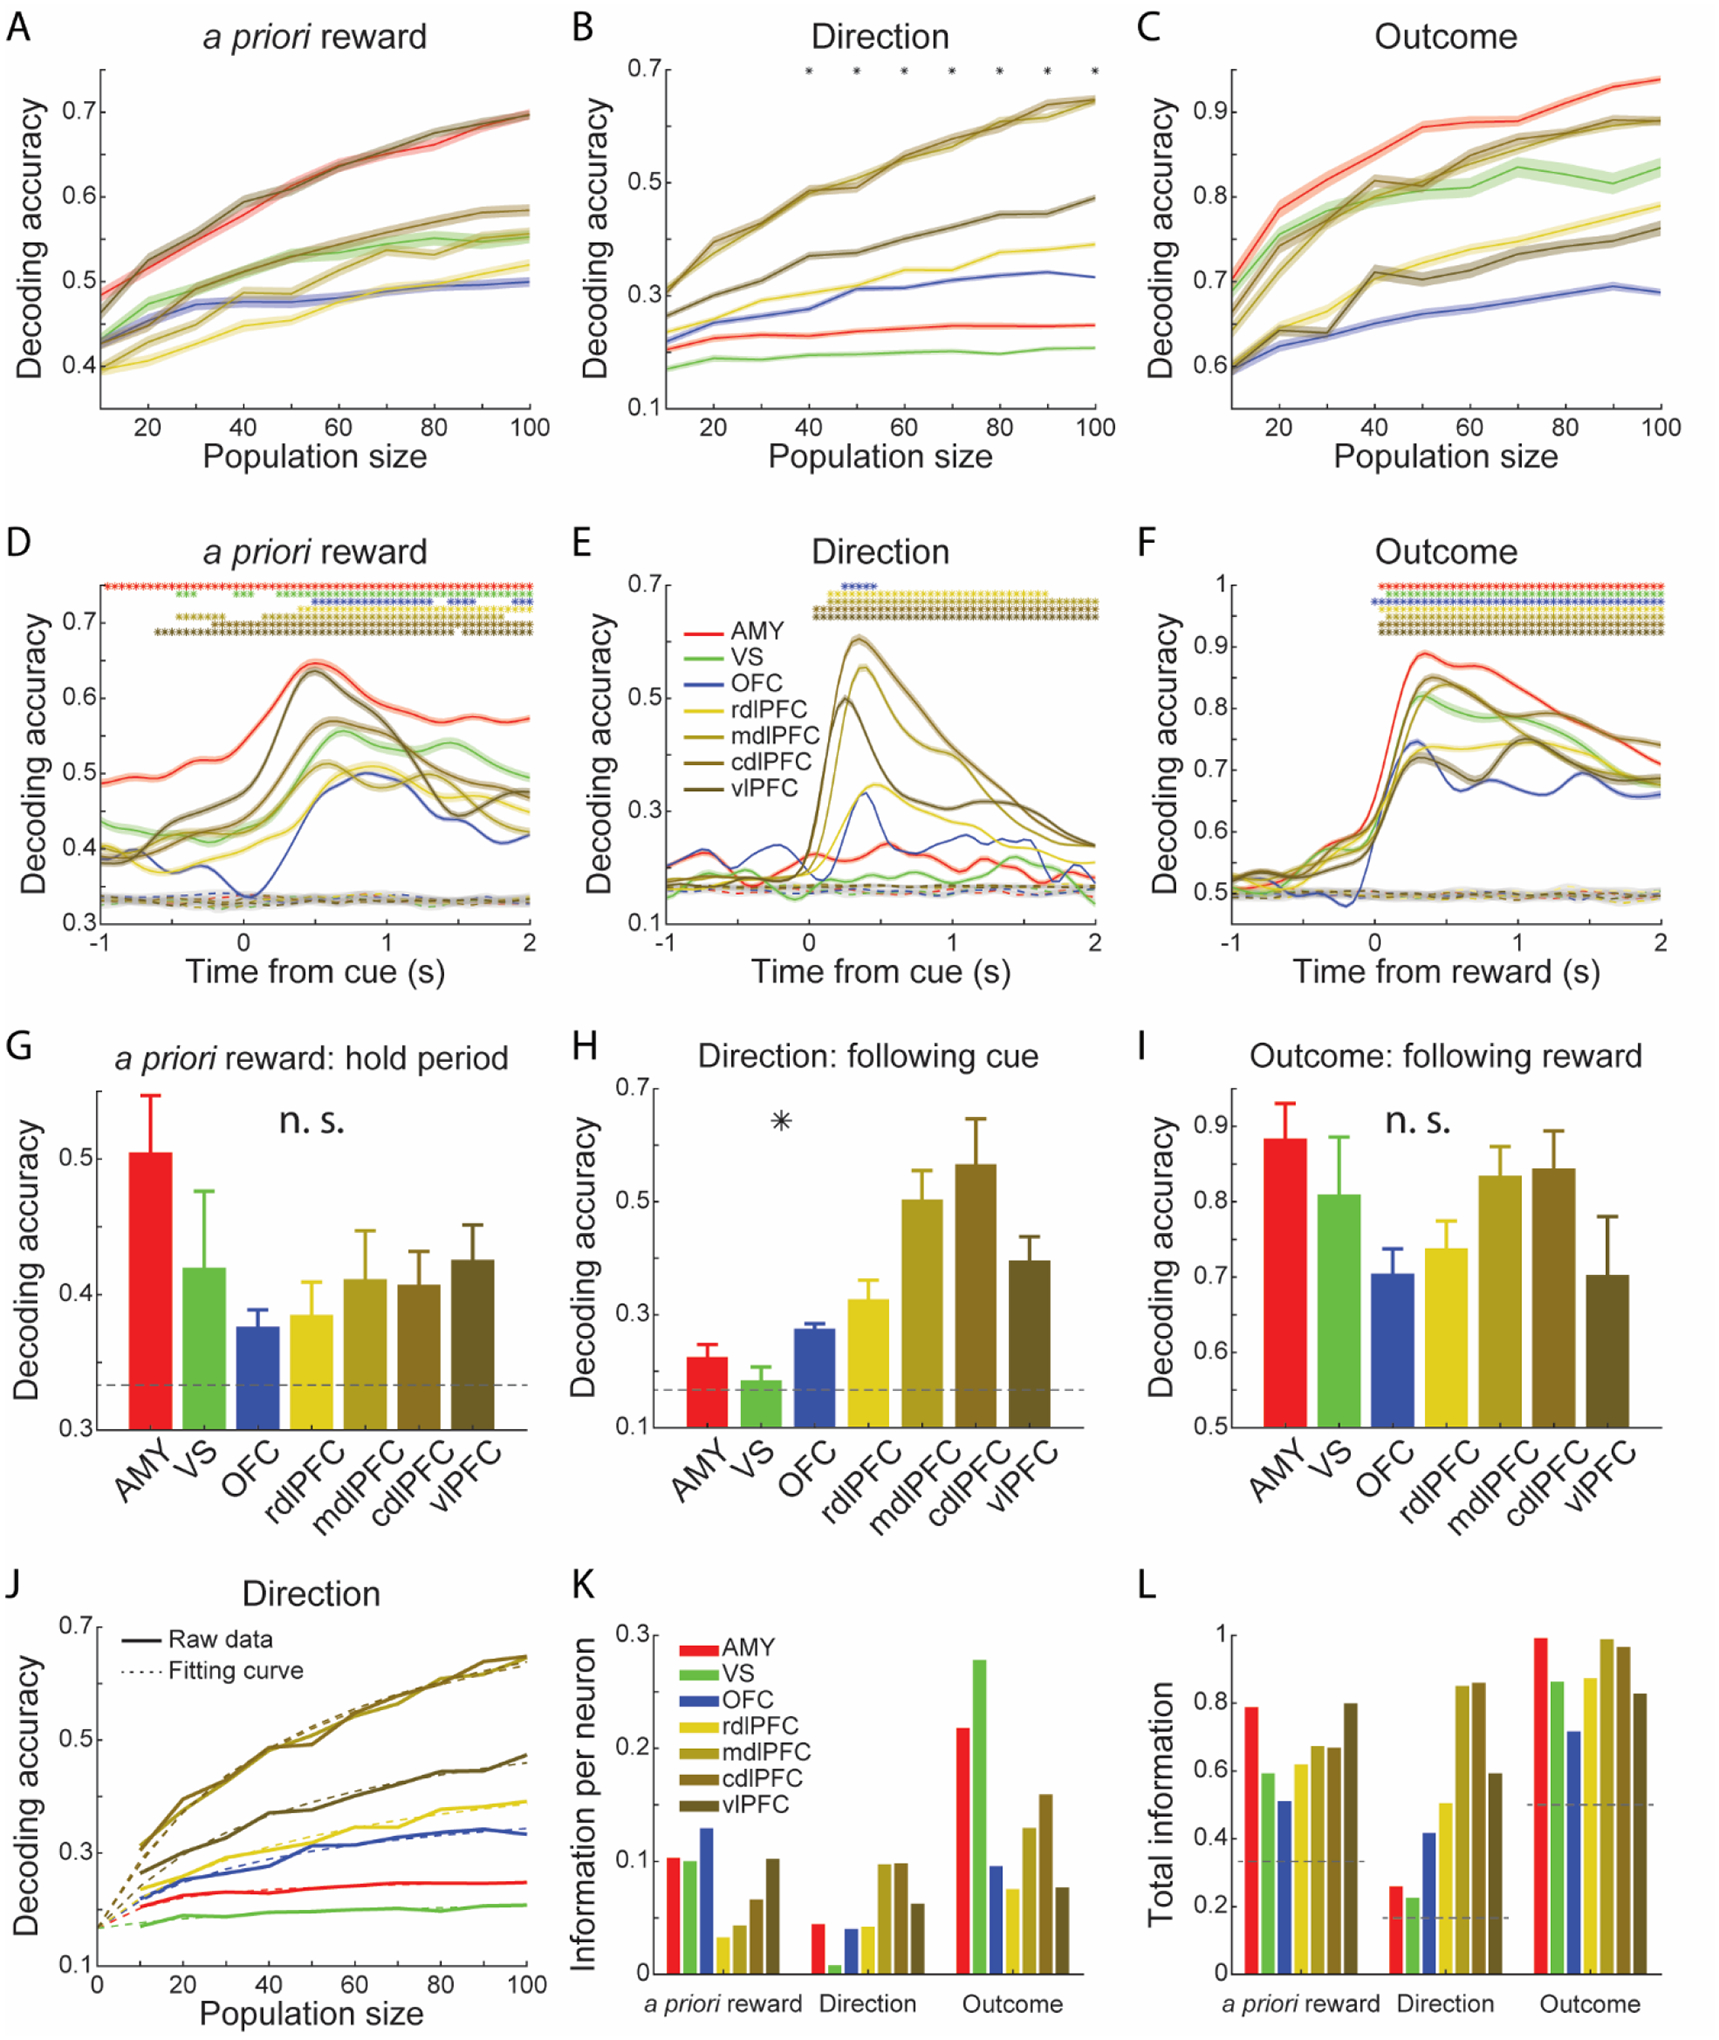
(A-C) Decoding accuracy in predicting the a priori assigned reward value of choices (A), saccade Direction (B), and Outcome on the current trial (C) as a function of pseudo-population size. The black asterisks at the top of the panel indicate a significant difference among the seven areas (bootstrap test, p < 0.05).
(D-F) Time course of mean decoding accuracy of a priori assigned reward value of choices (D), saccade Direction (E), and Outcome on the current trial (F) using a pseudo-population of 100 neurons. The colored asterisks indicate a significant difference (two sides Z-test, p < 0.05) between the decoding results and the shuffled data. Dashed lines represent the mean decoding accuracy of shuffled data. For simplicity, shaded zones in the line plots represent mean ± SEM, and standard deviations are indicated by the error bars in the bar plots (G-I). Results were averaged from 100 repetitions, n = 100.
(G-I) Decoding accuracy of a priori assigned reward value (G), saccade Direction (H), and current trial Outcome (I), averaged from the hold period (G), 250 to 750 ms since stimulus onset (G) or outcome onset (I). Bootstrap test; *p < 0.05, n. s. - not significant. Results were averaged from 100 repetitions, n = 100.
(J) Mean decoding accuracy of saccade Direction and the fitting curves based on the saturating function.
(K-L) Estimated parameters 1/a (K) and b + chance level (L), based on the saturating function. Dashed gray lines represent chance levels.
Next, we carried out decoding on the saccade Direction. Decoding accuracy was higher in the LPFC regions and increased with ensemble size (Figure 6B; Area, bootstrap test, p < 0.05). The cdlPFC had the highest decoding accuracy (Figure 6E), which confirmed our previous results on the flow of spatial information in the LPFC (Tang et al., 2021). There was less information about saccade Direction in the OFC and amygdala and almost no information in the VS (Figure 6H; Area, bootstrap test, p < 0.05), which was consistent with our encoding analysis (Figures 4B, S5B).
We also decoded the Outcome for comparison with the choice variables. Decoding accuracy also generally increased with ensemble size (Figure 6C). There was no significant difference across the areas (Figure 6I; Area, bootstrap test, p > 0.05).
To measure how much information each neuron carried in the population, we fitted decoding accuracy curves with a saturating function (Abbott and Dayan, 1999; Bartolo et al., 2020b; Zohary et al., 1994), which predicted accuracy as a function of ensemble size. Although this function was derived for information and not accuracy, we found that it provided a reasonable fit to our accuracy curves (Figure 6J). Therefore, it allowed us to summarize decoding accuracy using two variables. First, the rate at which accuracy increases with each additional neuron (Figure 6K, 1/a), and second, the decoding accuracy in an infinite population (Figure 6L, b; N = +∞). The variable 1/a, therefore, indicates the average relative contribution of single neurons, which changes as a function of how many neurons have already been included in the population to the accuracy. For a priori reward, similar to the effect size estimate analysis (Figure 4D), individual neurons in the amygdala, VS and OFC carried more information, although the vlPFC carried almost as much information as the amygdala and VS (Figure 6K). But when considering the extrapolated information in an infinite population, all areas encoded a similar amount of information about a priori reward (Figure 6L). Similar phenomena were also seen for the encoding of Outcome. For Direction, the results were consistent with what we reported above: less information was carried by the amygdala, VS and OFC, both in single neurons (Figure 6K) and a theoretical infinite population in each area (Figure 6L).
Neuronal Representation of Decision Switches
Our results indicate that the chosen stimulus was represented across the whole trial. It leaves open the question of when decisions were formed. To address this, we compared the neuronal representation of chosen stimuli across trials. First, we examined how often the monkeys switched their choices. The monkeys chose a different option from the previous trial on 57.65% (49110/85186) of all the trials. Considering the a priori reward probability of chosen options, the monkeys preferred to choose stimuli associated with a higher reward probability (Table S4; Chi-square test, p < 0.001). Then, we reran the ANOVA model using only trials in which the current choice was the same as (Stay) or different than (Switch) the previous choice. More neurons were significant for stimulus when the current choice was the same as the previous choice (Figure 7A; Chi-square test, p < 0.05). In these trials, since no switch of decision happened, the information of the to-be-chosen Stimulus was maintained across the whole trial period. In the trials in which the choice switched, we found more neurons significant for the stimulus chosen in the current trial than the stimulus chosen in the previous trial (Figure 7B; Chi-square test, p < 0.05). The difference appeared in the amygdala, rdlPFC, cdlPFC and vlPFC after the onset of the cues. These results indicate that although the to-be-chosen option was represented across the whole trial, the switch of decision happened after, but not before, the stimuli were presented to the monkeys. A caveat to this explanation is that a large fraction of switch choices happened in trials in which novel stimuli were introduced. Since the introduction of a novel stimulus could not be predicted, the switch in representation may reflect the choice of the novel option. Unfortunately, we did not have enough trials to obtain a clear result when we removed the first few novel trials from the analyses.
Figure 7. Neuronal representation of decision switches and available options.
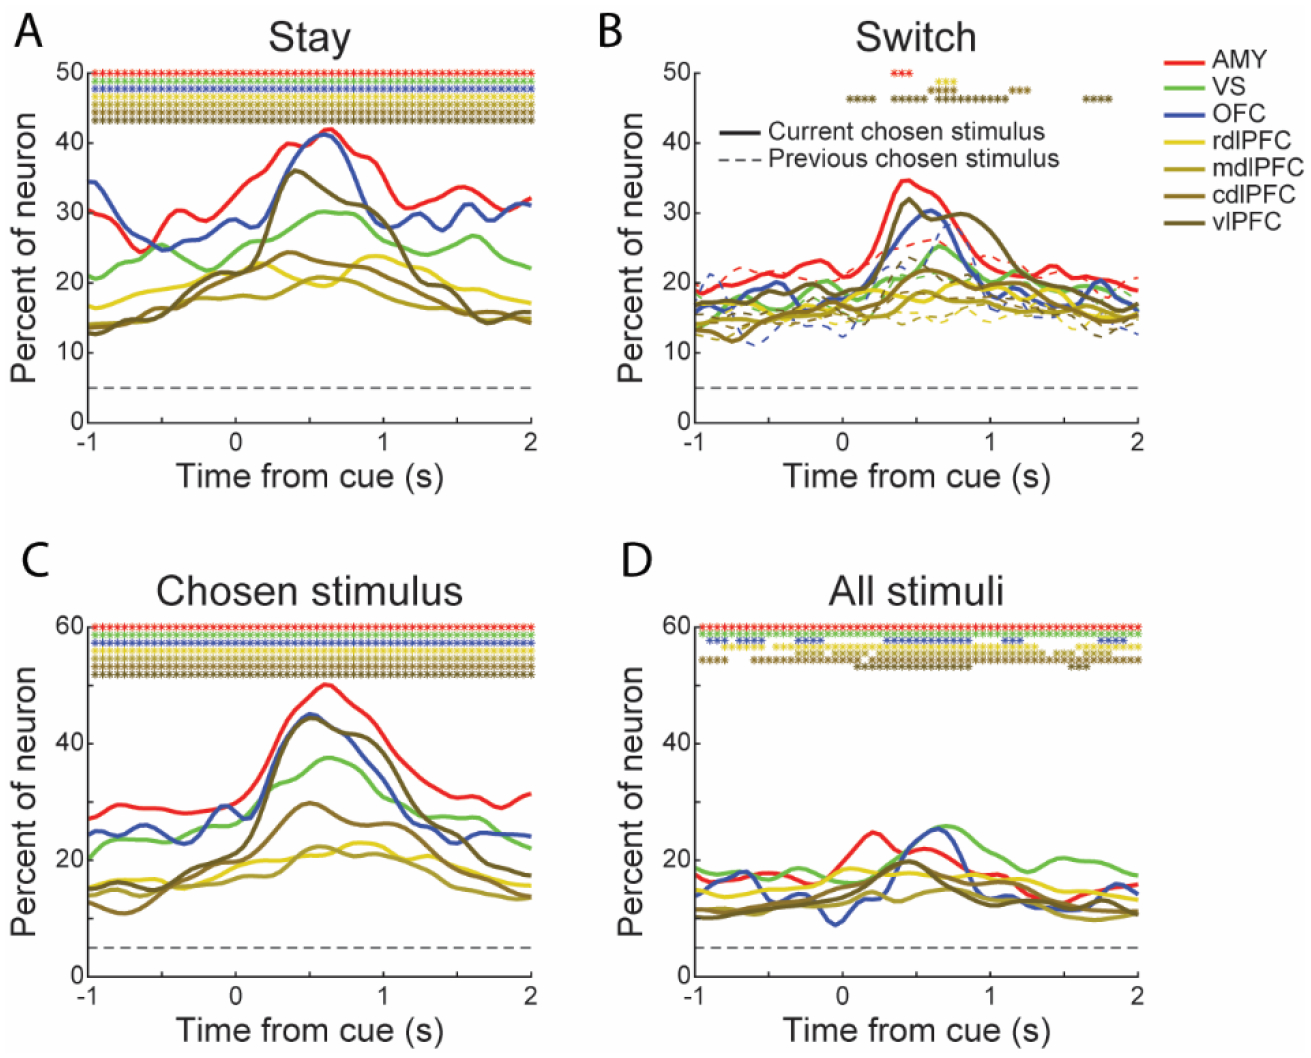
(A) Percentage of responsive neurons in each area encoding the chosen Stimulus when the current chosen Stimulus was the same as the chosen Stimulus on the previous trial (Stay). The dashed horizontal line represents chance level. The colored asterisks indicate a significant difference between the Stay and Switch (solid curves in Figure 7B) trials (Chi-square test, p < 0.01).
(B) Percentage of responsive neurons in each area encoding the chosen Stimulus when the current chosen Stimulus was different from the chosen Stimulus on the previous trial (Switch). Solid curves indicate the percentage of neurons encoding the current chosen Stimulus; the dashed curves indicate the percentage of neurons encoding the previous chosen Stimulus. The colored asterisks indicate a significant difference between the percentage of neurons that responded to the current and previous chosen Stimulus (Chi-square test, p < 0.01). Only the neuronal activity collected from the first 200 trials in each condition was used in these analyses.
(C-D) Percentage of responsive neurons in each area encoding the chosen Stimulus (C) and all stimuli presented to the monkeys (D) in the current trial. The colored asterisks indicate a significant difference between the corresponding area and chance level (binomial test, p < 0.01).
Neuronal Responses of Available Options
The behavioral factors that were tested in this study are mostly choice-dependent. Recent studies revealed that alternative choice options also affect the decision process during learning. The alternative outcomes are used as hypothetical outcomes to update the action value functions for unchosen actions (Abe and Lee, 2011; Lee et al., 2012). To examine the influence of other offered options on neuronal activity, we reran the ANOVA models by including an additional factor -- the reward configuration of all presented options (e.g., [0.8 0.8 0.2] and [0.8 0.5 0.2]) -- named “all stimuli” (Figures 7C–D). Neurons in the recorded areas showed responses to the available options across trials. The chosen stimulus still explains more variance than all stimuli, and the phasic response was only observed for the chosen stimulus. This result indicates that neurons across the circuitry examined also carry information about the available options, but what they care more about is the chosen option.
Neuronal Responses to Novelty Detection
We examined how the novel stimuli were represented in the ventral and dorsal circuits. The activity of a substantial proportion of neurons encoded the number of trials that a novel option had been presented when it was chosen (TSN) in the amygdala, VS, OFC and vlPFC (Figure S6A). Although the percentage of responsive neurons was different among these regions, the effect sizes of the neurons recorded in these regions were similar (Figure S6B).
We also analyzed the prediction of whether the monkey had chosen the novel, best or worst alternative option. Decoding accuracy generally increased with ensemble size (Figure S6C). In these regions, decoding accuracy peaked earlier in the vlPFC than in the other regions (Figure S6D). In the amygdala, VS, and LPFC regions, accuracy was highest when a novel option was introduced and declined over subsequent trials (Figure S6E). For example, in the amygdala, the decoding accuracy decreased incrementally across trials (Figure S6F; TSN, F (14, 1485) = 85.2, p < 0.0001)). Previous studies suggested that the anterior PFC is specialized for novelty detection (Dobbins and Wagner, 2005). However, our decoding analysis showed that the rdlPFC did not show strong coding for novelty (Figures S6C–D). Perhaps area 10 would show stronger novelty coding.
DISCUSSION
We examined the representation of visual stimulus, spatial-motor, choice value, and outcome information in the amygdala, VS, OFC, and multiple LPFC regions while monkeys carried out a three-armed bandit reinforcement learning task. We found that neurons recorded across these areas most strongly encoded visual stimulus, spatial-motor and outcome information. The values of choices were less robustly encoded across all areas. Information about the preferred stimuli, including the stimulus identity and value of the option, was maintained in the amygdala, VS and OFC between trials. When the stimuli were presented and the monkey made a choice, this information was represented in the LPFC regions along with spatial information necessary to acquire the chosen stimulus (Averbeck and Murray, 2020). These results indicate that, during learning, the learned value information is maintained throughout the ventral corticostriatal circuit. It then propagates through the dorsal circuit when a choice is made (Tang et al., 2021).
Ventral and Dorsal Streams in Reinforcement Learning
There is a topographic organization of the corticostriatal circuit that underlies goal-directed behavior (Alexander et al., 1986; Averbeck et al., 2014; Haber et al., 2006). We previously proposed that the circuit can be divided into ventral and dorsal circuits (Averbeck and Murray, 2020; Neftci and Averbeck, 2019). In the ventral circuit, temporal lobe structures, including the amygdala, hippocampus, and rhinal cortical areas, project to the ventromedial prefrontal cortex (vmPFC). Both the temporal lobe structures and vmPFC project to the VS, which projects to the ventral pallidum (VP), then to the medial portion of the mediodorsal (MD) thalamus, which projects back to the vmPFC (Friedman et al., 2002; Giguere and Goldman-Rakic, 1988). These areas also comprise most of the classically defined limbic system, which was originally defined as structures with connections to the hypothalamus (Maclean, 1952; Nauta, 1958; Papez, 1937). In the dorsal circuit, the inferior and medial parietal areas project to the dlPFC (Giarrocco and Averbeck, 2021). Both the inferior parietal cortex and dlPFC project to the dorsal striatum, which, considering only the direct pathway, projects to the globus pallidus internal segment (GPi), which then projects to the lateral portion of the MD thalamus, which projects back to the dlPFC. These two segregated frontal-striatal circuits approximately continue the organization of ventral and dorsal streams, which characterize the visual cortex (Ungerleider, 1982). Based on the anatomy and known properties of nodes in the cortical-subcortical circuits, we further suggested that the ventral circuit identifies goals, and the dorsal circuit orchestrates behavior to achieve those goals (Averbeck and Murray, 2020; Neftci and Averbeck, 2019). This suggestion that portions of the dorsal circuit are important for orchestrating actions has been put forward previously by several groups (Cisek and Kalaska, 2010; Goodale and Milner, 1992; Yoo and Hayden, 2018).
The results of this experiment support this hypothesis. During the hold period, before the stimuli were presented to the monkeys, neurons in the amygdala, VS and OFC encoded the identity of the to-be-chosen stimulus. They also encoded the stimulus with a larger effect size. This indicates that these areas, which are parts of the ventral circuit, maintain the identity of the stimulus that will be chosen in the subsequent trial. Although these mono-synaptically connected areas help identify the goals and hold information throughout the intertrial interval and fixation period, they also encode other information. The amygdala and OFC participated in holding the value of the to-be-chosen stimulus, reflected in the encoding of IEV. The amygdala and VS also participated, although weakly, in encoding the state value during learning, reflected in the encoding of FEV. The amygdala also strongly encoded the expected outcome, reflected in the decoding analysis of a priori reward.
When the choice options were presented, the monkey had to identify the location of the preferred stimulus and direct an eye movement towards it. At this point, the identity of the visual stimulus and the associated value information that had been represented in the ventral circuit were routed through the dorsal circuit, evidenced by robust phasic responses to these factors at the time of choice. The LPFC neurons also responded with a phasic burst of activity related to the location of the chosen option. Among the prefrontal areas, the vlPFC showed the strongest encoding of stimulus identity, consistent with previous research showing that vlPFC transforms goals into relevant actions (Cai and Padoa-Schioppa, 2014; Tang et al., 2021). In our previous work, we identified information flow from objects to actions, from the vlPFC to dlPFC (Tang et al., 2021). The amygdala has strong projections to the vlPFC (Ghashghaei et al., 2007), and therefore, this circuit may be one of the routes by which information represented in the ventral circuit is routed to the dlPFC to direct an eye movement to the relevant location.
Our data also suggests that choice processes, as they are normally represented in RL models (Frank, 2005), do not occur at the time of stimulus presentation, at least in multi-armed bandit tasks in which all options are presented in each trial. We found an elevated representation of the stimulus which the monkey would choose throughout the inter-trial interval and baseline hold period. Therefore, the monkey had effectively made the choice before the options were presented. The elevated activity predicting the stimulus was seen even in the dorsal circuit, although it was not as robust as it was in the ventral circuit. Similar results have been seen previously in the dorsal system for spatial choice (Averbeck and Lee, 2007; Seo et al., 2012). The monkeys did often switch their choices from one trial to the next, and our analyses suggest that this switch was more likely to have occurred after the stimuli were presented rather than during the inter-trial interval. But these results are likely highly dependent on our task design. In experiments in which monkeys cannot predict which stimuli they will see from trial to trial, this process might be different (Rudebeck et al., 2013; Rudebeck et al., 2017; Taswell et al., 2018).
After the goal had been chosen, all areas responded robustly to the reward outcome (Vickery et al., 2011). Interestingly, the phasic response to the outcome first appeared in the OFC, after which the signal was consistently represented in the other areas. Thus, it suggests that the OFC leads other areas in the frontal-striatal circuit that signal expected outcomes during learning, as was indicated by previous studies (Gottfried et al., 2003; Stalnaker et al., 2021).
These hypotheses are consistent with previous hypotheses that have been put forward for ventral and dorsal circuit nodes (Yoo and Hayden, 2018). For example, OFC and amygdala are thought to underlie choice value representations during decision making (Blanchard et al., 2015; Chau et al., 2015; Padoa-Schioppa and Assad, 2006; Rudebeck et al., 2017; Schoenbaum et al., 1998; Wallis and Miller, 2003). However, within the context of decision making, the goal is not apparent until the options are presented on the screen, leading to a dynamic decision process at the time of choice. Our study extends these hypotheses to situations in which the goals have been defined by learning, and therefore can be represented internally. Furthermore, extensive work has shown that the dorsal system is important for spatial attention and working memory processes (Akhlaghpour et al., 2016; Bichot et al., 2019; Constantinidis et al., 2001). We here integrate these ideas within an RL framework and compare the dynamics of goal representation, including non-spatial aspects of goals (i.e., the specific visual stimulus), between ventral and dorsal system structures.
Functional Organization of the LPFC
In related work, we have recently shown a substantial caudo-rostral gradient for the representation of objects and spatial information in the LPFC (Tang et al., 2021). The neuronal populations in the caudal LPFC showed stronger encoding and a shorter response latency than the rostral LPFC populations for both object and spatial information. The analyses on the representation of chosen stimulus and direction information in the current study confirmed the finding in a second behavioral task collected from the same animals. Most studies supporting a caudo-rostral organization of the LPFC have suggested that the rostral part of the PFC processes more abstract rules (Badre and D’Esposito, 2009) or carries out domain-general feature integration operations (Courtney, 2004). In our previous study, we examined the caudo-rostral representation of an abstract rule that defined the relevant learning dimension. However, we did not find an enriched representation more rostrally (Tang et al., 2021). In the current study, value information is also a type of abstract information maintained by the monkeys. Similar to the representation of sensory and action information, phasic increases in value information encoding also occur along the caudo-rostral axis of the LPFC. Along the caudo-rostral axis, more neurons in more caudal areas participate in the encoding of learned value information, including the IEV, FEV, and exploration BONUS. This result further supports the hypothesis that the apex of the prefrontal hierarchy resides in the medial LPFC rather than the rostral LPFC (Goulas et al., 2014; Power et al., 2011).
Conclusion
In conclusion, we found that learned value information specifying behavioral goals was maintained throughout the ventral corticostriatal circuit, and it was routed through the dorsal corticostriatal circuit to direct an eye movement to achieve the goal when a choice was made. This supports the hypothesis that the ventral corticostriatal circuit defines behavioral goals, and the dorsal circuit generates actions to obtain those goals.
Limitations of the study
There are several limitations to our results. First, different recording technologies were used for the ventral and dorsal system areas. Although we have shown that the different methods do not change our main conclusions, it is possible that the different methods have contributed to some of the differential signals between ventral and dorsal circuits. Second, we haven’t sampled evenly from the ventral and dorsal networks, and only the LPFC regions were recorded for the dorsal network. Although we have recorded neurons from the dorsal striatum in the past (Seo et al., 2012), we did not do so in the current study. In the previous study, we compared the dlPFC to caudate in a sequence learning task. We found that the caudate and dlPFC carry many of the same signals, which are consistent with the direction signals we see in the current study. We are currently carrying out additional experiments looking at the integration of signals within ventral and dorsal circuits, and therefore we will record from more of these structures in the future.
STAR METHODS
RESOURCE AVAILABILITY
Lead contact
Further information and requests for resources and reagents should be directed to and will be fulfilled by the lead contact, Bruno B. Averbeck (bruno.averbeck@nih.gov).
Materials availability
This study did not generate new unique reagents.
Data and code availability
The datasets supporting the current study have been deposited at Mendeley.com and are publicly available as of the date of publication. DOIs are listed in the key resources table.
KEY RESOURCES TABLE
| REAGENT or RESOURCE | SOURCE | IDENTIFIER |
|---|---|---|
| Deposited data | ||
| Raw dataset and analysis code | This paper | doi: 10.17632/zwt3kwv4xk.1 |
| Experimental models: Organisms/strains | ||
| Rhesus macaques (Macaca mulatta) | NIMH/NIH | N/A |
| Software and algorithms | ||
| MATLAB R2020b | MathWorks Inc. | https://www.mathworks.com/products/matlab.html |
| Monkeylogic | NIMH/NIH | https://monkeylogic.nimh.nih.gov/about.html |
| Adobe Illustrator 2021 | Adobe | https://www.adobe.com/products/illustrator.html |
| Other | ||
| Utah array | BlackRock Microsystems | https://blackrockneurotech.com/research/products/#electrodes |
| Microelectrode | FHC | https://www.fh-co.com/product/metal-microelectrodes/ |
| Microelectrode | Alpha Omega | https://www.alphaomega-eng.com/Acute-Electrode-2-2 |
All original code has been deposited at Mendeley.com and is publicly available as of the date of publication. DOIs are listed in the key resources table.
Any additional information required to reanalyze the data reported in this paper is available from the lead contact upon request.
EXPERIMENTAL MODEL AND SUBJECT DETAILS
The experiments were performed on five (two for chronic recording, three for acute recording) adult male rhesus macaques (Macca mulatta), weighing 6.7 – 9.3 kg, and 5 – 8 years old. The monkeys were pair-housed when possible, and they had access to food 24 hours per day. On testing days, the monkeys were placed on water control and earned their juice through performing the task. On non-testing days the monkeys were given ad libitum access to water. Experimental procedures for all monkeys were performed following the Guide for the Care and Use of Laboratory Animals and were approved by the National Institute of Mental Health Animal Care and Use Committee.
METHOD DETAILS
Experimental Setup
Monkeys were trained to perform a saccade-based three-armed bandit task. Stimuli were presented on a 19-inch LCD monitor situated 40 cm from monkey eyes. During training and testing, the monkeys sat in a monkey chair with their heads restrained. Stimulus presentation and behavioral monitoring were controlled by Monkeylogic (Hwang et al., 2019). The movement of eyes was monitored at 400 fps using Viewpoint eye tracker (Arrington Research, Scottsdale, AZ) and sampled at 1 kHz. A fixed amount of apple juice was delivered through a pressurized plastic tube gated by a solenoid valve on rewarded trials.
Behavioral Task
The three-armed bandit reinforcement learning task (Figures 1A–B) was previously used (Costa et al., 2019; Costa et al., 2014). It is based on a multi-armed bandit task used in human studies of explore-exploit behavior (Averbeck et al., 2013; Djamshidian et al., 2011; Wittmann et al., 2008). On each trial, the monkey had to first acquire and hold central fixation for 500–750 ms. Then, three images were presented at the vertices of a triangle. The main vertex of the triangle was either pointed up or down (Figure 3B) and was randomized from trial to trial. The animals were required to saccade to one of the images and maintain the fixation for 500 ms. After that, a juice reward was delivered probabilistically.
Each session has multiple sets (108 sets for chronic recordings, 32 sets for acute recordings). In each set, a novel image was introduced. It randomly replaced one of the existing images. Each single choice option could be presented for no more than 160 consecutive trials. The trial interval between the introduction of two novel images followed a discrete uniform distribution, j ∈ [10, 30]. At the start of a session, the three initial images were randomly assigned a reward probability of 0.2, 0.5 or 0.8. Novel images were also randomly assigned one of these reward probabilities when they were introduced. The assigned reward probabilities were fixed for each image. No more than two of the three images in the same set could be assigned the same reward probability.
Neurophysiological Recordings
Three monkeys were implanted with 28 × 36 mm recording chambers to allow bilateral vertical grid access to the amygdala, VS and OFC (Figure 1C), which has been described in detail previously (Costa and Averbeck, 2020; Costa et al., 2019). Chamber placements were planned and verified through magnetic resonance imaging (MRI). We recorded from each structure simultaneously using single tungsten microelectrodes (FHC, Inc. or Alpha Omega, 0.8 – 1.5 MΩ at 1 kHz). Up to four electrodes were lowered into each structure simultaneously. The electrodes were advanced to their target location by an 8-channel micromanipulator (NAN Instruments, Nazareth, Israel) attached to the recording chamber. Multi-channel spike recordings were acquired with a 16-channel data acquisition system (Tucker Davis Technologies, Alachua, FL). Extracellular signals were amplified, filtered (0.3 – 8 kHz), digitized at 24.4 kHz, and saved for offline sorting. Offline sorting was based on principal-components analysis, visually differentiated waveforms, and inter-spike interval histograms.
The other two monkeys were implanted with eight Utah arrays (BlackRock Microsystems, Salt Lake City, UT) over the LPFC, surrounding the principal sulcus (Figure 1C). Four 96-electrode (10 × 10 layout) arrays were implanted in each hemisphere (Tang et al., 2021). Details of the surgery and implant design have been described previously (Mitz et al., 2017). Neurophysiology recordings began after the monkeys had recovered from the surgery. Signals were collected using the Grapevine System (Ripple, Salt Lake City, UT). The recording system consisted of two Neural Interface Processors (NIPs). Each NIP included 384 channels and was connected to four Utah arrays. The spike acquisition threshold was set at a 4.5 × root mean square (RMS) of the baseline signal for each electrode. Behavioral event markers from MonkeyLogic and eye-tracking signals from Viewpoint were split and sent to each Ripple box. The raw extracellular signals were high-pass filtered (1 kHz cutoff) and digitized at 30 kHz to acquire the single-unit activity. Spikes were sorted offline via MKsort (https://github.com/ripple-neuro/Mksort).
It has been revealed that acute recordings are biased towards high firing, task-responsive, pyramidal neurons, and the electrodes in the Utah array are all the same length, causing neurons to be recorded from the same layer (Nurmikko, 2020). It could be possible that the different recording methods have contributed to the differential signals between ventral and dorsal circuits. Our results confirmed that the recording method affected the selection of neurons. Acute recordings biased higher firing neurons (Figure S7A). However, the z-scored activity for these neuron populations didn’t show much difference (Figure S7B). We used z-scored activity in most of our analysis, including neuronal activity presentation and ANOVA models. We found the different recording methods do not change our main conclusions for the following reasons. 1) Fewer acute-recorded neurons responded to task factors, which does not match the expectation of acute recording bias more task-relevant neurons. 2) We carried out decoding of choice outcomes as a control. Decoding accuracies among the areas were similar to each other.
QUANTIFICATION AND STATISTICAL ANALYSIS
Choice behavior
We quantified choice behavior during the task in two ways. We computed the possibility that the monkey chose either the novel choice option, best or worst alternative option, up to 20 trials after a novel option was introduced. The best alternative option was defined as the remaining option with the highest IEV. In cases the remaining alternative options had equivalent IEVs, the best alternative was defined as the option with the higher action value as estimated by the POMDP model. We also computed the fraction of times the monkeys chose the novel option based on their a priori assigned reward probabilities.
Partially Observable Markov Decision Process Model
We modeled the task using an infinite horizon, discrete-time, discounted, partially observable Markov decision process (POMDP), details of which were published previously (Averbeck, 2015; Costa et al., 2019). The utility, u, of a state, s, at time t is
where is the set of available actions in state s at time t, r(st, a) is the reward that will be obtained in state s at time t if action a is taken. The summation on j is taken over the set of possible subsequent states, s at time t + 1. It is the expected future utility, taken across the transition probability distribution p(j|st, a). The transition probability is the probability of transitioning into each state j from the current state, st if one takes action a. The γ term represents a discount factor, set to 0.99 for the current analyses. The terms inside the curly brackets are the action value, Q(st, a) = r(st, a) + γ Σj∈S p(j|st, a)ut+1(j), for each available action.
Neural data
To present the general feature of neural activity across brain areas, all trials on which monkeys chose one of the three stimuli were analyzed. Trials with the monkey broke fixation, failed to make a choice, or attempted to saccade to more than one target were excluded. On valid trials, the firing rate of each neuron was computed in 200 ms bins, advanced in 50 ms increments, time-locked to the onset of stimulus or outcome.
To identify the neurons’ response to different task components, we fitted a sliding window ANOVA model to windowed spike counts, with 200 ms bins and 50 ms steps. Factors, including chosen stimulus (Stimulus), saccade direction (Direction), the orientation of the stimulus set (Orientation), linear trial number since the latest novel option was introduced (TSN), the outcome of the current (Outcome) and previous trial (Outcome (t-1)), and the choice values (IEV, FEV, BONUS) were used in the model. IEV was modeled as two factors, the a priori reward probability of the chosen option (i.e., 0.2, 0.5 or 0.8, modeled as a fixed effect) and the difference between the current estimate of reward and the chosen IEV value, which modeled the learning of value. A neuron was considered responsive to IEV when either of the two factors reached half of the normal significance level (i. e., α = 0.025). The chosen Stimulus was nested under a priori reward probability. The Direction was nested under Orientation. IEV, FEV, BONUS and TSN were continuous factors. All the other factors were modeled with factor levels. To facilitate comparison across brain areas (Figure S1), only the first 600 trials in each session were used in the ANOVA model.
Task-responsive neurons
Significant encoding for each factor at each time bin was evaluated at p < 0.05. A neuron that showed a significant response to a factor in no less than three continual bins in the ANOVA model was confided to be a responsive neuron to that specific factor. The time window of interest was -1000 to 0 ms to the onset of stimulus for factor Outcome (t-1), 0 to 1000 ms to the onset of outcome for factor Outcome, and 0 to 1000 ms to the onset of stimulus for the rest factors. The binomial test was applied to test whether the fraction of responsive neurons is significantly above chance level (5%). The Chi-square test was used to compare the proportions of responsive neurons between different pairs of brain areas.
Effect size
We also computed the effect size, omega-squared, for each factor from the ANOVA model output. Omega-squared is an unbiased estimator of the amount of variance in neural activity explained by each task factor, ranges between -1 and 1 (Olejnik and Algina, 2000), given by:
Here, dfeffect represents the degrees of freedom associated with the factor, MSeffect represents the mean squares, MSerror is the mean squared error, SStotal is the sum of squares of all factors.
Decoding analyses
The decoding analyses were carried out on pseudo-populations of neurons that were, mostly, not recorded simultaneously. We assembled pseudo-populations of neurons recorded across recording sessions and decoded either the a priori reward probability of the chosen stimulus (i.e., 0.2, 0.5, or 0.8), saccade Direction (i.e., six locations), or Outcome (i.e., rewarded or not rewarded) on the current trial. For each cell, we used the first 300 trials across all the conditions. Analyses were carried out using leave-one-trial-out cross-validation. The model was fitted with the remaining trials and tested on the trial that held out of the analysis. The neurons used in the decoding analyses were assembled by sampling, without replacement, from the larger population pseudo-randomly. The decoding accuracy was computed in 200 ms bins, advanced in 50 ms increments, and time-locked to either the onset of stimulus or outcome.
For the decoding analyses, Z-test was applied to test significant differences between the actual results and the shuffled results. The shuffled results were calculated with the same neurons and trials used in the actual data, but with the trial order shuffled across different conditions. The actual data with a mean outside the 95% confidence interval of the shuffled data was confided showed a significant response. The variability of each decoding accuracy across different areas was estimated using a bootstrap procedure. According to the null hypothesis, we generated data with no differences among the areas by sampling with replacement from the combined set of all areas. All the null bootstrap sets contained combinations of trials from all seven areas. We then calculated the F-value, between-group variability divided by within-group variability, for each bootstrap trial set. We did this 1000 times. It gave us 1000 different sampled F-values from the null distribution. We then compared the F-value of the actual data to the F-values in the null distribution. If the actual F-value is in the 95% confidence interval of the null distribution, it means the decoding accuracy is significantly different among the areas (i.e., p < 0.05).
Influence of ensemble size
Decoding analyses of different ensemble sizes were performed using the average activity of pseudo-population neurons, with 100 times repetition. The activity of each neuron was the mean firing rate during 250 to 750 ms (i.e., 500 ms bin) after stimulus onset (for a priori reward and Direction) or outcome onset (for Outcome).
Projection of information to neuron populations
We estimated the amount of information in an ensemble of different sizes by using the decoding accuracy as a function of ensemble size to fit the saturating function (Abbott and Dayan, 1999; Zohary et al., 1994) as follows:
Where is the predicted decoding accuracy (minus chance level), N is the ensemble size, b is the asymptotic information, and a is the saturation rate.
Supplementary Material
ACKNOWLEDGMENTS
This work was supported by the Intramural Research Program of the National Institute of Mental Health (ZIA MH002928).
Footnotes
DECLARATION OF INTERESTS
The authors declare no competing interests.
REFERENCES
- Abbott LF, and Dayan P (1999). The effect of correlated variability on the accuracy of a population code. Neural Comput 11, 91–101. 10.1162/089976699300016827. [DOI] [PubMed] [Google Scholar]
- Abe H, and Lee D (2011). Distributed coding of actual and hypothetical outcomes in the orbital and dorsolateral prefrontal cortex. Neuron 70, 731–741. 10.1016/j.neuron.2011.03.026. [DOI] [PMC free article] [PubMed] [Google Scholar]
- Akhlaghpour H, Wiskerke J, Choi JY, Taliaferro JP, Au J, and Witten IB (2016). Dissociated sequential activity and stimulus encoding in the dorsomedial striatum during spatial working memory. Elife 5, e19507. 10.7554/eLife.19507. [DOI] [PMC free article] [PubMed] [Google Scholar]
- Alexander GE, DeLong MR, and Strick PL (1986). Parallel organization of functionally segregated circuits linking basal ganglia and cortex. Annu. Rev. Neurosci 9, 357–381. 10.1146/annurev.ne.09.030186.002041. [DOI] [PubMed] [Google Scholar]
- Andermann ML, and Lowell BB (2017). Toward a Wiring Diagram Understanding of Appetite Control. Neuron 95, 757–778. 10.1016/j.neuron.2017.06.014. [DOI] [PMC free article] [PubMed] [Google Scholar]
- Andersen RA, Snyder LH, Bradley DC, and Xing J (1997). Multimodal representation of space in the posterior parietal cortex and its use in planning movements. Annu. Rev. Neurosci 20, 303–330. 10.1146/annurev.neuro.20.1.303. [DOI] [PubMed] [Google Scholar]
- Averbeck B, and O’Doherty JP (2021). Reinforcement-learning in fronto-striatal circuits. Neuropsychopharmacology 10.1038/s41386-021-01108-0. [DOI] [PMC free article] [PubMed] [Google Scholar]
- Averbeck BB (2015). Theory of choice in bandit, information sampling and foraging tasks. PLoS Comput. Biol 11, e1004164, e1004164. 10.1371/journal.pcbi.1004164. [DOI] [PMC free article] [PubMed] [Google Scholar]
- Averbeck BB, Djamshidian A, O’Sullivan SS, Housden CR, Roiser JP, and Lees AJ (2013). Uncertainty about mapping future actions into rewards may underlie performance on multiple measures of impulsivity in behavioral addiction: evidence from Parkinson’s disease. Behav. Neurosci 127, 245–255. 10.1037/a0032079. [DOI] [PMC free article] [PubMed] [Google Scholar]
- Averbeck BB, and Lee D (2007). Prefrontal neural correlates of memory for sequences. J. Neurosci 27, 2204–2211. 10.1523/JNEUROSCI.4483-06.2007. [DOI] [PMC free article] [PubMed] [Google Scholar]
- Averbeck BB, Lehman J, Jacobson M, and Haber SN (2014). Estimates of projection overlap and zones of convergence within frontal-striatal circuits. J. Neurosci 34, 9497–9505. 10.1523/JNEUROSCI.5806-12.2014. [DOI] [PMC free article] [PubMed] [Google Scholar]
- Averbeck BB, and Murray EA (2020). Hypothalamic Interactions with Large-Scale Neural Circuits Underlying Reinforcement Learning and Motivated Behavior. Trends Neurosci 43, 681–694. 10.1016/j.tins.2020.06.006. [DOI] [PMC free article] [PubMed] [Google Scholar]
- Badre D, and D’Esposito M (2009). Is the rostro-caudal axis of the frontal lobe hierarchical? Nat. Rev. Neurosci 10, 659–669. 10.1038/nrn2667. [DOI] [PMC free article] [PubMed] [Google Scholar]
- Bartolo R, and Averbeck BB (2020). Prefrontal Cortex Predicts State Switches during Reversal Learning. Neuron 106, 1044–1054 e1044. 10.1016/j.neuron.2020.03.024. [DOI] [PMC free article] [PubMed] [Google Scholar]
- Bartolo R, Saunders RC, Mitz AR, and Averbeck BB (2020a). Dimensionality, information and learning in prefrontal cortex. PLoS Comput. Biol 16, e1007514, e1007514. 10.1371/journal.pcbi.1007514. [DOI] [PMC free article] [PubMed] [Google Scholar]
- Bartolo R, Saunders RC, Mitz AR, and Averbeck BB (2020b). Information-Limiting Correlations in Large Neural Populations. J. Neurosci 40, 1668–1678. 10.1523/JNEUROSCI.2072-19.2019. [DOI] [PMC free article] [PubMed] [Google Scholar]
- Bichot NP, Xu R, Ghadooshahy A, Williams ML, and Desimone R (2019). The role of prefrontal cortex in the control of feature attention in area V4. Nat Commun 10, 5727. 10.1038/s41467-019-13761-7. [DOI] [PMC free article] [PubMed] [Google Scholar]
- Blanchard TC, Hayden BY, and Bromberg-Martin ES (2015). Orbitofrontal cortex uses distinct codes for different choice attributes in decisions motivated by curiosity. Neuron 85, 602–614. 10.1016/j.neuron.2014.12.050. [DOI] [PMC free article] [PubMed] [Google Scholar]
- Cai X, and Padoa-Schioppa C (2014). Contributions of orbitofrontal and lateral prefrontal cortices to economic choice and the good-to-action transformation. Neuron 81, 1140–1151. 10.1016/j.neuron.2014.01.008. [DOI] [PMC free article] [PubMed] [Google Scholar]
- Caminiti R, Ferraina S, and Johnson PB (1996). The sources of visual information to the primate frontal lobe: a novel role for the superior parietal lobule. Cereb. Cortex 6, 319–328. 10.1093/cercor/6.3.319. [DOI] [PubMed] [Google Scholar]
- Chau BK, Sallet J, Papageorgiou GK, Noonan MP, Bell AH, Walton ME, and Rushworth MF (2015). Contrasting Roles for Orbitofrontal Cortex and Amygdala in Credit Assignment and Learning in Macaques. Neuron 87, 1106–1118. 10.1016/j.neuron.2015.08.018. [DOI] [PMC free article] [PubMed] [Google Scholar]
- Chen LL, and Wise SP (1996). Evolution of directional preferences in the supplementary eye field during acquisition of conditional oculomotor associations. J. Neurosci 16, 3067–3081. 10.1523/JNEUROSCI.16-09-03067.1996. [DOI] [PMC free article] [PubMed] [Google Scholar]
- Cisek P, and Kalaska JF (2002). Simultaneous encoding of multiple potential reach directions in dorsal premotor cortex. J. Neurophysiol 87, 1149–1154. 10.1152/jn.00443.2001. [DOI] [PubMed] [Google Scholar]
- Cisek P, and Kalaska JF (2010). Neural Mechanisms for Interacting with a World Full of Action Choices. In Annual Review of Neuroscience, Vol 33, Hyman SE, ed. pp. 269–298. 10.1146/annurev.neuro.051508.135409. [DOI] [PubMed] [Google Scholar]
- Constantinidis C, Franowicz MN, and Goldman-Rakic PS (2001). The sensory nature of mnemonic representation in the primate prefrontal cortex. Nat. Neurosci 4, 311–316. 10.1038/85179. [DOI] [PubMed] [Google Scholar]
- Costa VD, and Averbeck BB (2020). Primate Orbitofrontal Cortex Codes Information Relevant for Managing Explore-Exploit Tradeoffs. J. Neurosci 40, 2553–2561. 10.1523/JNEUROSCI.2355-19.2020. [DOI] [PMC free article] [PubMed] [Google Scholar]
- Costa VD, Mitz AR, and Averbeck BB (2019). Subcortical Substrates of Explore-Exploit Decisions in Primates. Neuron 103, 533–545 e535. 10.1016/j.neuron.2019.05.017. [DOI] [PMC free article] [PubMed] [Google Scholar]
- Costa VD, Tran VL, Turchi J, and Averbeck BB (2014). Dopamine modulates novelty seeking behavior during decision making. Behav. Neurosci 128, 556–566. 10.1037/a0037128. [DOI] [PMC free article] [PubMed] [Google Scholar]
- Courtney SM (2004). Attention and cognitive control as emergent properties of information representation in working memory. Cogn. Affect. Behav. Neurosci 4, 501–516. 10.3758/cabn.4.4.501. [DOI] [PubMed] [Google Scholar]
- Djamshidian A, O’Sullivan SS, Wittmann BC, Lees AJ, and Averbeck BB (2011). Novelty seeking behaviour in Parkinson’s disease. Neuropsychologia 49, 2483–2488. 10.1016/j.neuropsychologia.2011.04.026. [DOI] [PMC free article] [PubMed] [Google Scholar]
- Dobbins IG, and Wagner AD (2005). Domain-general and domain-sensitive prefrontal mechanisms for recollecting events and detecting novelty. Cereb. Cortex 15, 1768–1778. 10.1093/cercor/bhi054. [DOI] [PubMed] [Google Scholar]
- Frank MJ (2005). Dynamic dopamine modulation in the basal ganglia: a neurocomputational account of cognitive deficits in medicated and nonmedicated Parkinsonism. J. Cogn. Neurosci 17, 51–72. 10.1162/0898929052880093. [DOI] [PubMed] [Google Scholar]
- Friedman DP, Aggleton JP, and Saunders RC (2002). Comparison of hippocampal, amygdala, and perirhinal projections to the nucleus accumbens: combined anterograde and retrograde tracing study in the Macaque brain. J. Comp. Neurol 450, 345–365. 10.1002/cne.10336. [DOI] [PubMed] [Google Scholar]
- Ghashghaei HT, Hilgetag CC, and Barbas H (2007). Sequence of information processing for emotions based on the anatomic dialogue between prefrontal cortex and amygdala. NeuroImage 34, 905–923. 10.1016/j.neuroimage.2006.09.046. [DOI] [PMC free article] [PubMed] [Google Scholar]
- Giarrocco F, and Averbeck B (2021). Organization of Parieto-Prefrontal and Temporo-Prefrontal Networks in the Macaque. J. Neurophysiol 10.1152/jn.00092.2021. [DOI] [PMC free article] [PubMed] [Google Scholar]
- Giguere M, and Goldman-Rakic PS (1988). Mediodorsal nucleus: areal, laminar, and tangential distribution of afferents and efferents in the frontal lobe of rhesus monkeys. J. Comp. Neurol 277, 195–213. 10.1002/cne.902770204. [DOI] [PubMed] [Google Scholar]
- Goldman-Rakic PS (1988). Topography of cognition: parallel distributed networks in primate association cortex. Annu. Rev. Neurosci 11, 137–156. 10.1146/annurev.ne.11.030188.001033. [DOI] [PubMed] [Google Scholar]
- Goodale MA, and Milner AD (1992). Separate visual pathways for perception and action. Trends Neurosci 15, 20–25. 10.1016/0166-2236(92)90344-8. [DOI] [PubMed] [Google Scholar]
- Gottfried JA, O’Doherty J, and Dolan RJ (2003). Encoding predictive reward value in human amygdala and orbitofrontal cortex. Science 301, 1104–1107. 10.1126/science.1087919. [DOI] [PubMed] [Google Scholar]
- Goulas A, Uylings HB, and Stiers P (2014). Mapping the hierarchical layout of the structural network of the macaque prefrontal cortex. Cereb. Cortex 24, 1178–1194. 10.1093/cercor/bhs399. [DOI] [PubMed] [Google Scholar]
- Haber SN, Kim KS, Mailly P, and Calzavara R (2006). Reward-related cortical inputs define a large striatal region in primates that interface with associative cortical connections, providing a substrate for incentive-based learning. J. Neurosci 26, 8368–8376. 10.1523/JNEUROSCI.0271-06.2006. [DOI] [PMC free article] [PubMed] [Google Scholar]
- Haber SN, Lynd-Balta E, and Mitchell SJ (1993). The organization of the descending ventral pallidal projections in the monkey. J. Comp. Neurol 329, 111–128. 10.1002/cne.903290108. [DOI] [PubMed] [Google Scholar]
- Hwang J, Mitz AR, and Murray EA (2019). NIMH MonkeyLogic: Behavioral control and data acquisition in MATLAB. J. Neurosci. Methods 323, 13–21. 10.1016/j.jneumeth.2019.05.002. [DOI] [PMC free article] [PubMed] [Google Scholar]
- Johnson PB, Ferraina S, and Caminiti R (1993). Cortical networks for visual reaching. Exp. Brain Res 97, 361–365. 10.1007/BF00228707. [DOI] [PubMed] [Google Scholar]
- Lee D, and Seo H (2007). Mechanisms of reinforcement learning and decision making in the primate dorsolateral prefrontal cortex. Ann. N. Y. Acad. Sci 1104, 108–122. 10.1196/annals.1390.007. [DOI] [PubMed] [Google Scholar]
- Lee D, Seo H, and Jung MW (2012). Neural Basis of Reinforcement Learning and Decision Making. In Annual Review of Neuroscience, Vol 35, Hyman SE, ed. pp. 287–308. 10.1146/annurev-neuro-062111-150512. [DOI] [PMC free article] [PubMed] [Google Scholar]
- Lu MT, Preston JB, and Strick PL (1994). Interconnections between the prefrontal cortex and the premotor areas in the frontal lobe. J. Comp. Neurol 341, 375–392. 10.1002/cne.903410308. [DOI] [PubMed] [Google Scholar]
- Maclean PD (1952). Some psychiatric implications of physiological studies on frontotemporal portion of limbic system (visceral brain). Electroencephalogr. Clin. Neurophysiol 4, 407–418. 10.1016/0013-4694(52)90073-4. [DOI] [PubMed] [Google Scholar]
- Marconi B, Genovesio A, Battaglia-Mayer A, Ferraina S, Squatrito S, Molinari M, Lacquaniti F, and Caminiti R (2001). Eye-hand coordination during reaching. I. Anatomical relationships between parietal and frontal cortex. Cereb. Cortex 11, 513–527. 10.1093/cercor/11.6.513. [DOI] [PubMed] [Google Scholar]
- Mitz AR, Bartolo R, Saunders RC, Browning PG, Talbot T, and Averbeck BB (2017). High channel count single-unit recordings from nonhuman primate frontal cortex. J. Neurosci. Methods 289, 39–47. 10.1016/j.jneumeth.2017.07.001. [DOI] [PMC free article] [PubMed] [Google Scholar]
- Nauta WJ (1958). Hippocampal projections and related neural pathways to the midbrain in the cat. Brain 81, 319–340. 10.1093/brain/81.3.319. [DOI] [PubMed] [Google Scholar]
- Neftci EO, and Averbeck BB (2019). Reinforcement learning in artificial and biological systems. Nature Machine Intelligence 1, 133–143. 10.1038/s42256-019-0025-4. [DOI] [Google Scholar]
- Nurmikko A (2020). Challenges for Large-Scale Cortical Interfaces. Neuron 108, 259–269. 10.1016/j.neuron.2020.10.015. [DOI] [PubMed] [Google Scholar]
- Olejnik S, and Algina J (2000). Measures of Effect Size for Comparative Studies: Applications, Interpretations, and Limitations. Contemp. Educ. Psychol 25, 241–286. 10.1006/ceps.2000.1040. [DOI] [PubMed] [Google Scholar]
- Padoa-Schioppa C, and Assad JA (2006). Neurons in the orbitofrontal cortex encode economic value. Nature 441, 223–226. 10.1038/nature04676. [DOI] [PMC free article] [PubMed] [Google Scholar]
- Papez JW (1937). A proposed mechanism of emotion. Arch. Neurol. Psychiatry 38, 725–743. DOI 10.1001/archneurpsyc.1937.02260220069003. [DOI] [Google Scholar]
- Power JD, Cohen AL, Nelson SM, Wig GS, Barnes KA, Church JA, Vogel AC, Laumann TO, Miezin FM, Schlaggar BL, and Petersen SE (2011). Functional network organization of the human brain. Neuron 72, 665–678. 10.1016/j.neuron.2011.09.006. [DOI] [PMC free article] [PubMed] [Google Scholar]
- Rich EL, and Wallis JD (2016). Decoding subjective decisions from orbitofrontal cortex. Nat. Neurosci 19, 973–980. 10.1038/nn.4320. [DOI] [PMC free article] [PubMed] [Google Scholar]
- Rudebeck PH, Mitz AR, Chacko RV, and Murray EA (2013). Effects of amygdala lesions on reward-value coding in orbital and medial prefrontal cortex. Neuron 80, 1519–1531. 10.1016/j.neuron.2013.09.036. [DOI] [PMC free article] [PubMed] [Google Scholar]
- Rudebeck PH, Ripple JA, Mitz AR, Averbeck BB, and Murray EA (2017). Amygdala Contributions to Stimulus-Reward Encoding in the Macaque Medial and Orbital Frontal Cortex during Learning. J. Neurosci 37, 2186–2202. 10.1523/JNEUROSCI.0933-16.2017. [DOI] [PMC free article] [PubMed] [Google Scholar]
- Schoenbaum G, Chiba AA, and Gallagher M (1998). Orbitofrontal cortex and basolateral amygdala encode expected outcomes during learning. Nat. Neurosci 1, 155–159. 10.1038/407. [DOI] [PubMed] [Google Scholar]
- Selemon LD, and Goldman-Rakic PS (1988). Common cortical and subcortical targets of the dorsolateral prefrontal and posterior parietal cortices in the rhesus monkey: evidence for a distributed neural network subserving spatially guided behavior. J. Neurosci 8, 4049–4068. [DOI] [PMC free article] [PubMed] [Google Scholar]
- Seo M, Lee E, and Averbeck BB (2012). Action selection and action value in frontal-striatal circuits. Neuron 74, 947–960. 10.1016/j.neuron.2012.03.037. [DOI] [PMC free article] [PubMed] [Google Scholar]
- Stalnaker TA, Raheja N, and Schoenbaum G (2021). Orbitofrontal State Representations Are Related to Choice Adaptations and Reward Predictions. J. Neurosci 41, 1941–1951. 10.1523/JNEUROSCI.0753-20.2020. [DOI] [PMC free article] [PubMed] [Google Scholar]
- Strait CE, Sleezer BJ, and Hayden BY (2015). Signatures of Value Comparison in Ventral Striatum Neurons. PLoS Biol 13, e1002173, e1002173. 10.1371/journal.pbio.1002173. [DOI] [PMC free article] [PubMed] [Google Scholar]
- Tang H, Bartolo R, and Averbeck BB (2021). Reward-related choices determine information timing and flow across macaque lateral prefrontal cortex. Nat Commun 12, 894. 10.1038/s41467-021-20943-9. [DOI] [PMC free article] [PubMed] [Google Scholar]
- Tang H, Qi XL, Riley MR, and Constantinidis C (2019). Working memory capacity is enhanced by distributed prefrontal activation and invariant temporal dynamics. Proc Natl Acad Sci U S A 116, 7095–7100. 10.1073/pnas.1817278116. [DOI] [PMC free article] [PubMed] [Google Scholar]
- Taswell CA, Costa VD, Murray EA, and Averbeck BB (2018). Ventral striatum’s role in learning from gains and losses. Proc Natl Acad Sci U S A 115, E12398–E12406. 10.1073/pnas.1809833115. [DOI] [PMC free article] [PubMed] [Google Scholar]
- Ungerleider LG (1982). Two cortical visual systems. In Analysis of visual behavior, pp. 549–586. [Google Scholar]
- Vickery TJ, Chun MM, and Lee D (2011). Ubiquity and specificity of reinforcement signals throughout the human brain. Neuron 72, 166–177. 10.1016/j.neuron.2011.08.011. [DOI] [PubMed] [Google Scholar]
- Wallis JD, and Miller EK (2003). Neuronal activity in primate dorsolateral and orbital prefrontal cortex during performance of a reward preference task. Eur. J. Neurosci 18, 2069–2081. 10.1046/j.1460-9568.2003.02922.x. [DOI] [PubMed] [Google Scholar]
- Wittmann BC, Daw ND, Seymour B, and Dolan RJ (2008). Striatal activity underlies novelty-based choice in humans. Neuron 58, 967–973. 10.1016/j.neuron.2008.04.027. [DOI] [PMC free article] [PubMed] [Google Scholar]
- Yoo SBM, and Hayden BY (2018). Economic Choice as an Untangling of Options into Actions. Neuron 99, 434–447. 10.1016/j.neuron.2018.06.038. [DOI] [PMC free article] [PubMed] [Google Scholar]
- Zohary E, Shadlen MN, and Newsome WT (1994). Correlated neuronal discharge rate and its implications for psychophysical performance. Nature 370, 140–143. 10.1038/370140a0. [DOI] [PubMed] [Google Scholar]
Associated Data
This section collects any data citations, data availability statements, or supplementary materials included in this article.
Supplementary Materials
Data Availability Statement
The datasets supporting the current study have been deposited at Mendeley.com and are publicly available as of the date of publication. DOIs are listed in the key resources table.
KEY RESOURCES TABLE
| REAGENT or RESOURCE | SOURCE | IDENTIFIER |
|---|---|---|
| Deposited data | ||
| Raw dataset and analysis code | This paper | doi: 10.17632/zwt3kwv4xk.1 |
| Experimental models: Organisms/strains | ||
| Rhesus macaques (Macaca mulatta) | NIMH/NIH | N/A |
| Software and algorithms | ||
| MATLAB R2020b | MathWorks Inc. | https://www.mathworks.com/products/matlab.html |
| Monkeylogic | NIMH/NIH | https://monkeylogic.nimh.nih.gov/about.html |
| Adobe Illustrator 2021 | Adobe | https://www.adobe.com/products/illustrator.html |
| Other | ||
| Utah array | BlackRock Microsystems | https://blackrockneurotech.com/research/products/#electrodes |
| Microelectrode | FHC | https://www.fh-co.com/product/metal-microelectrodes/ |
| Microelectrode | Alpha Omega | https://www.alphaomega-eng.com/Acute-Electrode-2-2 |
All original code has been deposited at Mendeley.com and is publicly available as of the date of publication. DOIs are listed in the key resources table.
Any additional information required to reanalyze the data reported in this paper is available from the lead contact upon request.