

Abstract
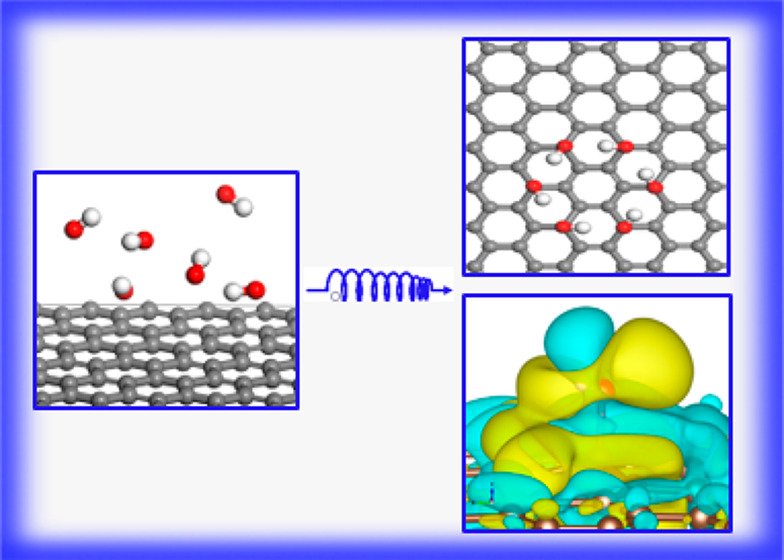
Arrangements of hydroxyl groups on graphene sheets were systematically investigated using density functional theory calculations that included van der Waals interactions. Results show that hydroxyl groups tend to gather at para-positions on graphene sheets to generate perfect ring-like hexahydroxyl group adsorption. The close proximity of hydroxyl groups is in good agreement with the experimental separation between unoxidized, aromatic and oxidized, saturated regions in graphene oxide. The orientation of hydrogen atoms in hydroxyl groups creates both O–H···O and O–H···π hydrogen bonds. Calculations also indicated that the binding energy per hydroxyl group follows a logarithmic function with respect to the number of hydroxyl groups. Besides, the opening band gap was observed for several derivatives, and the relationship between the band gap and O/C ratio was found to be nonmonotonic. Analysis of the density of states showed that bands around the Fermi levels of derivatives between graphene and hydroxyl groups are mainly composed of 2pz orbitals of carbon and oxygen atoms.
1. Introduction
Since its successful isolation in 2004,1 graphene has drawn significant attention not only in science but also in industry.2 Supercarrier mobility at room temperature,3 extraordinary electrical conductivity,4 good thermal conductivity,5 high transparency,6 excellent mechanical strength,7 extremely high theoretical specific surface area,8 unconventional quantum Hall effect,9 among others, are novel characteristics of graphene. Graphene has been produced by several synthetic methods,10 and the production of graphene from graphite is a promising solution for its mass production at a low cost.11 In the method, graphite is oxidized to form graphene oxide (GO); then, the GO is reduced to create a graphene-like material. The product is referred to as reduced graphene oxide (RGO), which is similar to graphene but has some oxygen functional groups. Experimental studies12−15 have demonstrated that the epoxy and hydroxyl groups are dominant functional groups in the structures of both GO and RGO.
On the basis of density functional theory (DFT) computations, Boukhvalov and co-workers suggested that GO with a coverage of less than 25% contains only hydroxyl groups on the basal plane.16 These authors also reported that the further reduction of GO from 6.25% coverage seems to be difficult to achieve. This result was subsequently confirmed by an experimental study by Velasco-Soto et al.13 XPS results showed that epoxy functionalities can be unstable and transform into hydroxyl groups during the reduction of GO.13 It was also supported by a study by Mathkar et al.15 While performing a stepwise reduction of GO, the latter authors identified that epoxy groups were reduced first, while hydroxyl groups took longer to be completely removed from the GO surface.15 Besides, in a study on the effect of hydroxyl functional groups on the mechanical properties of graphene, Verma et al.17 used molecular dynamics simulations and established that a brittle failure was occurred at 50–75% hydroxyl functionalization, whereas with lower coverage the failure morphology of hydroxyl-functionalized graphene shifted from brittle to ductile.17 Furthermore, hydroxyl groups also play a critical role in the water vapor sensing of GO,18 and graphene derivatives with hydroxyl groups show excellent electroactivity and biocompatibility with human retinal pigment epithelium (RPE) cells.19 Therefore, a better understanding of the structural and electronic properties of graphene derivatives with hydroxyl groups appears necessary. A legitimate question emerges: when only hydroxyl groups are present, how are these groups arranged on one side of the graphene sheet? It is assumed that the other side of the graphene sheet is masked by a substrate. Using theoretical calculations, Lahaye et al.20 showed that two OH groups on the same side of the graphene plane have to be divided by one or more carbon atoms. Configurations with either two hydroxyl groups that form an adjacent diol on the same side of the graphene sheet or more than two hydroxyl groups per carbon atom are unstable. In addition, Yan et al.21 realized that the configuration with 1,4-paired hydroxyl groups is the most favorable for two hydroxyl groups on the same side of the graphene sheet. A derivative with two hydroxyl groups at the para-position was also utilized in the study by Anasthasiya et al.22 However, when the number of hydroxyl groups increases to 3, 4, 5, ..., n (n ∈ N*), how do hydroxyl groups localize on the same side of graphene? This remains a crucial question of interest. On the other hand, the process of hydroxyl groups binding to carbon atoms of graphene is the chemical functionalization of graphene. Functionalization is known as a way to modify the band gap and other properties of graphene to suit applications in fields such as nanoelectronic devices,23 photocatalytic technologies,24 etc.
In this context, intending to shed more light on the structures of derivatives of graphene with hydroxyl groups, we systematically studied the spatial distribution of hydroxyl groups on one side of the graphene sheet. Here graphene was built from an orthorhombic four-atom unit cell instead of a conventional hexagonal two-atom unit cell as in all previous works on graphene derivatives. The utilization of the orthorhombic four-atom unit cell is significant in studies of heterogeneous graphene–semiconductor composites where the unit cells of the semiconductors are orthorhombic, for example, graphene/rutile TiO2(110). This limits lattice mismatch, as a computational model of heterogeneous composites is constructed. Furthermore, the electronic properties of graphene derivatives with hydroxyl groups have also been investigated.
2. Computational Methods
All calculations were performed with the Vienna Ab Initio Simulation Package (VASP)25 in the frame of DFT. Spin-polarized density functional calculations were employed to study derivatives of graphene with OH groups. Plane-wave basis sets with a cutoff of 450 eV were utilized for the valence electrons, whereas the projector augmented wave (PAW)26 approximation was utilized for pseudopotentials of the core electrons.
An orthorhombic four-atom unit cell of graphene was built and relaxed. The calculated parameters of the unit cell were a = 2.470 Å, b = 4.218 Å, and dCC = 1.426 Å; these values are in good agreement with the experimental values27 (a = √3dCC = 2.463 Å, b = 3dCC = 4.266 Å, and dCC = 1.422 Å). A 6 × 3 supercell containing 72 carbon atoms was constructed from the optimized orthorhombic four-atom unit cell. The supercell with dimensions of 14.820 × 12.843 (Å) was large enough to investigate the arrangement of hydroxyl groups. To eliminate interactions between adjacent images, a vacuum separation of 12 Å was applied. Dipole slab corrections were carried out.
Monkhorst–Pack28k-meshes of 2 × 2 × 1 and 12 × 12 × 1 were employed to sample the Brillouin zone of the supercell in the structural relaxations and density of states (DOS) calculations, respectively. Relaxations were performed until the Hellman–Feynman force on each atom converged to 0.01 eV/Å. After the relaxation, the total energy of the electric structure was computed using a self-consistent field method with a threshold of 10–6 eV.
In order to take into account the dispersion interactions that exist in derivatives, the optPBE-vdW,29 optB88-vdW,30 optB86b-vdW,31 and vdW-DF232 functionals were evaluated carefully. The results summarized in Table S1 of the Supporting Information (SI) show that optPBE-vdW functional is suitable for representing weak interactions.
The binding energy (Eb) between two species was calculated as follows:
| 1 |
where EG–OH, EG, and EOH are the total energies of the graphene derivative, pristine graphene, and a hydroxyl group, respectively. The total energy was obtained by self-consistent calculation after the optimization of the geometric structure. A negative value for the binding energy manifests an exothermic process.
3. Result and Discussion
3.1. Structures and Binding Energies
3.1.1. Monomolecular Adsorption
Similar to previous work,16,21,22 the formation of a single hydroxyl group on a basal plane leads to the distortion of the graphene sheet (Figure 1a).
Figure 1.

(a) Relaxed structure of the G1OH derivative (side view) and (b) electron density difference at an iso-level of 0.0015 electrons/Å3. Yellow and blue regions represent electron accumulation and depletion, respectively.
The carbon atom that binds to the hydroxyl group moves upward, and the neighboring C–C bonds expand to nearly 1.500 Å. The distance is smaller than the average bond length of a C–C single bond (1.54 Å) but larger than that of a C=C double bond (1.34 Å). The bond length between the OH group and the carbon atom of the graphene sheet is about 1.530 Å, which is larger than the value of a typical C–O single bond (1. 43 Å). In addition, ∠CCC angles change from 120° to 113.30°, and the ∠OCC angle is about 101.79°. These results demonstrate that the carbon atom in the C–OH group undergoes a transformation from sp2 hybridization to distorted sp3 hybridization. In particular, the relaxation of the G1OH derivative with different orientations of the hydroxyl group produced the same result. The optimized structure of G1OH has the hydroxyl group tending toward the center of a hexagonal ring. The orientation of the hydroxyl group is mainly derived from the formation of a hydrogen bond between OH and π-electrons of graphene, O–H···π. Indeed, the adsorption of the OH group results in electron redistribution (Figure 1b). The electron density increases between the oxygen and the carbon atom, which is responsible for the C–OH bond. Besides, electron accumulation was seen between hydrogen and π-electrons of graphene, which is the consequence of the O–H···π bond formation. Furthermore, the calculation also shows that the binding energy of the G1OH derivative is about −1.17 eV/OH. In the previous study by Lahaye et al.,20 the binding energy obtained was only −0.7 eV. Such a deviation may be ascribed to the use of the GGA approximation in the Perdew–Burke–Ernzerhof formalism of the previous study, which is known to be unsuitable for describing van der Waals systems.31,33,34
3.1.2. Bimolecular Adsorption
First, we have considered many possible arrangements of two hydroxyl groups located on adjacent carbon atoms. Carbon atoms that bind to the C–OH group in the G1OH derivative are labeled as C1i, C1j, and C1k (Figure 2a).
Figure 2.

(a) Relaxed G1OH derivative and (b) G2OH1k1.
By dint of the equivalence of C1i and C1j atoms, only arrangements of the second hydroxyl group related to C1i and C1k atoms were investigated. Possible orientations of the second hydroxyl group have been studied. Calculations showed that the most stable structure corresponding to the C1k site is the G2OH1k1 structure with a binding energy of −1.43 eV/OH (Figure 2b). Besides, other structures with more positive binding energies were also obtained (Figure S2 in the SI). The other structures are conformers that can interact with the most stable structure with very smaller energy barriers. The difference in the binding energy between the structures is ascribed to a combination of the distance of the C–O bonds, the distortion of the graphene sheet, and the interaction of hydroxyl groups (Table S2 in the SI). It can be seen that the differences in the C–O bond distances and the distortion of graphene sheets between the most stable structure and the conformers are quite small. Meanwhile, the interactions of hydroxyl groups are significantly different between the structures. The most stable structure has a hydrogen bond O–H···O with a H···O length of 1.803 Å and a ∠O–H···O bond angle of 126.02° (Figure 2b). The formation of the hydrogen bond also results in an expansion of the O–H bond from 0.979 Å in G1OH to 0.985 Å. Besides, the most stable structure possesses a second interaction between hydroxyl groups (Table S2). In comparison to the first hydrogen bond, the second interaction is weaker and has an interaction distance of 2.779 Å (Bondi radii35 of O = 1.52 Å and H= 1.20 Å). For the C1i site, the most stable structure has the same binding energy as the G1OH1k1 structure, about 1.43 eV/OH. The geometries of the two stable structures are quite similar to each other. Therefore, hydroxyl groups tend to generate a large number of O–H···O hydrogen bonds and other weaker interactions between oxygen and hydrogen atoms as often as possible. When the formation of these interactions is not possible, a hydroxyl group tends to create an OH···π bond. This conclusion of the first exploration is a guideline for the construction of structures in further investigations.
The remaining arrangements of two hydroxyl groups were studied by dividing the basal plane of the relaxed G1OH into six regions with three couples (Ia, Ib), (IIa, IIb), and (IIIa, IIIb) (Figure 3a). The regions of the (Ia, Ib) couple are interesting to consider. The next regions belong to the (IIa, IIb) couple. Meanwhile, the (IIIa, IIIb) couple is far from the regions of interest. Therefore, the two couples of (Ia, Ib) and (IIa, IIb) were chosen. Only one region in each couple was considered.
Figure 3.

(a) Possible arrangements of the second hydroxyl group on the relaxed G1OH derivative and (b) the relaxed structure of the G2OH5-Ia derivative.
For the first couple of (Ia, Ib), the (Ia) region was studied. Carbon atoms in the (Ia) region were numbered 1, 2, 3, and so on. When the second hydroxyl group was combined with those numbered carbon atoms, the corresponding structures were symbolized as G2OH1-Ia, G2OH2-Ia, G2OH3-Ia, and so on. Binding energies and some structural parameters of these derivatives after relaxation are shown in Table S3 of the SI file. The G2OH5-Ia derivative outstrips the rest of the structures by at least 0.1 eV/OH in terms of the magnitude of the binding energy. In other words, the G2OH5-Ia derivative is the most stable structure, which can be interpreted from its structural characteristics (Figure 3b). Compared to the remaining structures, the average bond length of C–O bonds in G2OH5-Ia is quite small, about 1.512 Å (Table S3). In addition, unlike other structures, the G2OH5-Ia derivative creates two O–H···π bonds thanks to the two hydroxyl groups pointing to the centers of the hexagonal rings. Besides, like the other structures in the (Ia) region, the G2OH5-Ia derivative also has an O–H···O hydrogen bond. However, the bond angle ∠O–H···O in the hydrogen bond of the G2OH5-Ia derivative is quite large, about 152.62°, which makes the hydrogen bond stronger. Thus, the G2OH5-Ia derivative possesses the most negative binding energy, about −1.53 eV/OH, as compared to the previously reported value of −1.2 eV in the study performed using the LDA approximation.21
For a second couple of (IIa, IIb), all carbons in the (IIa) region were examined. In the same manner described above, we determined that the G2OH5-IIa derivative was the most stable. The geometries of the two most stable structures, G2OH5-Ia and G2OH5-IIa, are again similar. Therefore, for the case of two hydroxyl groups, the most stable structure consists of two hydroxyl groups localized at a para-position on the same hexagonal ring, with both hydrogen atoms of hydroxyl groups pointing toward the centers of hexagonal rings. The result is in line with previous studies that used the hexagonal two-atom unit cell.20−22 The most stable arrangement of the two hydroxyl groups (G2OH5) is now utilized as the initial structure in the following part to add the next hydroxyl group.
3.1.3. Trimolecular Adsorption
To investigate how the third hydroxyl group was located on the most stable structure of G2OH5, we separated the basal plane of the relaxed G2OH5 structure into four parts (Figure 4a). Carbon atoms in the part (I) were labeled as 1, 2, and 3, and so on. The derivatives corresponding to these carbon atoms were symbolized by G3OH1, G3OH2, G3OH3, and so on.
Figure 4.

(a) Possible arrangements of the third hydroxyl group on the relaxed G2OH5 derivative and (b–f) relaxed structures of derivatives containing three hydroxyl groups in proximity (top view).
The results of the calculations on the derivative are presented in Table S4 in the SI. The lower negative binding energies are seen in the structures with the third hydroxyl group near two initial hydroxyl groups. In more detail, the G3OH10 derivative has the most negative binding energy of −1.58 eV/OH, followed by the G3OH1 derivative with a binding energy of −1.51 eV/OH. Although the three hydroxyl groups in G3OH3, G3OH4, and G3OH9 derivatives are situated in close proximity, their binding energies are not very negative. This is attributed to the difference in the number and stability of hydrogen bonds in these structures. The optimized structures of the G3OH10, G3OH1, G3OH3, G3OH4, and G3OH9 derivatives are displayed in Figure 4. Detailed geometries of these structures are described in Table 1.
Table 1. Binding Energies and Structural Parameters of Interactions between OH Groups in Some Relaxed Derivatives Containing Three Hydroxyl Groups.
| the
first interaction |
the
second interaction |
the
third interaction |
|||||||
|---|---|---|---|---|---|---|---|---|---|
| structure | H···O (Å) | ∠O–H···O (°) | H···O (Å) | ∠O–H···O (°) | H···O (Å) | ∠O–H···O (°) | no. of O–H···O hydrogen bonds | no. of HO···π bonds | Eb (eV/OH) |
| G3OH10 | 1.994 | 152.56 | 2.062 | 152.12 | 5.249 | 75.193 | 2 | 3 | –1.58 |
| G3OH1 | 1.696 | 161.77 | 1.705 | 127.48 | 5.688 | 47.85 | 2 | 2 | –1.51 |
| G3OH3 | 1.849 | 122.62 | 2.434 | 135.54 | 2.886 | 129.47 | 2 | 0 | –1.14 |
| G3OH4 | 2.023 | 141.93 | 2.082 | 150.23 | 3.954 | 90.11 | 2 | 2 | –1.41 |
| G3OH9 | 1.911 | 145.52 | 1.925 | 153.78 | 5.878 | 58.5 | 2 | 2 | –1.42 |
Inspecting the data in Table 1 shows that each of these structures contains two O–H···O bonds. Meanwhile, the G3OH10 derivative has the largest number of H–O···π bonds. The G3OH1, G3OH4, and G3OH9 derivatives have two H–O···π bonds, followed by the G3OH3 derivative with only one HO···π bond. Therefore, the G3OH10 derivative has the most negative formation energy. the G3OH1, G3OH4, and G3OH9 derivatives include the same number of hydrogen bonds. However, H–O···H bonds of the G3OH1 derivative are more stable than those of G3OH9 and G3OH4 derivatives thanks to the shorter O···H distances and larger < H–O···H angles. This leads to Eb(G3OH1) being smaller than Eb(G3OH9) and Eb(G3OH4). The G3OH3 derivative is composed of the lowest number of hydrogen bonds. Thus, the binding energy of the G3OH3 derivative is more positive.
Therefore, the most stable structure containing three hydroxyl groups, the G3OH10 derivative, has hydroxyl groups arranged in para-positions. Interestingly, the para-arrangement is also seen in the most stable structure with two hydroxyl groups. Thus, we can conclude that hydroxyl groups tend to gather at para-positions on one side of the graphene sheet. The para-arrangement was used for further study.
3.1.4. Other Multimolecular Adsorption
The adsorption of n hydroxyl groups (where n = 4, 5, and 6) on graphene sheets was investigated in the same way. First, the basal plane of the relaxed G(n – 1)OH derivative was divided into equivalent parts. Then, only one of these parts was considered. The nth OH group was located at para-positions in this part (S3 in the SI). The most stable structures corresponding to n = 4, 5, and 6 were G4OH1, G5OH1, and G6OH1, respectively (Figure 5).
Figure 5.

Most stable structures of derivatives containing 4, 5, or 6 hydroxyl groups (top view).
Structural parameters and binding energies of the structures are shown in S3 of the SI. As the number of hydroxyl groups in the derivatives increases, the binding energy per hydroxyl group of the most stable derivatives becomes more negative, except for the G5OH1 derivative (Figure 6). However, the difference in binding energies between the G4OH1 and G5OH1 derivatives remains quite small, about 0.01 eV/OH.
Figure 6.
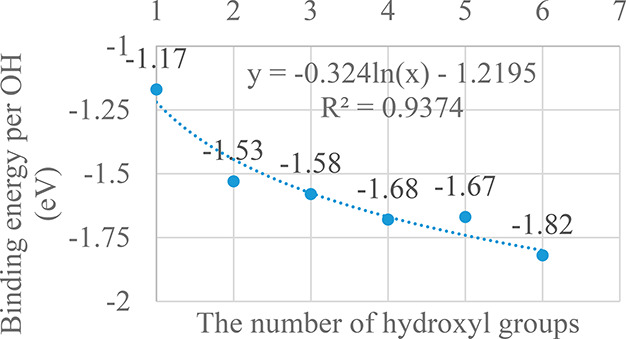
Dependence of the binding energy on the number of OH groups (the dashed line represents the curve fitting).
Analysis of the arrangement of OH groups on the graphene sheet showed that hydroxyl groups tended to localize at para-positions in close proximity. In particular, hydroxyl groups tend to gather in the form of a six-membered ring. The cyclization stabilizes the G6OH1 structure and makes its binding energy overwhelmingly negative, about −1.82 eV/OH. Ring-like hexa-OH adsorption was shown to be the most stable form. Indeed, when the calculation was expanded to the derivative with seven OH groups (G7OH derivative), a binding energy per OH group was only −1.62 eV/OH, less negative than that of the G6OH1 derivative. Thus, the subsequent absorption of OH groups tends to create new hexa-OH rings, and we expect that at the O/C ratio of 25% for the localization of hexa-OH rings is similar to the case of the graphene hydrogenation process.37
3.2. Electronic Properties
First, electronic properties including the electronic band structure, the DOS, and the PDOS of the optimized pristine graphene supercell were calculated, and the results are shown in Figure 7. The crossing point in the first Brillouin zone (BZ) of the 6 × 3 supercell is the Γ-point. This is a Dirac point of graphene. Besides, a linear dispersion of bands around the Dirac point was observed in the electronic band structure of graphene. As a consequence, the electron transport is controlled by Dirac’s (relativistic) equation. Electrons (or holes) are massless Dirac fermions that travel with a speed of vF ≈ 1 × 10⁶ ms–1. This elucidates a number of experimentally unconventional effects of graphene, such as new varieties of the quantum Hall effect or relativistic quantum mechanical effects.9
Figure 7.

(a) Electronic band structure and (b) DOS and PDOS of a pristine graphene supercell. The Fermi level was assigned to zero, and the blurred line in panel b is the Fermi level.
The zero band gap of graphene was also demonstrated by DOS analysis, as shown in Figure 7b. In addition, the PDOS of pristine graphene shows that states around the Fermi level are composed of 2pz orbitals of carbon atoms. The 2pz orbitals of carbon atoms that create π-bonds present the electronic properties of graphene. Meanwhile, 2px and 2py orbitals contribute mainly to deep valence bands, forming σ-bonds and determining mechanical strength of graphene. To further study electronic properties, hereafter we only consider the 2pz orbitals of carbon atoms.
For the G1OH derivative, the bonding formation of C–OH leads to a distortion of the graphene sheet, followed by the appearance of new states around the Fermi level (Figure 8). Analysis of the PDOS indicated that the new states were composed of 2pz orbitals of oxygen and carbon atoms. By contrast, contributions from the 2px and 2py orbitals of oxygen and the 1s orbital of hydrogen to states around Fermi are trivial.
Figure 8.
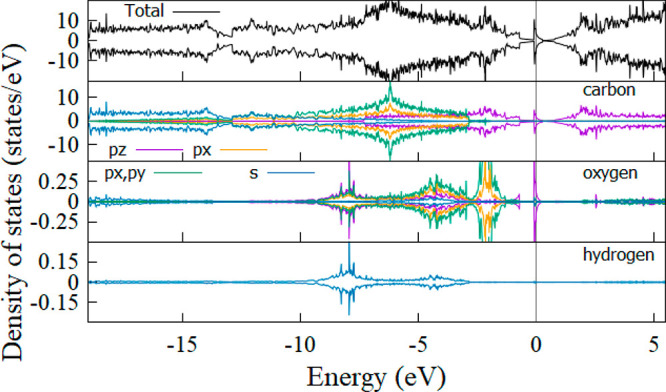
DOS and PDOS of the G1OH derivative. The spin-up and spin-down channels are separated. The Fermi level was adjusted to zero. The black, violet, orange, green, and blue lines correspond to the total DOS and the pz, px, px, py, and s orbitals, respectively. The blurred vertical lines denote the Fermi level.
Electronic property calculations for relaxed structures of the rest of the most stable derivatives, from G2OH to G6OH, indicated that the high valence band and low conduction band mainly consist of 2pz orbitals of oxygen and carbon atoms (Figure 9). The band gaps of hydroxyl graphene derivatives depend on the arrangement of −OH groups. For the most stable derivatives, the band gap is a nonmonotonic function of the OH adsorption number or the O/C ratio, similar to the cases of epoxy groups.16,36 At the O/C ratios of 2.8%, 5.6%, and 8.3%, the band gap receives values of 0.07, 0.27, and 1.06 eV, respectively (Table 2). The zero band gap was seen at O/C ratios of 1.4%, 4.2%, and 6.9%. A previous study by Yan21 showed a zero-band gap at the O/C ratio of 3.1%. Therefore, the band gap of graphene could be tuned by hydroxyl functionalization.
Figure 9.

DOS and PDOS of (a) G2OH5, (b) G3OH10, (c) G4OH1, (d) G5OH1, and (e) G6OH1. The spin-up and spin-down channels are separated. The back, violet, and red solid lines represent the total, C-2pz, and O-2pz, respectively. The Fermi energy (blurred vertical line) was set to zero.
Table 2. Band Gaps of the Most Stable Derivatives.
| derivative | graphene | G1OH | G2OH5 | G3OH10 | G4OH1 | G5OH1 | G6OH1 |
|---|---|---|---|---|---|---|---|
| O/C (%) | 0.00 | 1.39 | 2.78 | 4.17 | 5.56 | 6.94 | 8.33 |
| band gap (eV) | 0.00 | 0.00 | 0.07 | 0.00 | 0.27 | 0.000 | 1.06 |
4. Conclusions
The arrangement of hydroxyl groups on one side of the graphene sheet has been completely investigated. Results of calculations on derivatives containing two hydroxyl groups are in good agreement with previous works. For multimolecular adsorption, results of the arrangement of 3, 4, 5, ..., n (n ∈ N*) hydroxyl groups explain the experimental existence of oxidized and unoxidized regions in GO and RGO structures. The hydroxyl groups tend to form hexa-ring adsorption structures on the graphene sheet, and the orientation of hydrogen atoms in hydroxyl groups creates both O–H···O and O–H···π hydrogen bonds. The formation of beautiful hexa-ring adsorption releases a large amount of energy, about −1.82 eV per hydroxyl group. Calculations also showed that chemically modifying graphene with hydroxyl groups can turn the band gap of graphene. The localization of hydroxyl groups on the basal plane of graphene leads to the emergence of new peaks around the Fermi level. States around the Fermi level are composed of 2pz orbitals of carbon and oxygen atoms.
Acknowledgments
We acknowledge financial support from National Foundation for Science and Technology Development, Vietnam,(NAFOSTED) through project no. 104.06-2017.343.
Supporting Information Available
The Supporting Information is available free of charge at https://pubs.acs.org/doi/10.1021/acsomega.2c03447.
Comparison of lattice parameters and cohesive energy of graphite obtained from different DFT methods, structural parameters and binding energies of conformers corresponding to bimolecular and trimolecular adsorption, and structural parameters and binding energies of conformers corresponding to the other multimolecular adsorption modes (PDF)
The authors declare no competing financial interest.
Supplementary Material
References
- Geim K.; Novoselov K. S. The rise of graphene. Nat. Mater. 2007, 6, 183–191. 10.1038/nmat1849. [DOI] [PubMed] [Google Scholar]
- Olabi A. G.; Abdelkareem M. A.; Wilberforce T.; Sayed E. T. Application of graphene in energy storage device - A review. Renewable Sustainable Energy Rev. 2021, 135, 110026. 10.1016/j.rser.2020.110026. [DOI] [Google Scholar]
- Du X.; Skachko I.; Barker A.; Andrei E. Y. Approaching ballistic transport in suspended graphene. Nat. Nanotechnol. 2008, 3, 491–495. 10.1038/nnano.2008.199. [DOI] [PubMed] [Google Scholar]
- Wu Z. S.; Ren W.; Gao L.; Zhao J.; Chen J.; Liu B.; Tang D.; Yu B.; Jiang C.; Cheng H. Synthesis of graphene sheets with high electrical conductivity and good thermal stability by hydrogen arc discharge exfoliation. ACS Nano 2009, 3 (2), 411–417. 10.1021/nn900020u. [DOI] [PubMed] [Google Scholar]
- Balandin A. A. Thermal properties of graphene and nanostructured carbon materials. Nat. Mater. 2011, 10, 569–581. 10.1038/nmat3064. [DOI] [PubMed] [Google Scholar]
- Nair R. R.; Blake P.; Grigorenko A. N.; Novoselov K. S.; Booth T. J.; Stauber T.; Peres N. M. R.; Geim A. K. Fine structure constant defines visual transparency of graphene. Science 2008, 320 (5881), 1308. 10.1126/science.1156965. [DOI] [PubMed] [Google Scholar]
- Lee C.; Wei X.; Kysar J. W.; Hone J. Measurement of the elastic properties and intrinsic strength of monolayer graphene. Science 2008, 321 (5887), 385–388. 10.1126/science.1157996. [DOI] [PubMed] [Google Scholar]
- Stoller M. D.; Park S.; Zhu Y.; An J.; Ruoff R. S. Graphene-Based Ultracapacitors. Nano Lett. 2008, 8 (10), 3498–3502. 10.1021/nl802558y. [DOI] [PubMed] [Google Scholar]
- Novoselov K. S.; Jiang Z.; Zhang Y.; Morozov S. V.; Stormer H. L.; Zeitler U.; Maan J. C.; Boebinger G. S.; Kim P.; Geim A. K. Room-Temperature Quantum Hall Effect in Graphene. Science 2007, 315 (5817), 1379. 10.1126/science.1137201. [DOI] [PubMed] [Google Scholar]
- Park S.; Ruoff R. S. Chemical methods for the production of graphenes. Nat. Nanotechnol. 2009, 4 (4), 217–224. 10.1038/nnano.2009.58. [DOI] [PubMed] [Google Scholar]
- Agarwal V.; Zetterlund P. B. Strategies for reduction of graphene oxide - A comprehensive review. Chem. Eng. J. 2021, 405, 127018. 10.1016/j.cej.2020.127018. [DOI] [Google Scholar]
- Fernández-Merino M. J.; Guardia L.; Paredes J. I.; Villar-Rodil S.; Solís-Fernández P.; Martínez-Alonso A.; Tascón J. M. D. Vitamin C is an ideal substitue for hydrazine in the reduction of graphene oxide suspensions. J. Phys. Chem. C 2010, 114, 6426–6432. 10.1021/jp100603h. [DOI] [Google Scholar]
- Velasco-Soto M. A.; Pérez-Garcia S. A.; Alvarez-Quintana J.; Cao Y.; Nyborg L.; Licea-Jiménez L. Selective band gap manipulation of graphene oxide by its reduction with mild reagents. Carbon 2015, 93, 967–973. 10.1016/j.carbon.2015.06.013. [DOI] [Google Scholar]
- Al-Gaashani R.; Najjar A.; Zakaria Y.; Mansour S.; Atieh M. A. XPS and structural studies of high quality graphene oxide and reduced graphene oxide prepared by different chemical oxidation methods. Ceram. Int. 2019, 45, 14439–14448. 10.1016/j.ceramint.2019.04.165. [DOI] [Google Scholar]
- Mathkar A.; Tozier D.; Cox P.; Ong P.; Galande C.; Balakrishnan K.; Reddy A. L. M.; Ajayan P. M. Controlled, stepwise reduction and band gap manipulation of graphene oxide. J. Phys. Chem. Lett. 2012, 3, 986–991. 10.1021/jz300096t. [DOI] [PubMed] [Google Scholar]
- Boukhvalov D. W.; Katsnelson M. I. Modeling of Graphite Oxide. J. Am. Chem. Soc. 2008, 130, 10697–10701. 10.1021/ja8021686. [DOI] [PubMed] [Google Scholar]
- Verma A.; Parashar A. Molecular dynamics based simulations to study failure morphology of hydroxyl and epoxide functionalised graphene. Comput. Mater. Sci. 2018, 143, 15–26. 10.1016/j.commatsci.2017.10.048. [DOI] [Google Scholar]
- Fatima Q.; Haidry A. A.; Yao Z.; He Y.; Li Z.; Sun L.; Xie L. The critical role of hydroxyl groups in water vapor sensing of graphene oxide. Nanoscale 2019, 1, 1319. 10.1039/C8NA00135A. [DOI] [PMC free article] [PubMed] [Google Scholar]
- Yan L.; Lin M.; Zeng C.; Chen Z.; Zhang S.; Zhao X.; Wu A.; Wang Y.; Dai L.; Qu J.; Guo M.; Liu Y. Electroactive and biocompatible hydroxyl-functionalized graphene by ball milling. J. Mater. Chem. 2012, 22, 8367. 10.1039/c2jm30961k. [DOI] [Google Scholar]
- Lahaye R. J. W. E.; Jeong H. K.; Park C. Y.; Lee Y. H. Density functional theory study of graphite oxide for different oxidation levels. Phys. Rev. B 2009, 79, 125435. 10.1103/PhysRevB.79.125435. [DOI] [Google Scholar]
- Yan J. A.; Chou M. Y. Oxidation functional groups on graphene: Structural and electronic properties. Phys. Rev. B 2010, 82, 125403. 10.1103/PhysRevB.82.125403. [DOI] [Google Scholar]
- Anasthasiya A. N. A.; Khaneja M.; Jeyaprakash B. G. Electronic structure calculations of amomonia adsorption on graphene and graphene oxide with epoxide and hydroxyl groups. J. Electron. Mater. 2017, 46, 5642–5656. 10.1007/s11664-017-5626-2. [DOI] [Google Scholar]
- Bachtold A.; Hadley P.; Nakanishi T.; Dekker C. Logic circuits with carbon nanotube transistors. Science 2001, 294 (5545), 1317–1320. 10.1126/science.1065824. [DOI] [PubMed] [Google Scholar]
- Liu X.; Pan L.; Lv T.; Zhu G.; Sun Z.; Sun C. Microwave = assisted synthsis of CdS-reduced graphene oxide composites for photocatalytic reduction of Cr(VI). Chem. Commun. 2011, 47, 11984–11986. 10.1039/c1cc14875c. [DOI] [PubMed] [Google Scholar]
- VASP Software GmbH . VASP; University of Vienna: Vienna, Austria. https://www.vasp.at/
- Blochl P. E. Projector augmented-wave method. Phys. Rev. B 1994, 50 (24), 17953–17979. 10.1103/PhysRevB.50.17953. [DOI] [PubMed] [Google Scholar]
- Trucano P.; Chen R. Structure of graphite by neutron diffraction. Nature 1975, 258, 136–137. 10.1038/258136a0. [DOI] [Google Scholar]
- Monkhorst H. J.; Pack J. D. Special points for Brilouin-zone integration. Phys. Rev. B 1976, 13, 5188–5192. 10.1103/PhysRevB.13.5188. [DOI] [Google Scholar]
- Dion M.; Rydberg H.; Schröder E.; Langreth D. C.; Lundqvist B. I. Van der Waals density functional for general geometries. Phys. Rev. Lett. 2004, 92 (24), 246401. 10.1103/PhysRevLett.92.246401. [DOI] [PubMed] [Google Scholar]
- Klimeš J.; Bowler D. R; Michaelides A. Chemical accuracy for the van der Waals density functional. J. Phys.: Condens. Matter 2010, 22 (2), 022201. 10.1088/0953-8984/22/2/022201. [DOI] [PubMed] [Google Scholar]
- Klimes J.; Bowler D. R.; Michaelides A. Van der Waals density functionals applied to solids. Phys. Rev. B 2011, 83, 195131. 10.1103/PhysRevB.83.195131. [DOI] [Google Scholar]
- Lee K.; Murray É. D.; Kong; Lundqvist B. I.; Langreth D. C. Higher-accuracy van der Waals density functional. Phys. Rev. B 2010, 82 (8), 081101. 10.1103/PhysRevB.82.081101. [DOI] [Google Scholar]
- Pérez-Jordá J. M.; Becke A. D. A density-functional study of van der Waals forces: rare gas diatomics. Chem. Phys. Lett. 1995, 233, 134–137. 10.1016/0009-2614(94)01402-H. [DOI] [Google Scholar]
- Kristyán S.; Pulay P. Can (semi)local density functional theory account for the London dispersion forces?. Chem. Phys. Lett. 1994, 229, 175–180. 10.1016/0009-2614(94)01027-7. [DOI] [Google Scholar]
- Bondi A. Van der Waals Volumes and Radii. J. Phys. Chem. 1964, 68 (3), 441–451. 10.1021/j100785a001. [DOI] [Google Scholar]
- Huang H.; Li Z.; She Z.; Wang W. Oxygen density dependent band gap of reduced graphene oxide. J. Appl. Phys. 2012, 111, 054317. 10.1063/1.3694665. [DOI] [Google Scholar]
- Haberer D.; Giusca C. E.; Wang Y.; Sachdev H.; Fedorov A. V.; Farjam M.; Jafari S. A.; Vyalikh D. V.; Usachov D.; Liu X.; Treske U.; Grobosch M.; Vilkov O.; Adamchuk V. K.; Irle S.; Silva S. R. P.; Knupfer M.; Büchner B.; Grüneis A. Evidence for a New Two-Dimensional C4H-Type Polymer Based on Hydrogenated Graphene. Adv. Mater. 2011, 23, 4497–4503. 10.1002/adma.201102019. [DOI] [PubMed] [Google Scholar]
Associated Data
This section collects any data citations, data availability statements, or supplementary materials included in this article.