

Abstract
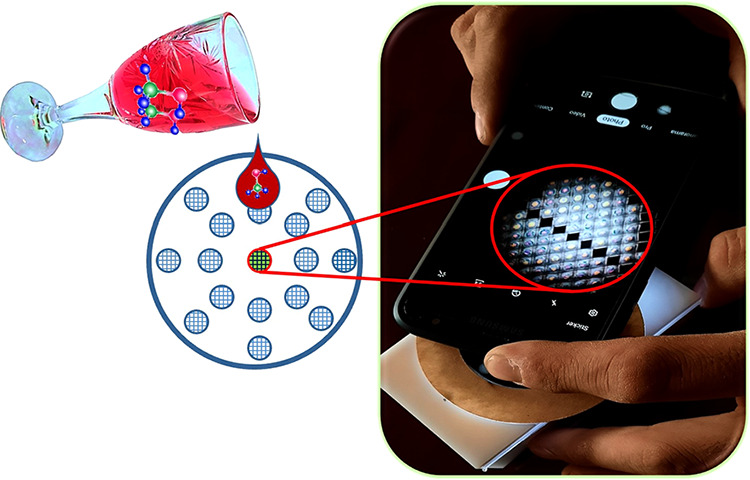
Methanol contamination of alcoholic drinks can lead to severe health problems for human beings including poisoning, headache, blindness, and even death. Therefore, having access to a simple and inexpensive way for monitoring beverages is vital. Herein, a portable, low cost, and easy to use sensor is fabricated based on the exploitation of chiral nematic liquid crystals (CLCs) and a textile grid for detection of methanol in two distinct alcoholic beverages: red wine and vodka. The working principle of the sensor relies on the reorientation of the liquid crystal molecules upon exposure to the contaminated alcoholic beverages with different concentrations of methanol (0, 2, 4, and 6 wt %) and the changes in the observed colorful textures of the CLCs as well as the intensity of the output light. The proposed sensor is label free and rapid.
Introduction
Methanol (methyl alcohol), as one of the most common organic solvents, has a wide variety of applications including paints, dyes, and chemical synthesis.1,2 In addition, it has the potential to be used as an alternative energy fuel for the future.3 Naturally, there is a small amount of methanol in alcoholic beverages which is produced as a result of bacterial fermentation under standard conditions during alcohol manufacturing.4,5 This low concentration of methanol is not particularly harmful. However, high levels of methanol in spirit drinks could be converted into toxic formaldehyde and formic acid in human organisms.4,6 Hence, it could bring about serious health problems when ingested, inhaled, or absorbed by the skin.7 The ingestion of alcoholic drinks contaminated with an unsafe amount of methanol will cause headache, vertigo, nausea, vomiting, blindness, and even death. Sometimes it has been deliberately added to alcoholic beverages to decrease the final cost.8−12 Moreover, illegally produced or homemade alcohols have threatened people’s health.13 Therefore, accurate detection of methanol in alcoholic solutions is mandatory to avoid methanol poisoning. More interestingly, a simple and inexpensive method for monitoring the presence of methanol in wines is of great interest.
A number of methods have been reported to detect methanol concentrations in alcoholic beverages such as enzymatic,14 colorimetric,15 gas chromatography–Fourier transform infrared spectroscopy (FTIR), horizontal attenuated total reflectance (HATR),16 gas chromatography,17 and Raman spectroscopy.18 All of the mentioned methods are expensive and demand bulky equipment. Thus, seeking a low-cost and portable method for monitoring alcoholic beverages is of great importance.
Liquid crystals (LCs) are proper candidates for sensing applications due to their short-range interaction and long-range orientation which could be altered by minor external perturbations.19,20 Indeed, optical signals produced upon their molecular ordering changes which are visible under crossed polarizers enable a kind of detection. These anisotropic materials are capable of transducing orientational changes at the interface of LC which are caused by target molecules. In fact, this reorientation of LC at the interface can further spread out into the bulk LC phase up to 100 μm away. As LCs are birefringent materials, the intensity of transmitted light and the colorful textures can be changed and observed under polarized microscope.21−26 However, polarized optical microscopes are expensive and bulky. There are several attempts to address this issue, two of which are Kuma et al.21 who designed and fabricated a smartphone-based LC sensing device and Chen et al.22 who reported a portable liquid crystal based sensor for the detection of nitrite.
The reported LC based sensors can be classified in two different styles of LC–solid interface sensing and LC–aqueous interface sensing. The first style requires a LC cell with two glass slides attached together with spacers. The second style needs a transmission electron microscopy (TEM) grid fixed on a glass slide or sandwiched between two glass slides and filled with LCs. In both platforms the glass should be coated with a thin layer of polymer and rubbed to induce specific alignment to the LCs. The pattern is observable by placing the sensor between two crossed polarizers, switching from dark to bright.20
Chiral nematic liquid crystals (CLCs) have been proven to demonstrate excellent sensing performances.27 These stimuli-responsive materials form a helical structure and selectively reflect specific wavelengths of the circularly polarized light with the same handedness as the cholesteric helix. According to Bragg’s law, the selective central reflection wavelength is represented as λ = npcos θ, where n is the average refractive index of the CLC or (no + ne)/2 in which no and ne are the ordinary and extraordinary refractive indices of the LC, θ is the angle of incidence, and p is the pitch length of the CLC. The pitch length could be altered by changing the concentration of chiral dopant as well as environmental stimuli such as chemical agents. Alternation of the pitch changes the light reflection band. Therefore, upon irradiation of light and in the presence of a molecule on the CLCs distinctive colors can be generated and these specific colors can be utilized in sensing applications.28 Mujahid et al. utilized the CLCs to detect the vapors of different organic solvents such as methanol.29 Chang et al. reported a colorimetric sensor based on CLC polymer networks to detect methanol.30
In this paper, in contrast to the above-mentioned papers, we did not use the visible color shifting of the selective Bragg reflection of CLCs. Instead, we benefited from observation of the optical textures of the CLCs. Herein, for the first time a polyester textile mesh with square holes fixed to a Plexiglas framework is agitated with CLCs and used as a sensor for detection of different concentrations of methanol in red wine and vodka. The sensor is portable, rapid, and label free. There is no need to prepare glasses with rubbing layers or utilize expensive TEM grids which needs time-consuming and extra work. Therefore, the final cost of the sensor will be reduced.
Experimental Section
Materials
The liquid crystalline mixture (E7) consists of 4-cyano-4′-n-pentyl-1,1′-biphenyl (5CB), 4-cyano-4′-n-heptyl-1,1′-biphenyl (7CB), 4-cyano-4′-n-octyloxy-1,1′-biphenyl (8OCB), and 4-cyano-4″-n-pentyl-1,1′,1″-terphenyl (5CT). The right-handed chiral dopant (BDH1305) and methanol were purchased from Merck. The ordinary and extraordinary refractive indices of the LC are 1.525 and 1.734, respectively.
Fabrication of the Textile Grid
In this work, a polyester textile mesh fixed to a Plexiglas framework was used. We call it the “textile grid”, which is similar to the commercial TEM grids. The Plexiglas framework not only supports the polyester textile mesh but also provides the circle holes with a diameter of 5 mm surrounded with air at both sides (Figure 1). Choosing the textile mesh with the right dimensions is of great importance. Therefore, at the beginning of the work, different polyester textile meshes with different dimensions (160 × 160 μm2 and 600 × 600 μm2) were used to confine the LC, and the outcomes were evaluated by a polarized optical microscope (POM). Eventually, the textile grid containing square holes with edges of 300 μm and height of 40 μm was chosen. We call each square one “pixel”. Other dimensions were unable to support the capillary forces for enclosing the LC. This sensor is reusable many times. Before any use, it will thoroughly be cleaned with acetone, rinsed with deionized water, and dried under a stream of nitrogen gas. In the case of any damage to the polyester textile mesh, it can be replaced with another one as it is inexpensive. In addition, it needs only some glue to be attached to the Plexiglas framework.
Figure 1.

Schematic illustration of the experimental setup.
Preparation of the LC Sensor
Herein, various concentrations of BDH1305 were added to the nematic liquid crystal (E7) to induce a chiral structure. However, the concentration of 1 wt % was selected for its special pattern. A part of the textile grid was subsequently agitated with 0.01 μL of the CLC, and a number of square holes were filled completely. Then the kit was placed between two linear crossed polarizers of a polarized optical microscope (POM).
Measurements
The transmission mode of a POM (Leitz ANA-006, Germany) was used for optical observation of the textures. The images were captured utilizing a charge-coupled device (CCD) camera (Samwon STCTC83USB, Korea) mounted on the POM. Figure 1 demonstrates the schematic of the experimental setup. The alcoholic beverage containing various concentrations of methanol (0, 2, 4, and 6 wt %) was placed on the top surface of the CLC. The amount of alcoholic spirit in each experiment was 0.1 μL. Red wine and vodka were examined in this work. All the experiments have been performed 3 times. Image analysis was performed on polarized optical textures using an open-source image analysis software ImageJ.
Fabrication of a Smartphone-Based Device for Lab on a Chip Application
Utilization of the microscope for visualization of the textures limits the application of the sensor. In order to make an applicable, portable, and easy to use sensor a smartphone-based device is designed and fabricated. The images of the device are shown in Figure 2. The device is designed with CorelDraw software. The pattern is drawn on 3-mm white Plexiglas. Then the Plexiglas was cut down with a laser cutter (RT1390). Figure 2a–c demonstrates the process of putting the polarizer, the textile grid, and the analyzer into the box. The first polarizer and the textile grid are fixed, but the second polarizer (analyzer) is rotatable in a way that it could be perpendicular to the first one. The device has a backlight light emitting diode (LED). A 3.8 V battery will be attached to the LED through the socket. A booster circuit was used to amplify the 3.8 V battery to 18 V. The dimension of the device is 10.5 × 6 × 3.5 cm3. The battery socket as well as the power switch on and off is shown in Figure 2d. An objective lens is used to magnify the images and a smartphone is used to capture the images. Figure 2e shows the side view and Figure 2f the top view of the final device.
Figure 2.

Photograph images of the smartphone-based device. The process of sliding (a) the polarizer, (b) the textile grid, and (c) the analyzer. (d) The overall image of the device, (e) the side view, and (f) the top view of the device.
Results and Discussion
Figure 3 exhibits (a) microscopic and (b) SEM images of the textile grid utilized in the sensor.
Figure 3.

(a) Microscopic and (b) SEM images of the textile grid.
The configuration and dimension of the textile grid were selected in such a way that to confine the LC molecules. Furthermore, air is capable of providing boundary conditions for aligning the LC vertically, which makes a glass substrate unnecessary for the assay needless.31 Therefore, the helical axis of the CLCs are horizontal when the upside and downside of the CLCs in the textile grid are surrounded with air. In this state, a fingerprint pattern is anticipated to be observed.32,33Figure 4a illustrates a scheme of one of the pixels of the sensor as well as the relative crossed-polarized microscopic image. The image with green color which was captured with a 10× objective lens has a large mono domain in the center of the pixel surrounded with a few network-like lines or defects called oily streaks. The origin of the oily streaks texture is from inhomogeneities.34 In addition, a fingerprint texture can be observed indicating the pitch length of the CLC is on the order of micrometers. The fingerprint texture as well as oily streaks with different widths can be visibly observed in its corresponding polarized image shown in Figure 4c captured with a 40× objective lens. (These two images were not taken under the same conditions with the same sample. However, they are somewhat similar.) Knowing that the selective reflection will happen when the helical period is on the order of visible wavelength, the origin of this green color might not be from the selective Bragg reflection. In fact, in this helix pitch range, the CLC is unable to act as a photonic crystal demonstrating a reflection band gap in visible spectrum.35 Furthermore, according to the formula (λ = npcos θ) mentioned above, at normal incidence with respect to the helical axis of the CLC film, Bragg reflection does not happen; demonstrating the origin of this color is not from selective Bragg reflection.36 Therefore, birefringence or interference driven by birefringence (interference between ordinary and extraordinary lights) might give rise to the appearance of the green color. In the latter in contrast to the former the colors are visible without polarizers.33,36 It should be mentioned that in our work the colors can be observed without polarizers.
Figure 4.

Schematics configuration of the sensor (a) when the top and bottom of the CLC is surrounded with air and (b) after adding the mixture of alcoholic beverages at the top surface. (c) The output texture of the CLCs which are surrounded by air taken with a 40× objective lens. (d) The focal conic texture created by adding methanol on the top surface of the sensor.
Adding methanol on the top surface of CLCs disturbs the orientational order of LCs and randomizes the helical axes of CLCs. Thus, the CLC texture switches an oily streak state to scattering focal conic state.37 Optical observation of the focal conic texture occurring in our sample in the presence of methanol can be observed in Figure 4d. It can be deduced that methanol tends to reduce the domains of the output pattern of the CLC.
In the case of being surrounded with water on the top and air from the bottom, the behavior of CLCs is peculiar. They have hybrid alignment due to the homeotropic alignment on the bottom and nearly planar alignment from the top.32 The schematic configuration of the proposed sensing platform for one of the pixels as well as its relative crossed polarized optical image is illustrated in Figure 4b. In this work, the bottom of the CLCs is surrounded with air, and the top is covered with the alcoholic beverage with various concentrations of methanol. The mixture changes the alignment of the CLC molecules due to the material properties of the mixture such as polarity. Therefore, the alignment of the CLCs depends on the type of materials utilized on the top surface of the CLCs. Since the bottom surface is in contact with air, the alignment of the bottom surface will not change. The two different alignments propagate to the bulk LC which form a specific hybrid alignment for each concentration and mixtures. At the same time, the green color of the CLC turns to different colors and textures. The color change can be ascribed to alteration of the alignment and order parameter of LC molecules as well as the helical pitch which is different for each concentration and mixtures. Thus, the optical path length and the condition for constructive and destructive interference from this thin film will be changed. The output texture related to the red wine contains interference fringes covered with a low concentration of oily streaks. The behavior of vodka is somewhat different because its texture contains interference fringes in which the colors are different and covered with a high concentration of oily streaks as well as bubbles (Figure 4b). The presence of bubbles can be ascribed to the diffusion of evaporated ethanol molecules which are present in vodka in the thinner part of the top surface of CLCs and a phase transition from nematic to isotropic. The phase transition depends on the amount of ethanol which is present in alcoholic drinks. It should be noted that the concentration of ethanol in vodka is higher than in red wine. This is the reason why in vodka we can observe the bubbles.38,39
To study the real-time performance of the CLC sensor, 0.1 μL of two kinds of alcoholic beverages including red wine and vodka with various concentrations of methanol (0, 2, 4, and 6 wt %) are placed on the top surface of the CLC separately. Then, the corresponding crossed polarized optical images of the two pixels of the sensor were captured every 10 s after pouring the mixtures (Figures 5 and 6). As is observable from the images, the response time of the sensor is too low, which can be attributed to the high sensitivity of the helical pitch of the CLCs to target analytes in comparison to LC.40 Within the time interval of 10–100 s, the background color undergoes some changes for all of the samples. This is related to alteration of the interference pattern.38 In red wine, domain areas gradually increase as time goes on (Figure 5). However, these changes are not notable. In vodka (Figure 6) with 0 wt %, the images have no significant change except the background color. However, when the concentration of methanol in vodka is 2 and 4 wt %, a fair number of bubbles will appear at 30 s and they gradually increase by passing the time. For the vodka containing 6 wt % of methanol, the bubbles will emerge at 60 s. It seems that methanol tends to postpone the formation of bubbles.
Figure 5.

Crossed-polarized optical images of the CLC sensor taken every 10 s after pouring red wine containing various concentrations of methanol (0, 2, 4, and 6 wt %).
Figure 6.

Crossed-polarized optical images of the CLC sensor taken every 10 s after pouring vodka containing various concentrations of methanol (0, 2, 4, and 6 wt %).
To further evaluate the effect of the presence of methanol in red wine and vodka, the median intensity line graphs were processed with ImageJ software and presented in Figure 7a,b. The graphs indicate the changes of the median intensity of one of the pixels (the left one) of Figures 5 and 6 by passing the time. While obviously increasing methanol concentration in red wine results in a significant decline in intensity (Figure 7a), this trend is completely opposite in vodka; increasing methanol in vodka causes a dramatic rise (Figure 7b). Nevertheless, the lowest intensity value for vodka is higher than the lowest intensity value for red wine. When the concentration of methanol in vodka equals zero, the graph is nearly linear, demonstrating the stability of the intensity for vodka over the time.
Figure 7.

Demonstration of the variations of the median intensity of the left pixel of the assay as a function of time for (a) red wine and (b) vodka.
The cross-polarized optical images captured 50 s after pouring the mixtures, selected from Figures 5 and 6, are illustrated in Figure 8. A distinction between the patterns of the two different alcohols is obviously clear, indicating the capability of the proposed structure for determination of the type of alcoholic beverages and proves the selectivity of the proposed structure. The existence of methanol in alcoholic beverages results in different behaviors. Increasing the methanol in red wine increases the concentration of oily streaks, and as a result the background pattern will be hidden. The explanation behind this observation can be related to the effect of methanol on the output pattern, i.e., the reduction of the domain area. Raising the methanol concentration in vodka decreases the generated bubbles gradually. Furthermore, there is an expansion in domains as a consequence of a reduction in the concentration of oily streaks. The cause of the different behavior in vodka can be related to the presence of two mechanisms, one of which is the phase transition from nematic to isotropic caused by vodka and the other is switching from an oily streaks state to a focal conic state caused by methanol.
Figure 8.

Crossed-polarized microscopic images of the CLC sensor in contact with red wine and vodka with various concentrations of methanol (0, 2, 4, and 6 wt %).
To calculate the limit of detection (LOD) of the assay, each experiment was repeated three times. Then the average gray scale intensities and the standard deviations were calculated for various concentrations of methanol. It should be noted that the images used in the calculations were taken 50 s after pouring the mixtures. Figure 9 demonstrates the correlation between the gray intensity values and different concentrations of methanol in red wine and vodka as well as their corresponding standard deviations. It can be observed that by increasing the concentration of methanol in red wine the intensity will be decreased (Figure 9a), whereas by raising the concentration of methanol in vodka the intensity will be increased (Figure 9b). A linear curve was fitted to each diagram. The correlation coefficients are 0.993 and 0.995, respectively. The LOD was then calculated to be 0.98 wt % for red wine and vodka.41
Figure 9.

Average gray scale intensity values versus the concentration of methanol for (a) red wine and (b) vodka.
Conclusions
Methanol is a toxic material usually available in homemade or industrial wines. An unsafe amount of methanol in alcoholic spirits could pose numerous adverse effects on people’s health. Therefore, providing an inexpensive, easy to use, and portable device for monitoring beverages is of great importance. In this work, we addressed this issue by fabricating a hand-held sensor utilizing a textile grid impregnated with chiral nematic liquid crystal molecules. In fact, instead of using complicated, time-consuming, and expensive commercial TEM grids, we used an inexpensive textile grid which can be utilized many times. The previous sensing methods based on chiral nematic LCs benefit from changes occurring in the selective Bragg reflection in the visible spectrum. However, our proposed sensing mechanism is based on the optical observation of output textures. In this work, the helical pitch of the chiral nematic LC, surrounded with air, is in the order of micrometer which leads to the formation of a fingerprint texture. In addition, the texture contains interference fringes covered by some oily streaks defects. These textures as well as the intensity of the transmitted light can be altered by their surrounding materials as a result of the reorientation of LC molecules, and thus, it can be used for sensing. The proposed sensor is applied to detect low concentrations of methanol i.e., 0, 2, 4, and 6 wt % in red wine and vodka. Studying the sensor response to different concentrations of methanol for red wine in contrast to vodka demonstrates that the higher the concentration of methanol is the lower the light intensity will be. The selectivity of the proposed structure could be identified from observing distinct textures of these two drinks. The proposed assay is rapid as it can detect methanol in alcoholic beverages in less than 1 min. The limit of detection (LOD) of the proposed system is approximately 1 wt %.
Acknowledgments
The authors wish to thank Professor Roman Dabrowski for providing E7 and Professors Jan Lagerwall and Kristiaan Neyts for their helpful comments that improved the manuscript.
Author Contributions
Mohammadreza G. Shemirani: Methodology, Validation, Investigation, Data Curation. Fatemeh Habibimoghaddam: Validation, Investigation, Formal analysis, Data Curation, Visualization, Writing-original draft. Mohammad Mohammadimasoudi: Conceptualization, Methodology, Resources, Writing-review and editing, Supervision, Project administration, Funding acquisition. Mahboube Esmailpour: Validation, Investigation, Data Curation. Ali Goudarzi: Methodology, Validation, Investigation, Fabrication of the smartphone-based device and the kit.
The authors declare no competing financial interest.
References
- Saha U.; Dolai M.; Suresh Kumar G. Adaptable Sensor for Employing Fluorometric Detection of Methanol Molecules: Theoretical Aspects and DNA Binding Studies. New J. Chem. 2019, 43 (23), 8982–8992. 10.1039/C9NJ01018A. [DOI] [Google Scholar]
- Zhu Q.; Zhang Y. M.; Zhang J.; Zhu Z. Q.; Liu Q. J. A New and High Response Gas Sensor for Methanol Using Molecularly Imprinted Technique. Sensors Actuators, B Chem. 2015, 207 (Part A), 398–403. 10.1016/j.snb.2014.10.027. [DOI] [Google Scholar]
- Kumar V.; Kundu S.; Sk B.; Patra A. A Naked-Eye Colorimetric Sensor for Methanol and “turn-on” Fluorescence Detection of Al3+. New J. Chem. 2019, 43 (47), 18582–18589. 10.1039/C9NJ04688G. [DOI] [Google Scholar]
- Bindra P.; Hazra A. Dielectric Sensor System Using TiO2Nanotubes for Real-Time Detection of Methanol Contamination in Alcoholic Beverages. IEEE Trans. Instrum. Meas. 2020, 69 (9), 6621–6629. 10.1109/TIM.2020.2971328. [DOI] [Google Scholar]
- Botelho G.; Anjos O.; Estevinho L. M.; Caldeira I. Methanol in Grape Derived, Fruit and Honey Spirits: A Critical Review on Source, Quality Control, and Legal Limits. Processes 2020, 8 (12), 1–21. 10.3390/pr8121609. [DOI] [Google Scholar]
- Van Den Broek J.; Bischof D.; Derron N.; Abegg S.; Gerber P. A.; Güntner A. T.; Pratsinis S. E. Screening Methanol Poisoning with a Portable Breath Detector. Anal. Chem. 2021, 93 (2), 1170–1178. 10.1021/acs.analchem.0c04230. [DOI] [PubMed] [Google Scholar]
- van den Broek J.; Abegg S.; Pratsinis S. E.; Güntner A. T. Highly Selective Detection of Methanol over Ethanol by a Handheld Gas Sensor. Nat. Commun. 2019, 10 (1), 1–8. 10.1038/s41467-019-12223-4. [DOI] [PMC free article] [PubMed] [Google Scholar]
- Jin Z.; He H.; Zhao H.; Borjigin T.; Sun F.; Zhang D.; Zhu G. A Luminescent Metal-Organic Framework for Sensing Methanol in Ethanol Solution. Dalt. Trans. 2013, 42 (37), 13335–13338. 10.1039/c3dt51414e. [DOI] [PubMed] [Google Scholar]
- Wang M. L.; Wang J. T.; Choong Y. M. Simultaneous Quantification of Methanol and Ethanol in Alcoholic Beverage Using a Rapid Gas Chromatographic Method Coupling with Dual Internal Standards. Food Chem. 2004, 86 (4), 609–615. 10.1016/j.foodchem.2003.10.029. [DOI] [Google Scholar]
- Wang C.; Kou X.; Xie N.; Guo L.; Sun Y.; Chuai X.; Ma J.; Sun P.; Wang Y.; Lu G. Detection of Methanol with Fast Response by Monodispersed Indium Tungsten Oxide Ellipsoidal Nanospheres. ACS Sensors 2017, 2 (5), 648–654. 10.1021/acssensors.7b00028. [DOI] [PubMed] [Google Scholar]
- Ou T. H.; Wang Y.; Fang D.; Narayanan S. R.; Wu W. Detection of Fake Alcoholic Beverages Using Electrolyte-Free Nanogap Electrochemical Cells. ACS Appl. Mater. Interfaces 2019, 11 (6), 6217–6223. 10.1021/acsami.8b18729. [DOI] [PubMed] [Google Scholar]
- Abegg S.; Magro L.; van den Broek J.; Pratsinis S. E.; Güntner A. T. A Pocket-Sized Device Enables Detection of Methanol Adulteration in Alcoholic Beverages. Nat. Food 2020, 1 (6), 351–354. 10.1038/s43016-020-0095-9. [DOI] [PubMed] [Google Scholar]
- Taheri M. S.; Moghaddam H. H.; Moharamzad Y.; Dadgari S.; Nahvi V. The Value of Brain CT Findings in Acute Methanol Toxicity. Eur. J. Radiol. 2010, 73 (2), 211–214. 10.1016/j.ejrad.2008.11.006. [DOI] [PubMed] [Google Scholar]
- Kucera I.; Sedlacek V. An Enzymatic Method for Methanol Quantification in Methanol/Ethanol Mixtures with a Microtiter Plate Fluorometer. Food Anal. Methods 2017, 10 (5), 1301–1307. 10.1007/s12161-016-0692-2. [DOI] [Google Scholar]
- Jornet-Martínez N.; Gómez-Ojea R.; Tomás-Huercio O.; Herráez-Hernández R.; Campíns-Falcó P. Colorimetric Determination of Alcohols in Spirit Drinks Using a Reversible Solid Sensor. Food Control 2018, 94 (June), 7–16. 10.1016/j.foodcont.2018.06.020. [DOI] [Google Scholar]
- Sharma K.; Sharma S. P.; Lahiri S. Novel Method for Identification and Quantification of Methanol and Ethanol in Alcoholic Beverages by Gas Chromatography-Fourier Transform Infrared Spectroscopy and Horizontal Attenuated Total ReflectanceFourier Transform Infrared Spectroscopy. J. AOAC Int. 2009, 92 (2), 518–526. 10.1093/jaoac/92.2.518. [DOI] [PubMed] [Google Scholar]
- Sirhan A. Y.; Wong R. C. S.; Abdulra’uf L. B.; Abd Aljabar J.; Mostafa A.; Talhouni A. Simultaneous Determination of Ethanol and Methanol in Alcohol Free Malt Beverages, Energy Drinks and Fruit Juices by Gas Chromatography. AJAB 2019, 7, 183–189. [Google Scholar]
- Vaskova H. Spectroscopic Determination of Methanol Content in Alcoholic Drinks. Int. J. Biol. Biomed. Eng. 2014, 8 (January), 27–34. [Google Scholar]
- Bera T.; Fang J. Polyelectrolyte-Coated Liquid Crystal Droplets for Detecting Charged Macromolecules. J. Mater. Chem. 2012, 22 (14), 6807–6812. 10.1039/c2jm00038e. [DOI] [Google Scholar]
- Luan C.; Luan H.; Luo D. Application and Technique of Liquid Crystal-Based Biosensors. Micromachines 2020, 11 (2), 1–19. 10.3390/mi11020176. [DOI] [PMC free article] [PubMed] [Google Scholar]
- Nandi R.; Pal S. K. Liquid Crystal Based Sensing Device Using a Smartphone 2018, (January), 1046–1052. 10.1039/c7an01987d. [DOI] [PubMed] [Google Scholar]
- Ho T. Y.; Lan Y.-H. H.; Huang J.-W. W.; Chang J.-J. J.; Chen C.-H. H. Using Diazotization Reaction to Develop Portable Liquid-Crystal-Based Sensors for Nitrite Detection. ACS Omega 2020, 5 (20), 11809–11816. 10.1021/acsomega.0c01233. [DOI] [PMC free article] [PubMed] [Google Scholar]
- Qi L.; Liu S.; Jiang Y.; Lin J. M.; Yu L.; Hu Q. Simultaneous Detection of Multiple Tumor Markers in Blood by Functional Liquid Crystal Sensors Assisted with Target-Induced Dissociation of Aptamer. Anal. Chem. 2020, 92 (5), 3867–3873. 10.1021/acs.analchem.9b05317. [DOI] [PubMed] [Google Scholar]
- Hartono D.; Xue C.-Y.; Yang K.-L.; Yung L.-Y. L. Decorating Liquid Crystal Surfaces with Proteins for Real-Time Detection OfSpecific Protein-Protein Binding. Adv. Funct. Mater. 2009, 19 (22), 3574–3579. 10.1002/adfm.200901020. [DOI] [Google Scholar]
- Ding X.; Yang K. L. Liquid Crystal Based Optical Sensor for Detection of Vaporous Butylamine in Air. Sensors Actuators, B Chem. 2012, 173, 607–613. 10.1016/j.snb.2012.07.067. [DOI] [Google Scholar]
- Devi M.; Nandi R. Liquid Crystal Based Detection of Pb(II) Ions Using Spinach RNA as Recognition Probe. Langmuir 2019, (May), 7816. 10.1021/acs.langmuir.8b04018. [DOI] [PubMed] [Google Scholar]
- Amabilino D.; Yashima E.. Irreversible Visual Sensing of Humidity Using a Cholesteric Liquid Crystal. ChemComm 2012, 48( (March), ). 4579–4581. 10.1039/c2cc16934g. [DOI] [PubMed] [Google Scholar]
- Chang C. K.; Bastiaansen C. M. W.; Broer D. J.; Kuo H. L. Alcohol Responsive, Hydrogen Bonded, Cholesteric Liquid Crystal Networks. Adv. Funct. Mater. 2012, 22 (13), 2855–2859. 10.1002/adfm.201200362. [DOI] [Google Scholar]
- Mujahid A.; Stathopulos H.; Lieberzeit P. A.; Dickert F. L. Solvent Vapour Detection with Cholesteric Liquid Crystals-Optical and Mass-Sensitive Evaluation of the Sensor Mechanism. sensors 2010, 10, 4887–4897. 10.3390/s100504887. [DOI] [PMC free article] [PubMed] [Google Scholar]
- Chang C.; Bastiaansen C. W. M.; Broer D. J.; Kuo H. Discrimination of Alcohol Molecules Using Hydrogen-Bridged Cholesteric Polymer Networks. Am. Chem. Soc. 2012, 45 (May 16), 4550–4555. 10.1021/ma3007152. [DOI] [Google Scholar]
- Hartono D.; Bi X.; Yang K. L.; Yung L. Y. L. An Air-Supported Liquid Crystal System for Real-Time and Label-Free Characterization of Phospholipases and Their Inhibitors. Adv. Funct. Mater. 2008, 18 (19), 2938–2945. 10.1002/adfm.200800424. [DOI] [Google Scholar]
- Popov P.; Mann E. K.; Jákli A. Thermotropic Liquid Crystal Films for Biosensors and Beyond. J. Mater. Chem. B 2017, 5 (26), 5061–5078. 10.1039/C7TB00809K. [DOI] [PubMed] [Google Scholar]
- Perera K.; Nemati A.; Hegmann T. Converging Microlens Array Using Nematic Liquid Crystals Doped with Chiral Nanoparticles 2021, 13, 4574. 10.1021/acsami.0c21044. [DOI] [PubMed] [Google Scholar]
- Lavrentovich O. D.; Yang D. K.. Cholesteric Cellular Patterns with Electric-Field-Controlled Line Tension. Phys. Rev. E - Stat. Physics, Plasmas, Fluids, Relat. Interdiscip. Top. 1998, 57( (6), ). R6269. 10.1103/PhysRevE.57.R6269. [DOI] [Google Scholar]
- Kim D. K.; Hwang M.; Lagerwall J. P. F. Liquid Crystal Functionalization of Electrospun Polymer Fibers. J. Polymer Sci B 2013, 51, 855–867. 10.1002/polb.23285. [DOI] [Google Scholar]
- Lagerwall J. P. F.; Schütz C.; Salajkova M.; Noh J.; Park J. H.; Scalia G.; Bergström L. Cellulose Nanocrystal-Based Materials: From Liquid Crystal Self-Assembly and Glass Formation to Multifunctional Thin Films. NPG Asia Mater. 2014, 6, e80. 10.1038/am.2013.69. [DOI] [Google Scholar]
- Kumar P.; Kang S.-W.; Lee S. H. Advanced Bistable Cholesteric Light Shutter with Dual Frequency Nematic Liquid Crystal. Opt. Mater. Express 2012, 2 (8), 1121. 10.1364/OME.2.001121. [DOI] [Google Scholar]
- Shibaev P. V.; Wenzlick M.; Murray J.; Tantillo A.; Howard-Jennings J. Rebirth of Liquid Crystals for Sensoric Applications: Environmental and Gas Sensors. Adv. Condens. Matter Phys. 2015, 2015, 1. 10.1155/2015/729186. [DOI] [Google Scholar]
- Vale A.Alcohols and Glycols; Elsevier Science B.V., 2016; Vol. 44. 10.1016/j.mpmed.2015.12.001. [DOI] [Google Scholar]
- Norouzi S.; Sadati M. Annals of Liquid Crystal-Based Biosensors 2020, 1–4. 10.33552/ABBA.2020.04.000590. [DOI] [Google Scholar]
- Duong T. D. S.; Jang C. H. Detection of Arginase through the Optical Behaviour of Liquid Crystals Due to the PH-Dependent Adsorption of Stearic Acid at the Aqueous/Liquid Crystal Interface. Sensors Actuators, B Chem. 2021, 339 (April), 129906. 10.1016/j.snb.2021.129906. [DOI] [Google Scholar]