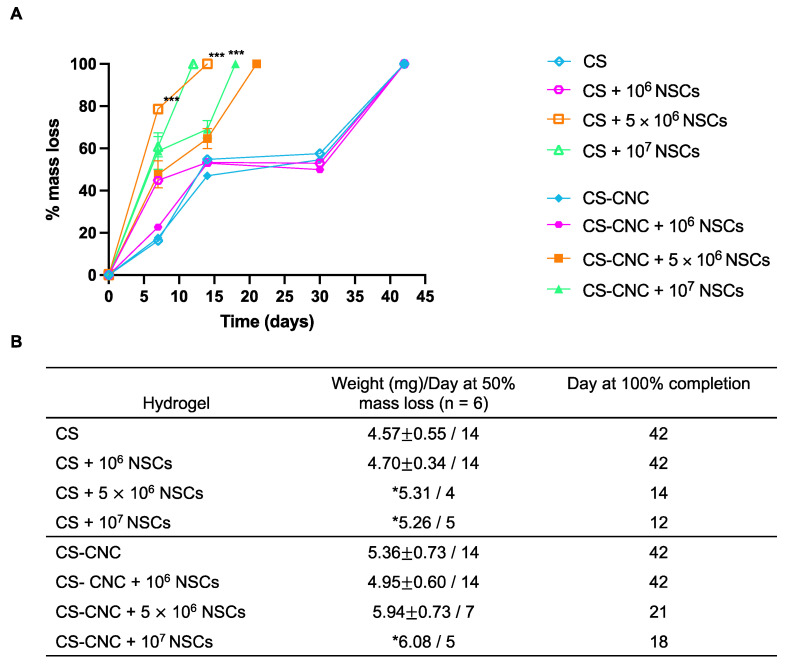
Figure 5.
Effect of NSCs on hydrogel degradation over time. (A) Percent mass loss of CS-CNC hydrogels with and without NSCs (n = 6, 200 µL samples; *** indicates p < 0.0001). (B) Summary table of mass at 50% degradation, time to 50% mass loss (days), and time to 100% completion (days) (mass represented as mean standard deviation (SD); * indicates weight obtained from extrapolated hydrogel mass at 50% mass loss).

