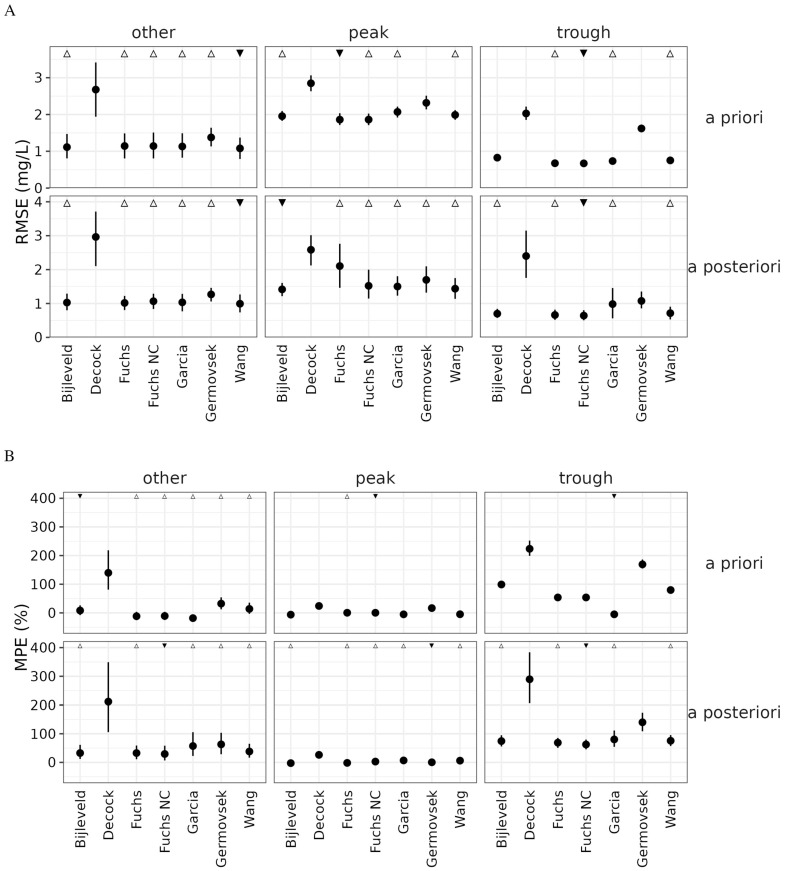
Figure 4.
Prediction error of gentamicin population pharmacokinetic models for neonates, assessed by (A) root mean square error (RMSE) and (B) mean percent error (MPE). Closed circles (vertical bars) represent the median (5th to 95th percentile) of 1000 bootstraps. Statistical significance was determined by presence of overlapping confidence intervals: ▼ represents the model with lowest median RMSE in that category; △ represents models not statistically different from the best model. Fuchs NC: Fuchs, no covariance.

