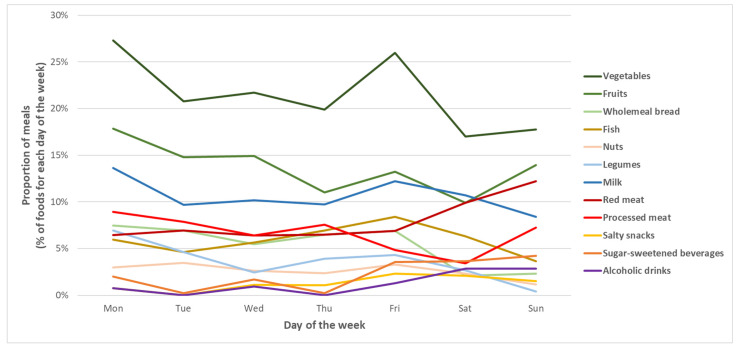
Figure 3.
Proportions of meals over the week, stratified for specific foods. Lines represent trends of the percentages of meals occurring over the week for specific food categories. For each day of the week, proportions are obtained by dividing the number of meals including specific foods by the total number of meals.

