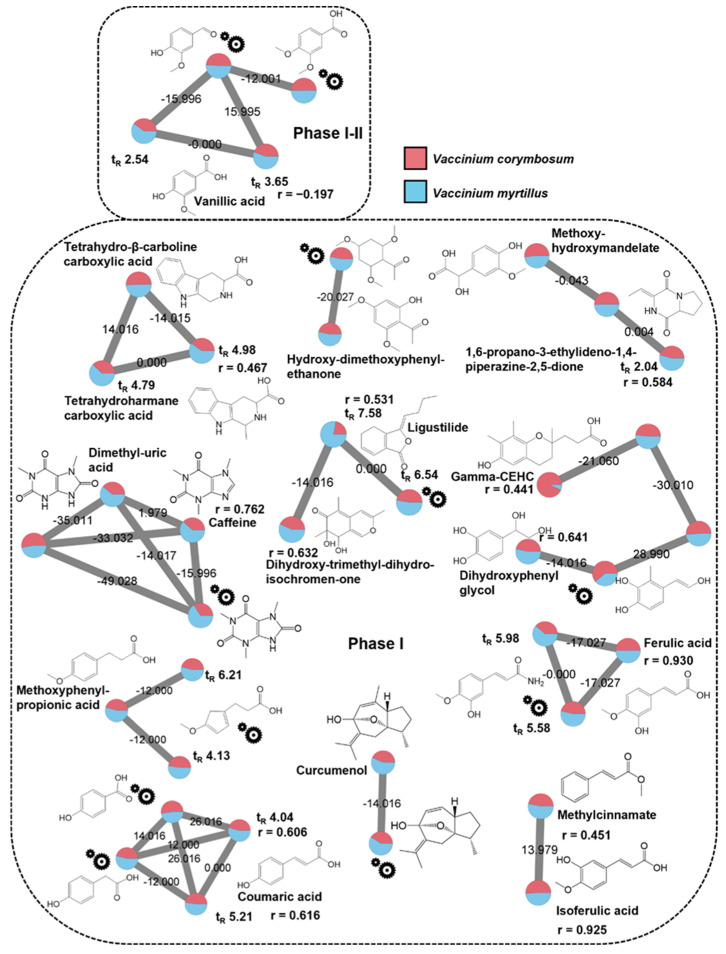
Figure 4.
Extracted molecular families of identified metabolites in positive ionization mode listed in Table S2, belonging to the category of (poly)phenolic derivatives and plant endogenous constituents. Dashed boxes group the identified metabolites according to the phase I and II metabolism following PPMC analysis. The “gear” symbols refer to the putative structure identified by manual investigation as reported in Section 2.6 of the main text. Statistically significant Pearson correlation coefficients (r) are reported. Edge labels refer to the mass difference between two nodes.

