

Abstract
In vitro blood-brain barrier (BBB) models have played an important role in studying processes such as immune cell trafficking and drug delivery, as well as contributing to the understanding of mechanisms of disease progression. Many biological and pathological processes in the cerebrovasculature occur in capillaries and hence the lack of robust hierarchical models at the capillary scale is a major roadblock in BBB research. Here we report on a double-templating technique for engineering hierarchical BBB models with physiological barrier function at the capillary scale. We first demonstrate the formation of hierarchical vascular networks using human umbilical vein endothelial cells. We then characterize barrier function in a BBB model using brain microvascular endothelial-like cells (iBMECs) differentiated from induced pluripotent stem cells (iPSCs). Finally, we characterize immune cell adhesion and transmigration in response to perfusion with the inflammatory cytokine tumor necrosis factor-alpha, and show that we can recapitulate capillary-scale effects, such as leukocyte plugging, observed in mouse models. Our double-templated hierarchical model enables the study of a wide range of biological and pathological processes related to the human BBB.
Keywords: Blood-brain barrier, capillary, immune cell transmigration
Graphical Abstract
A double-templating system is developed for tissue engineering a blood-brain barrier model (BBB) at the capillary scale with physiological barrier function. The model recapitulates key processes associated with neuroiflammation.
Introduction
The human vasculature supplies nutrients to tissues and removes waste through a vast network of arteries, arterioles, capillaries, venules, and veins. In the brain, the highly specialized brain microvascular endothelial cells (BMECs) and supporting cells that define the blood-brain barrier (BBB) regulate the transport of molecules and cells into and out of the brain [1]. Brain capillary endothelium comprises over 85% of the total surface area of the BBB and is the major location for nutrient exchange [2]. Advances in tissue engineering and stem cell technology have led to development of more complex BBB models that incorporate patient-derived cells and enable real-time, high-magnification imaging of biological and pathological processes relevant to brain health [3]. Despite recent progress [3d, 4], the lack of hierarchical capillary-scale BBB models with physiological barrier function represents a major roadblock to BBB research.
Many techniques have been developed to engineer 3-dimensional (3D) blood vessels in vitro such as templating [3a–c, 5], lithography [6], photoablation [7], 3D printing [8], and self-assembly [9]. Direct templating, using metal or glass rods, allows precise control of the diameter of microvessels but poses various obstacles in engineering vascular networks. Indirect templating with a sacrificial material, such as gelatin, enables the generation of complex vascular structures, but restricts the vessel diameter to more than 50 μm [10]. Photoablation has been used to create microvessel channels, but can cause endothelial cell injury in the gel matrix [7]. Although templating, photoablation, and lithographic approaches can be used to form capillary-scale channels, endothelial cells are typically lager than the channel diameter and hence cell seeding and lumen formation is extremely challenging [7, 11]. 3D printing allows the fabrication of more complex vascular structures but the resolution is generally limited to a few hundred microns, which is larger than scale of capillaries [12]. Self-assembly processes have also been used to create vascular networks [9b, 13], although these structures are generally heterogeneous with average diameters of 50 μm or more [13].
The objective of this study was to create a hierarchical tissue-engineered BBB model with source microvessel (arteriole), one or more capillary-scale vessels, and a sink microvessel (venule). We first demonstrate the feasibility of using a double-templating method to create the hierarchical structure in a hydrogel matrix and showed that we can recapitulate physiological flow rates and shear stresses in devices without cells. We next demonstrate the formation of a generic hierarchical model using human umbilical vein endothelial cells (HUVECs). Finally, we fabricate a brain-specific model using induced brain microvascular endothelial-like cells (iBMECs) along with isogenic induced endothelial cells (iECs) for comparison. We confirm expression of BBB-specific markers and demonstrate that the capillary-scale vessels maintain physiological barrier function. Finally, we characterize immune cell interactions following activation with tumor necrosis factor-alpha (TNFα) and observe immune cell adhesion and transmigration. In addition, we recapitulate immune cell plugging, a capillary-scale effect observed in mouse models.
Materials and Methods
Materials
All chemicals and materials were purchased from Sigma-Aldrich (St. Louis, MO) unless otherwise indicated. Rat tail type I collagen and Matrigel were obtained from Corning Inc. (Corning, NY). 70 kDa Dextran-Texas Red™, 500 kDa Dextran-FITC, CellTracker™ Deep Red Dye, Calcein AM, 2 μm fluorescent microspheres labelled with Cy3, 0.2 μm fluorescent microspheres with blue fluorescence (365/415), rhodamine 123, StemPro accutase, M200 medium, Low Serum Growth Supplement (LSGS), RPMI-1640 medium, Fetal Bovine Serum (FBS), Bovine Serum Albumin (BSA), Penicillin-Streptomycin, and glass slides were obtained from Thermo Fisher (Waltham, MA). 150 μm diameter super-elastic nitinol rod was purchased from Malin Co. (Cleveland, OH). A hot glue gun and sticks were purchased from World Precision Instruments (Sarasota, FL). Sylgard 164 and 184 polydimethylsiloxanes (PDMS) were purchased from Dow Corning (Midland, MI).
BC1-iPSCs were provided by Dr. Linzhao Cheng (Johns Hopkins University). The WTC-iPSC line with red fluorescent protein-tagged plasma membrane (WTC-iPSC-RFP) was obtained from Allen Cell Institute (Seattle, WA). HUVECs were obtained from PromoCell (Heidelberg, Germany). Green fluorescent protein-expressing Human Umbilical Vein Endothelial Cells (GFP-HUVECs) were obtained from Angio-Proteomie (Boston, MA). Human THP1 immune cells were purchased from ATCC (Manassas, VA).
Methods
Fabrication of microfluidic chip
The aluminum mold for the PDMS microfluidic chip was fabricated by Computer Numerical Control machining (Fig. S1a). PDMS was poured into the mold and allowed to cure at 80 °C. Different ports were created by hole punching (Fig. S1b). The PDMS chip was then plasma treated and attached to a 24 × 50 mm glass slide. Nitinol rods with a diameter of 150 μm were inserted into the microfluidic chip and secured with PDMS. The devices were washed with 70% ethanol and dried with an air gun. Polymer fibers with diameters from 7 to 60 μm were pulled with tweezers from a hot glue gun followed by sterilization with 70% ethanol. For fibers with target diameter of 10 μm, the average diameter was 9.7 ± 1.9 μm (mean ± SD) (n = 6 fibers). For fibers with target diameter of 40 μm, the average diameter was 43.7 ± 3.9 μm (mean ± SD) (n = 6 fibers). The polymer fibers were assembled underneath the two nitinol rods (templates for arteriole and venule) through the fiber ports (Fig. S1c). The internal surface of the microfluidic chip was coated with poly-L-lysine overnight. Residual solution was removed by washing with double distilled water before the introduction of the hydrogel into the device.
Gelation of the devices
Agarose hydrogel: a 2% agarose solution was heated and added to the hydrogel chambers of the microfluidic device. After solidification of the agarose hydrogel, phosphate-buffered saline (PBS) was added to the cell loading ports followed by the removal of the polymer fibers and nitinol rods. The channel segments formed by the fibers above the arteriole and below the venule were sealed with agarose and PDMS. Then the devices were used for perfusion of microspheres.
Collagen hydrogel: 7 mg mL−1 collagen or a mixture of 7 mg mL−1 collagen with 1.5 mg mL−1 Matrigel was injected into the microfluidic device and allowed to gel at 37 °C for around 10 min. Agarose was used to stabilize the cell inlet ports and fiber ports. The devices were placed on ice overnight to remove air bubbles in the gels.
Cell culture and differentiation
HUVECs and GFP-HUVECs were maintained in M200 medium supplemented with LSGS. HUVECs from passages 4 to 8 were used in all experiments. iBMECs were differentiated from iPSCs and maintained according to previously published protocols [14]. iBMECs differentiated from WTC-iPSC-RFPs were denoted as RFP-iBMECs and iBMECs differentiated from BC1-iPSCs were denoted as BC1-iBMECs. iECs were differentiated from BC1-iPSCs and maintained following a previously published protocol [15]. THP1 cells were maintained in RPMI-1640 medium supplemented with 10% FBS and 1% Penicillin/Streptomycin.
Flow simulations
Computer simulations of flow in the source and sink microvessels (arteriole and venule) and the capillary-scale channels were performed using COMSOL Multiphysics 5.5 with a laminar flow module. The pressure for the source channel was set to 120 Pa (modeling conditions of an arteriole) and the pressure for the sink channel (modeling conditions of a venule) was set to 80 Pa to match the average flow pressures in the experimental conditions. The density and dynamic viscosity of the medium were set as 1,000 kg m−3 and 0.9 mPa·s, respectively.
Flow velocity quantification
Tracking of fluorescent beads was used to quantify flow in the microvessels and capillaries. 2 μm diameter fluorescently labelled microspheres diluted in PBS solution (1/5000) were injected into the inflow port of the arteriole (~120 Pa), and PBS was added to the inflow port of venule (~80 Pa). Fluorescence images were obtained at an exposure time of 50 ms (Nikon, Eclipse Ti-E). The flow velocity was obtained from the length of the microsphere trails divided with the exposure time. Analysis was performed by two independent researchers. Post-evaluation analysis revealed less than 5% difference in flow velocity. There was no statistical difference between independent analysis of the same images.
Cell seeding of microfluidic devices
Following assembly of the device and introduction of the hydrogel, the template rods for the two microvessels were removed but the polymer fiber templates for the capillaries were left in place. Endothelial cells were added to the cell loading ports of the two microvessels (arteriole and venule) in each device. The optimum seeding densities were dependent on cell type: HUVECs, GFP-HUVECs, and iECs were seeded at a cell density of 20 × 106 mL−1 whereas iBMECs (BC1-iBMECs and RFP-iBMECs) were seeded at 80 × 106 mL−1. Seeding iBMECs at 20 × 106 mL−1 did not result in formation of a confluent monolayer. The microvessels were then perfused with cell culture medium to remove the excess cells. Following adhesion and spreading of endothelial cells in the microvessels, the polymer fibers were then removed. The channel segments formed by the fibers above the arteriole and below the venule were sealed with agarose and PDMS. The microvessels were then independently perfused with cell culture media using a gravity flow system to allow cells to grow into the capillary channels. The medium in the flow reservoirs was replenished every 8 hours. The estimated average pressure in the arteriole was ~120 Pa (12 mm H2O), while the estimated average pressure in the venule was ~80 Pa (8 mm H2O).
Quantification of capillary growth rate, wall thickness, and lumen diameter
For quantification of the capillary growth rate, time-lapse phase contrast images were acquired every 30 mins on an inverted microscope (Nikon TE2000) in a live cell chamber at 37 °C and 5% CO2. The capillary growth rate was calculated from the distance between a lead cell and the microvessel from which it originated (arteriole or venule) as a function of time. For quantification of the capillary wall thickness and lumen diameter, confocal images were acquired on an inverted microscope (Nikon Eclipse TiE) using a 40x objective. The wall thickness and lumen diameter were obtained from analysis of the confocal images in ImageJ by two independent researchers. The average differences in lumen diameter and wall thickness were less than 1% and there was no statistical difference between independent analysis of the same images.
Barrier function
The barrier function of capillaries was assessed based on restriction of different molecular weight solutes 2 – 4 days after cell seeding. Cell culture medium supplemented with solute was perfused through the arterioles and epifluorescence images were recorded on an inverted microscope (Nikon Eclipse TiE) using a 10x objective at different time points. Solutes included: (1) 500 kDa dextran-FITC (0.1 μM), (2) 70 kDa Dextran-Texas Red™ (0.5 μM), and (3) rhodamine 123 (1.5 μM, MW = 381 Da). Although solute permeability can be determined for single microvessel[3a, 3e, 16], due to the additive effect of solute transport from the microvessels and capillaries, we were not able to validate quantitative calculation of permeability in the capillaries.
Immunostaining
For immunostaining of endothelial cell and BBB markers, microvessels were fixed and stained 2 – 4 days following cell seeding. The gels containing the two microvessels and capillaries were extracted from the device after fixation in 4% paraformaldehyde solution at 4 °C overnight followed by 30% sucrose perfusion. The fixed devices were snap-frozen with liquid nitrogen and sectioned into 20 μm slices with a cryostat (CM1860, Leica) for immunostaining. Sections were blocked with 2% BSA solution, incubated with primary antibodies (Table S1), washed with PBS, incubated with secondary antibodies (Table S2), washed again with PBS, mounted in Fluoromount-G with DAPI, and imaged with a fluorescence microscope (Eclipse Ti-E, Nikon). The integrated fluorescence intensity of each channel was extrapolated in ImageJ. The fluorescence intensity of TNFα treated group was normalized to the corresponding intensity of the control without treatment.
Immune cell perfusion
To assess immune response, iEC and BC1-iBMEC capillaries were treated by medium supplemented with (w/ TNFα group) or without TNFα (w/o TNFα control group) (5 ng mL−1) for one day prior to perfusion with leukocytes. All treatments were performed 2 – 4 days post seeding. THP1 cells were stained with Deep Red Cell Tracker and vessels were stained with Calcein AM according to the manufacturer’s protocols. THP1 cells were perfused through the arteriole at a density of 106 cells mL−1 in medium with (w/ TNFα group) or without TNFα (w/o TNFα control group) for 5 min. The flow velocity of THP1 cells was determined from images using ImageJ. The devices were then continuously perfused with either cell culture medium for the control group or medium supplemented with TNFα for the TNFα treated group. The number of adherent leukocytes in the capillaries was quantified in ImageJ and normalized to the surface area. For quantification of immune cell crawling speed, time-lapse images with 5 min interval were collected over 1 hour using an inverted microscope (Nikon Eclipse TiE) with a 10x objective. The crawling speed was calculated from the net distance that cells crawled along the capillary axis in 1 hour in ImageJ. Analysis was performed by 2 independent researchers. The average difference in crawling speed was less than 10% and there was no statistical difference between independent analysis of the same time lapse images. Confocal microscopy was used for quantification of THP1 transmigration. The transmigration ratio was defined as the ratio of THP1 cells that were undergoing transmigration or had completed transmigration to the total number of adherent THP1 cells at different time points in capillaries.
Statistics
All the data are shown as mean ± SD using Prism 8.0 (GraphPad, La Jolla). A Shapiro-Wilk test (Prism 8.0) was used to confirm normality for all variables with n larger than 9 observations (THP1 crawling velocity, THP1 flow velocity, number of adherent THP1 cells). Only the number of adherent THP1 cells passed the normality test. Man-Whitney test was performed for comparison of two groups. Two-way analysis of variance (ANOVA) was used to test the effect of TNFα on the number of adherent THP1 cells. The result was considered statistically significant for p < 0.05.
Results and Discussion
Fabrication of microvessel channels
The human vasculature is hierarchical with diameters ranging from centimeters in large arteries to around 7 – 10 μm in small capillaries. Capillary beds in organs serve many functions including delivery of nutrients and removal of waste products. The fabrication of perfusable capillary scale structures in vitro has been challenging. 3D printing can produce larger scale vascular structures, but do not currently have the resolution for capillary scale structures. Self-assembly has been used to produce capillary scale networks. However, self-assembly process is relatively slow since it relies on cell migration in a 3D matrix: the average growth rate for angiogenesis-driven capillary formation is about 50 μm per day in in vitro microfluidic platforms [17]. The direct templating approach is relatively straightforward and inexpensive, enabling placement of cylindrical capillaries of defined dimensions in defined locations in a 2D plane to facilitate imaging. Forming capillary-scale structures by direct templating is challenging because it requires direct seeding of singularized endothelial cells into a small channel, which usually leads to occlusion or incomplete lumen formation. Here we used a double templating approach to fabricate a hierarchical network with perfusable channels representing arteriole, capillaries, and venule. Cells were first seeded into the larger channels to form the arteriole and venule. After the formation of a confluent monolayer in the microvessels, endothelial cells from arteriole and venule microvessels were allowed to migrate, rather than flow, into the capillary channels to prevent occlusion.
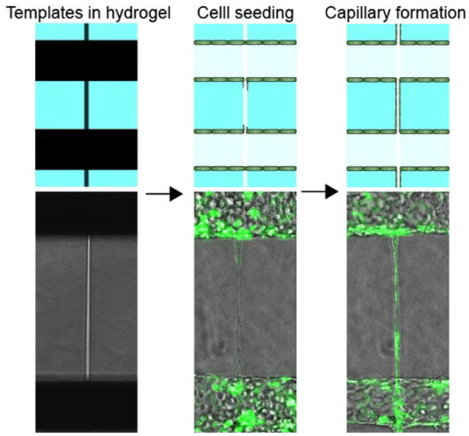
In the double templating approach, two parallel microvessel channels, corresponding to arteriole and venule, are first formed using 150 μm diameter template rods (Fig. 1a and Fig. S1c). This templating method has been widely used to fabricate microvessels on the 100 – 500 μm scale [3a–c, 5]. The two microvessel channels have separate inlet and outlet ports to enable independent control of flow parameters and perfusion with molecules or cells. Polymer fibers with diameters as small as 7 μm can be easily fabricated using fiber pulling (Fig. S1d). Polymer fibers with different diameters can be located at different locations on the microvessel template rods to define a network structure in a wide range of configurations (Fig. 1b, S1e). We first demonstrated that a capillary network could be achieved in an agarose hydrogel (Fig. 1c). After the removal of the rods and polymer fibers, the microvessel and capillary channels were intact and perfusable, as shown by successful perfusion with fluorescent microspheres (Fig. 1d). We next demonstrated that double-templating can be used to form perfusable capillary-scale channels in two hydrogels widely used in tissue engineering: collagen (Fig. 1e) and fibrin (Fig. S1f).
Fig. 1. Characterization of microvessel channels.
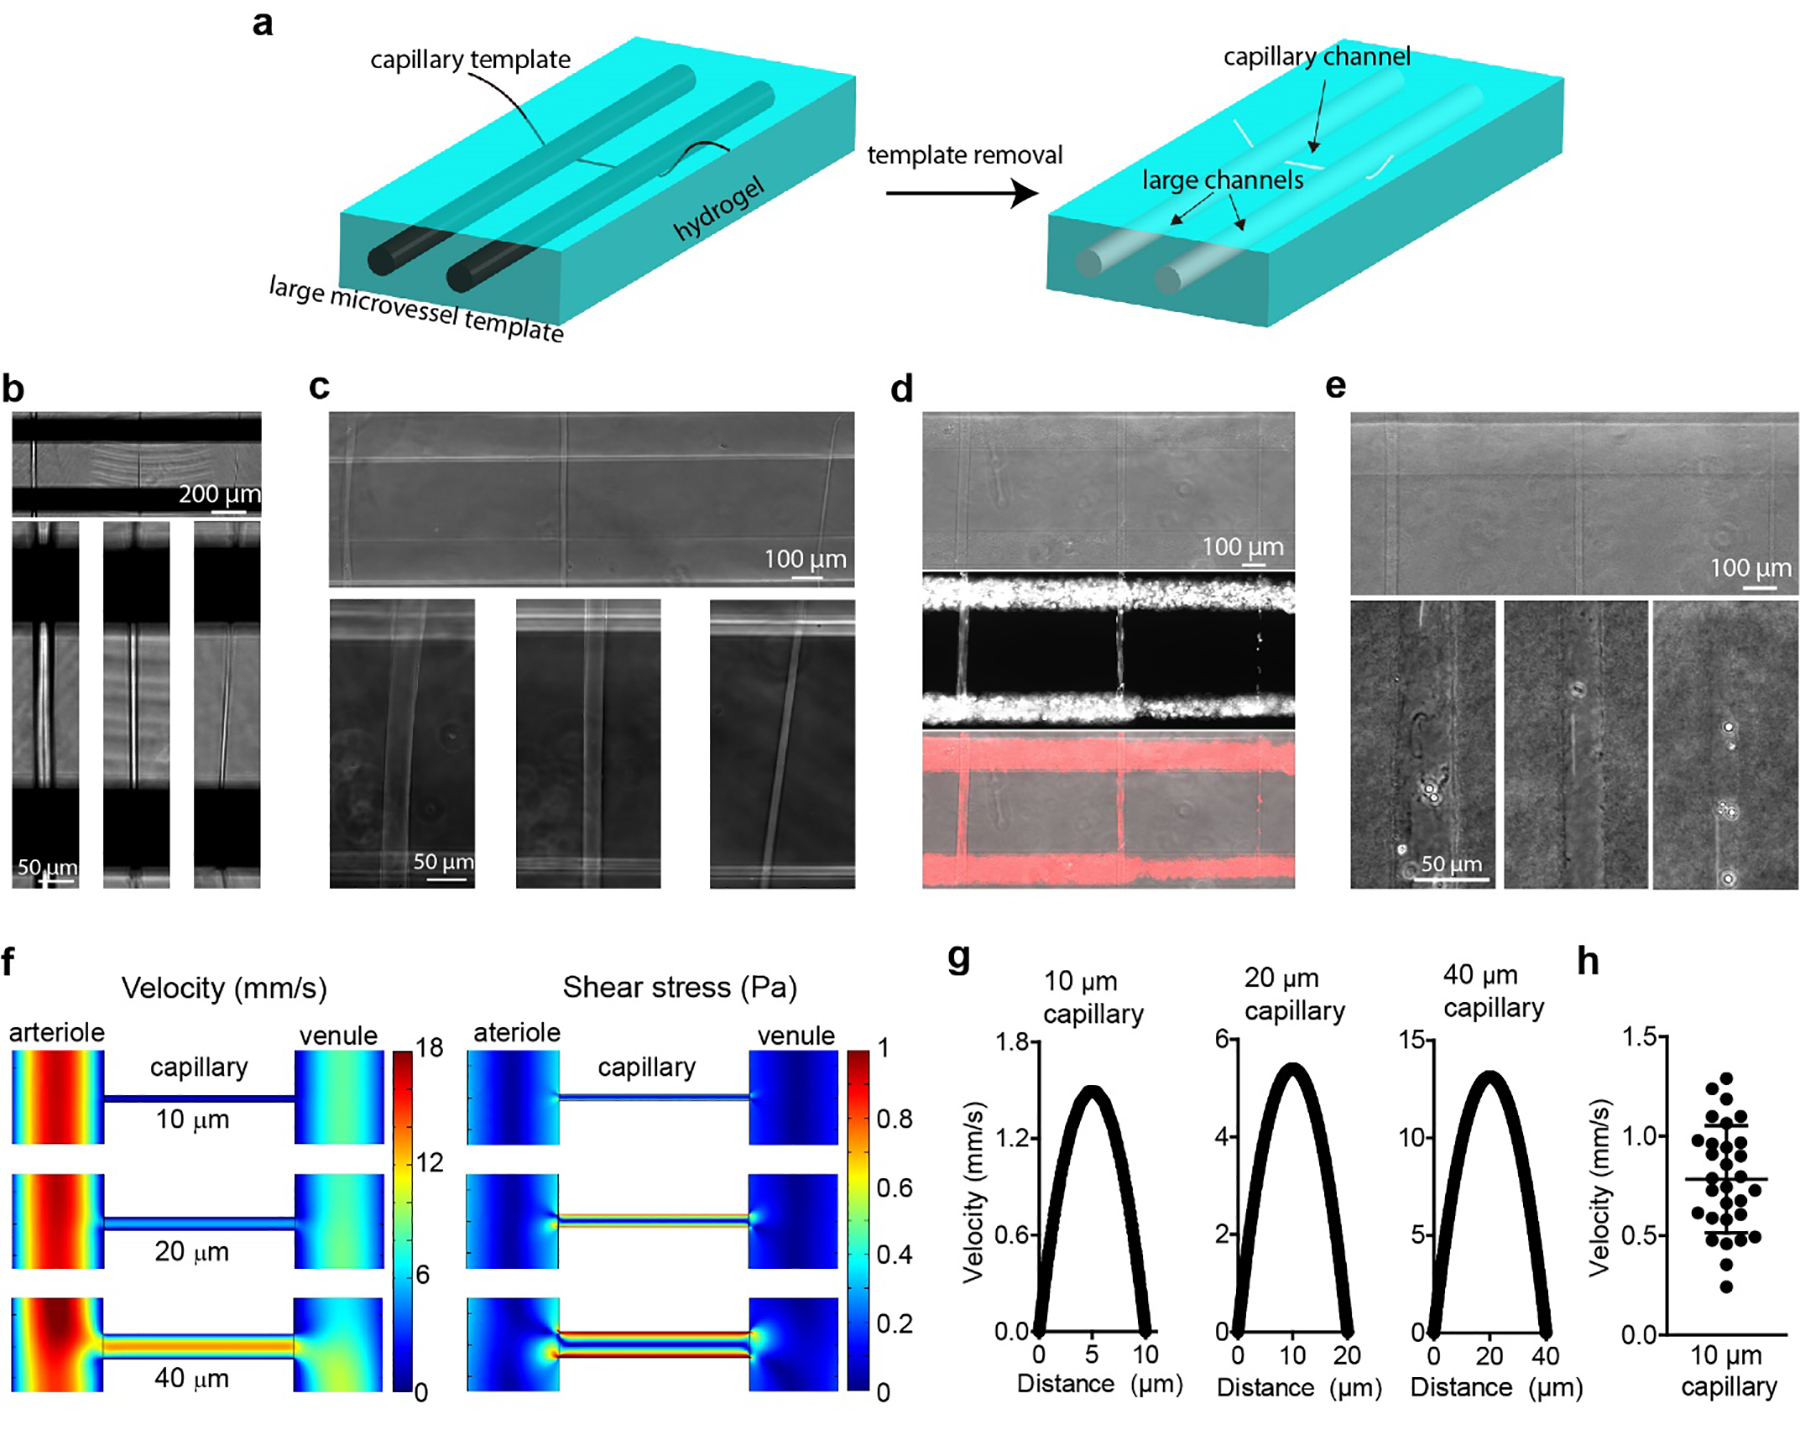
(a) Schematic illustration of the double-templating system using nitinol rods and polymer fibers to fabricate large microvessel channels and capillary-scale channels in a hydrogel matrix. (b) Optical images of three polymer fibers with different diameters underneath the nitinol rods in a microfluidic device. Bottom panels show high magnification images of individual polymer fibers. (c) Capillary channels with different diameters in agarose hydrogel following removal of the polymer fibers. Bottom panels show high-magnification images of individual capillary channels. (d) Perfusion of fluorescent microspheres into capillary channels in an agarose hydrogel. Top panel, optical image; middle panel, Cy3-channel image; bottom panel, merged image. Both large microvessels were perfused with 2 μm fluorescent microspheres labelled with Cy3. (e) Capillary channels in a collagen hydrogel. Bottom panels show the high magnification images of capillary channel perfused with 4 μm polymethacrylate microspheres. (f) COMSOL simulation of flow velocity (left) and shear stress (right) in a capillary channel with different diameters between 150 μm diameter source and sink microvessels. The inflow pressure of the arteriole was 120 Pa and the inflow pressure of the venule was 80 Pa. The pressure of both outflow reservoirs was 0 Pa. (g) Simulated flow velocity profiles for capillary channels with different diameters. (h) Experimental flow velocity profile of 2 μm microspheres in a 10 μm capillary channels (n = 30 microspheres).
To assess the flow patterns in these devices, we performed finite element simulations. The inlet of the source microvessel (arteriole) was set at a pressure of 120 Pa (12 mm H2O) and the inlet of the sink microvessel (venule) was set at 80 Pa (8 mm H2O) (Fig. S2). The pressure of both outflow reservoirs was set at 0 Pa. The pressure difference between the arteriole and venule drives the flow of the medium through the capillary. Since the total cross-sectional area of the capillaries is small, the flow resistance is very high and hence there is flow at the outlet of the source microvessel as well as through the sink microvessel. For the same reason, the sink has an independent inlet to enable continuous perfusion at physiological flow rates. Simulations showed that both flow velocity and shear stress increased with increasing in capillary diameter, from 10 to 40 μm (Fig. 1f and Fig. S2). The wall shear stress in the capillaries ranged from 4.5 to 10.5 dyne cm−2 (Fig. S2), assuming a medium viscosity of 0.9 mPa·s at 37 °C. [18] Under these conditions, the simulations predicted an average flow velocity of ~0.7 mm s−1 in a 10-μm capillary (Fig. 1g), in the range of physiological values [1a, 19]. The simulation results were confirmed from analysis of the flow velocity of fluorescent microspheres in a 10 μm capillary channel following injection into the inlet of the source channel (Fig. 1h).
Although microvessels created by the double-templating method lack the tortuosity seen in native blood vessels, control over the exact diameters and lengths allows precise manipulation of the flow velocity and shear stress in the capillary channels. This is important for modeling biological processes that are dependent on flow conditions. For example, the average flow velocity in rat brain capillaries is around 0.1 – 1 mm s−1 [19], and the wall shear stress in capillaries in rats and cats is estimated to be 10 – 20 dyne cm−2 [20], although the viscosity of blood (~4 mPa·s) is higher than for medium. Our results confirm that we can achieve physiological flow velocity and shear stress in our capillary channels. These conditions can be easily modified by changing the inflow pressures of the source and sink microvessels.
Engineering hierarchical vascular networks with capillaries
After validation of the flow conditions in the capillary channels, we created hierarchical networks at capillary scale with GFP-labeled human umbilical vein endothelial cells (GFP-HUVECs). We first seeded GFP-HUVECs into the source and sink microvessel channels. Following the formation of confluent monolayers of endothelial cells in the source and sink microvessels, we then removed the polymer fibers which allowed the GFP-HUVECs to migrate into the capillary channels, resulting in the formation of confluent capillaries (Fig. 2a). The lead cells from the source microvessel migrated faster into the capillary channels than the lead cells from the sink microvessel, indicating that migration of cells was influenced by the direction of flow (Fig. 2b). During cell migration, lead cells maintained direct contact with the trailing cells and there was no obvious change in cell turnover. This two-step process and the differential pressure conditions were found to be key to capillary formation. Seeding the microvessel and capillary channels at the same time resulted in occlusion of the capillary channel (Fig. S3a). In addition, a lack of flow inside the capillary after seeding resulted in occlusion of the capillary and formation of angiogenic sprouts (Fig. S3b).
Fig. 2. Formation and characterization of hierarchical capillary-scale HUVEC networks.
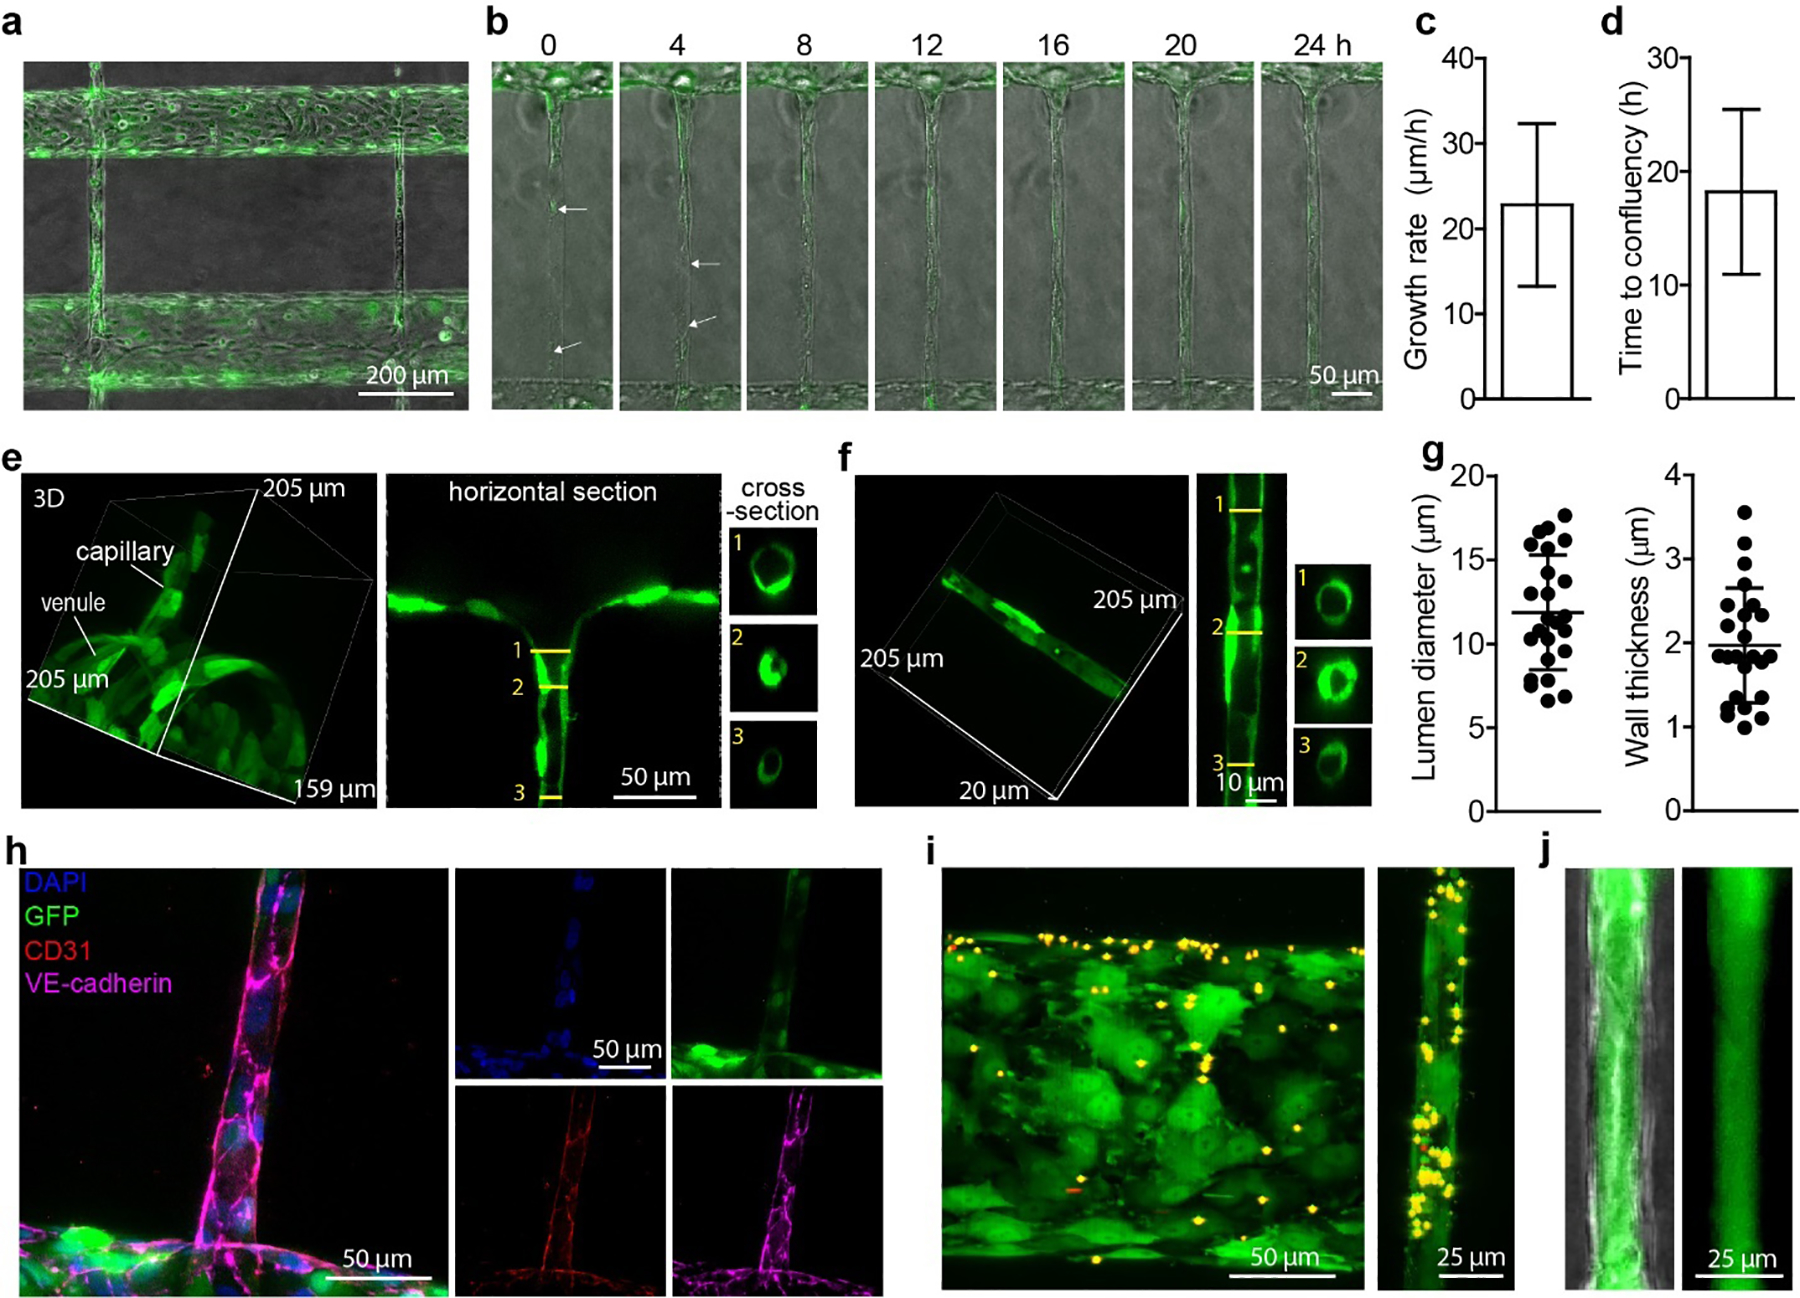
(a) A GFP-HUVEC network with capillary-scale vessels between source and sink microvessels. Cells were seeded into the source and sink microvessel channels and allowed to reach confluence prior to removing the polymer fiber templates and allowing the cells to migrate into the capillary channels. GFP-HUVECs: green fluorescent protein-labeled human umbilical vein endothelial cells. (b) Time-lapse images of GFP-HUVECs migrating into a capillary-scale channel. Arrows indicate the frontmost cells from the source and sink channels. (c) Growth rate of capillaries. (n = 5 devices). (d) Time to confluency inside the capillary channels (n = 5 devices). (e) Confocal images of the transition region between a source microvessel and a capillary. 3D reconstruction (left), top view (middle) and cross-section (right). (f) Confocal images of a GFP-HUVEC capillary. 3D reconstruction (left), horizontal section (middle) and cross-section (right). (g) The inner lumen diameter (left) and wall thickness (right) of capillaries (n = 24 capillaries). (h) Immunostaining of a GFP-HUVEC capillary. (i) Confocal image of a GFP-HUVEC venule (left) and capillary (right) following injection of 2 μm Cy3-labelled microspheres into the source microvessel. (j) Fluorescence image showing that HUVECs form an intact capillary monolayer and retain 500 kDa dextran-FITC inside its lumen.
We next quantified the rate of capillary formation. The average growth rate of GFP-HUVEC capillaries was approximately 23 μm h−1 (Fig. 2c), and fully confluent 400 μm long GFP-HUVECs capillaries were formed in less than 20 hours (Fig. 2d). Therefore, the total time needed for engineering the HUVEC hierarchical structure was less than 2 days. This is much faster than the self-assembly process, which typically requires 7 days or more [3e].
We then used confocal microscopy to examine the lumen structure of the capillaries. Confocal imaging revealed a smooth cellular transition region between the source microvessel and the capillary (Fig. 2e), and a well-defined lumen in the capillaries (Fig. 2f). Using the double templating approach we created capillary-scale structures with lumen diameters of 6 – 17 μm and an average wall thickness of 2 μm (Fig. 2g). We next examined whether the GFP-HUVEC capillaries maintained typical endothelial phenotype (Fig. 2h, S3c). Immunostaining showed that both CD31 and VE-Cadherin localized around the cell-cell junctions. The capillaries were formed with 1 – 2 cells around the perimeter. We have previously shown that HUVEC tend to elongate and align when seeded on glass rods with 1 – 3 cells around the perimeter at capillary scale dimensions [21]. To confirm that the microvessels and capillaries were perfusable, we flowed 2 μm diameter fluorescent microspheres into the source microvessel. After perfusion for 5 minutes, microspheres were observed in the capillary and sink microvessel downstream of the capillary (Fig. 2i). To test whether the endothelial cells formed an intact monolayer, we perfused HUVEC devices with 500 kDa dextran-FITC, which has a hydrodynamic radius of 15.9 nm [22]. The dextran was retained inside the lumen of the capillaries showing that there were no defects larger than the dextran at cell-cell junctions that would result in focal leaks (Fig. 2j). Taken together, these results demonstrate that hierarchical networks with capillaries can be achieved by using this double-templating strategy.
Previous studies have highlighted the difficulties in engineering vascular networks with capillaries [6, 11]. Direct cell seeding into channels smaller than 50 μm in diameter usually results in sparse endothelial coverage or channel occlusion [23]. A recent study using a combination of lithography and photoablation addressed this problem by seeding HUVECs into large microvessel channels and then allowing them to migrate into ablated capillary channels [7]. Formation of confluent capillary-scale vessels was achieved after 4 days, however, the authors pointed out that photoablation caused local endothelial cell damage within the microvessels while creating the capillary channels. Perfusable capillary-scale networks have been formed by self-assembly of iECs, pericytes, and astrocytes [3e, 24], however, the process is not tightly controlled resulting in a range of diameters, from 20 μm to more than 100 μm, within the network, as well as some non-perfusable vessels. Although self-assembly of a hierarchical BBB network using iBMECs, induced pericytes, and induced astrocytes has been reported, the structures were not perfusable [3f].
Engineering a brain capillary model using iBMECs
Having established the feasibility of using the double-templating approach to produce hierarchical structures with HUVECs, we next explored using this approach to engineer brain-specific capillary structures. Although HUVECs express typical endothelial cell markers in vitro, they do not possess barrier function typical of the blood-brain barrier [3a]. Primary BMECs and immortalized BMECs also exhibit low barrier function and unstable BBB phenotypes in vitro [25]. iECs show closer transcriptomic profiles to generic endothelial cells in comparison to iBMECs [26] but result in transendothelial electrical resistance (TEER) values lower than 50 Ω cm2 [27], while iBMECs express typical BBB markers such as tight junction proteins and efflux transporters [14b]. Peak TEER values of iBMECs are typically > 2,000 Ω cm2, which is within the physiological range (1,500 – 8,000 Ω cm2) [3d, 14b, 28]. Although iBMECs do not fully recapitulate native BMEC identity, they express many key BBB markers and recapitulate many aspects of barrier function and hence have advantages over other currently available cell types.
Here we created capillary-scale structures using iBMECs differentiated from two iPSC sources: WTC-RFP-iPSCs and BC1-iPSCs. iECs differentiated from BC1-iPSCs were used for comparison. As an example, RFP-iBMECs were seeded into the source and sink microvessel channels and then allowed to migrate into capillary channels following removal of the polymer fiber (Fig. 3a). After two days, networks with source microvessel, capillary-scale vessels, and sink microvessel were observed. Confocal imaging confirmed formation of vessels with diameter as small as 11 μm (Fig. 3b). Using fibers with diameters of 20 – 40 μm, we formed capillary-scale structures with lumen diameters from 11 to 45 μm (Fig. 3c). The average wall thickness was ~6 μm (Fig. 3d). Capillary-scale vessels were formed in both RFP-iBMECs and BC1-iBMECs by migration of cells from the source and sink channels, as observed with HUVEC capillaries, although the yield for structures with diameter < 30 μm was relatively low (~ 15%). The average growth rate of RFP-iBMEC (7.9 μm h−1, n = 6) and BC1-iBMEC (7.6 μm h−1, n = 3) capillaries was slower than that for HUVEC capillaries (Fig. 3e), likely related to the strong cell-cell junctions and relatively weak cell-matrix adhesion [29]. Immunohistochemistry of sections of BC1-iBMEC capillary-scale vessels revealed expression of typical BMEC markers, such as Glut-1, P-gp, Claudin-5, and ZO-1, in addition to the endothelial cell markers CD31 and VE-cadherin (Fig. 3f). These cross-section images also confirm complete lumen formation. Capillary-scale structures were also formed using iECs (Fig. S4). With ~15 μm diameter polymer fibers, we formed capillaries ~ 20 μm in diameter and with an average wall thickness of ~1.5 μm within 24 hours of removing the polymer fibers. Immunohistochemistry revealed that iEC capillaries expressed very low levels of BBB markers (Fig. S4).
Fig. 3. Tissue-engineered human BBB model with capillary-scale vessels.
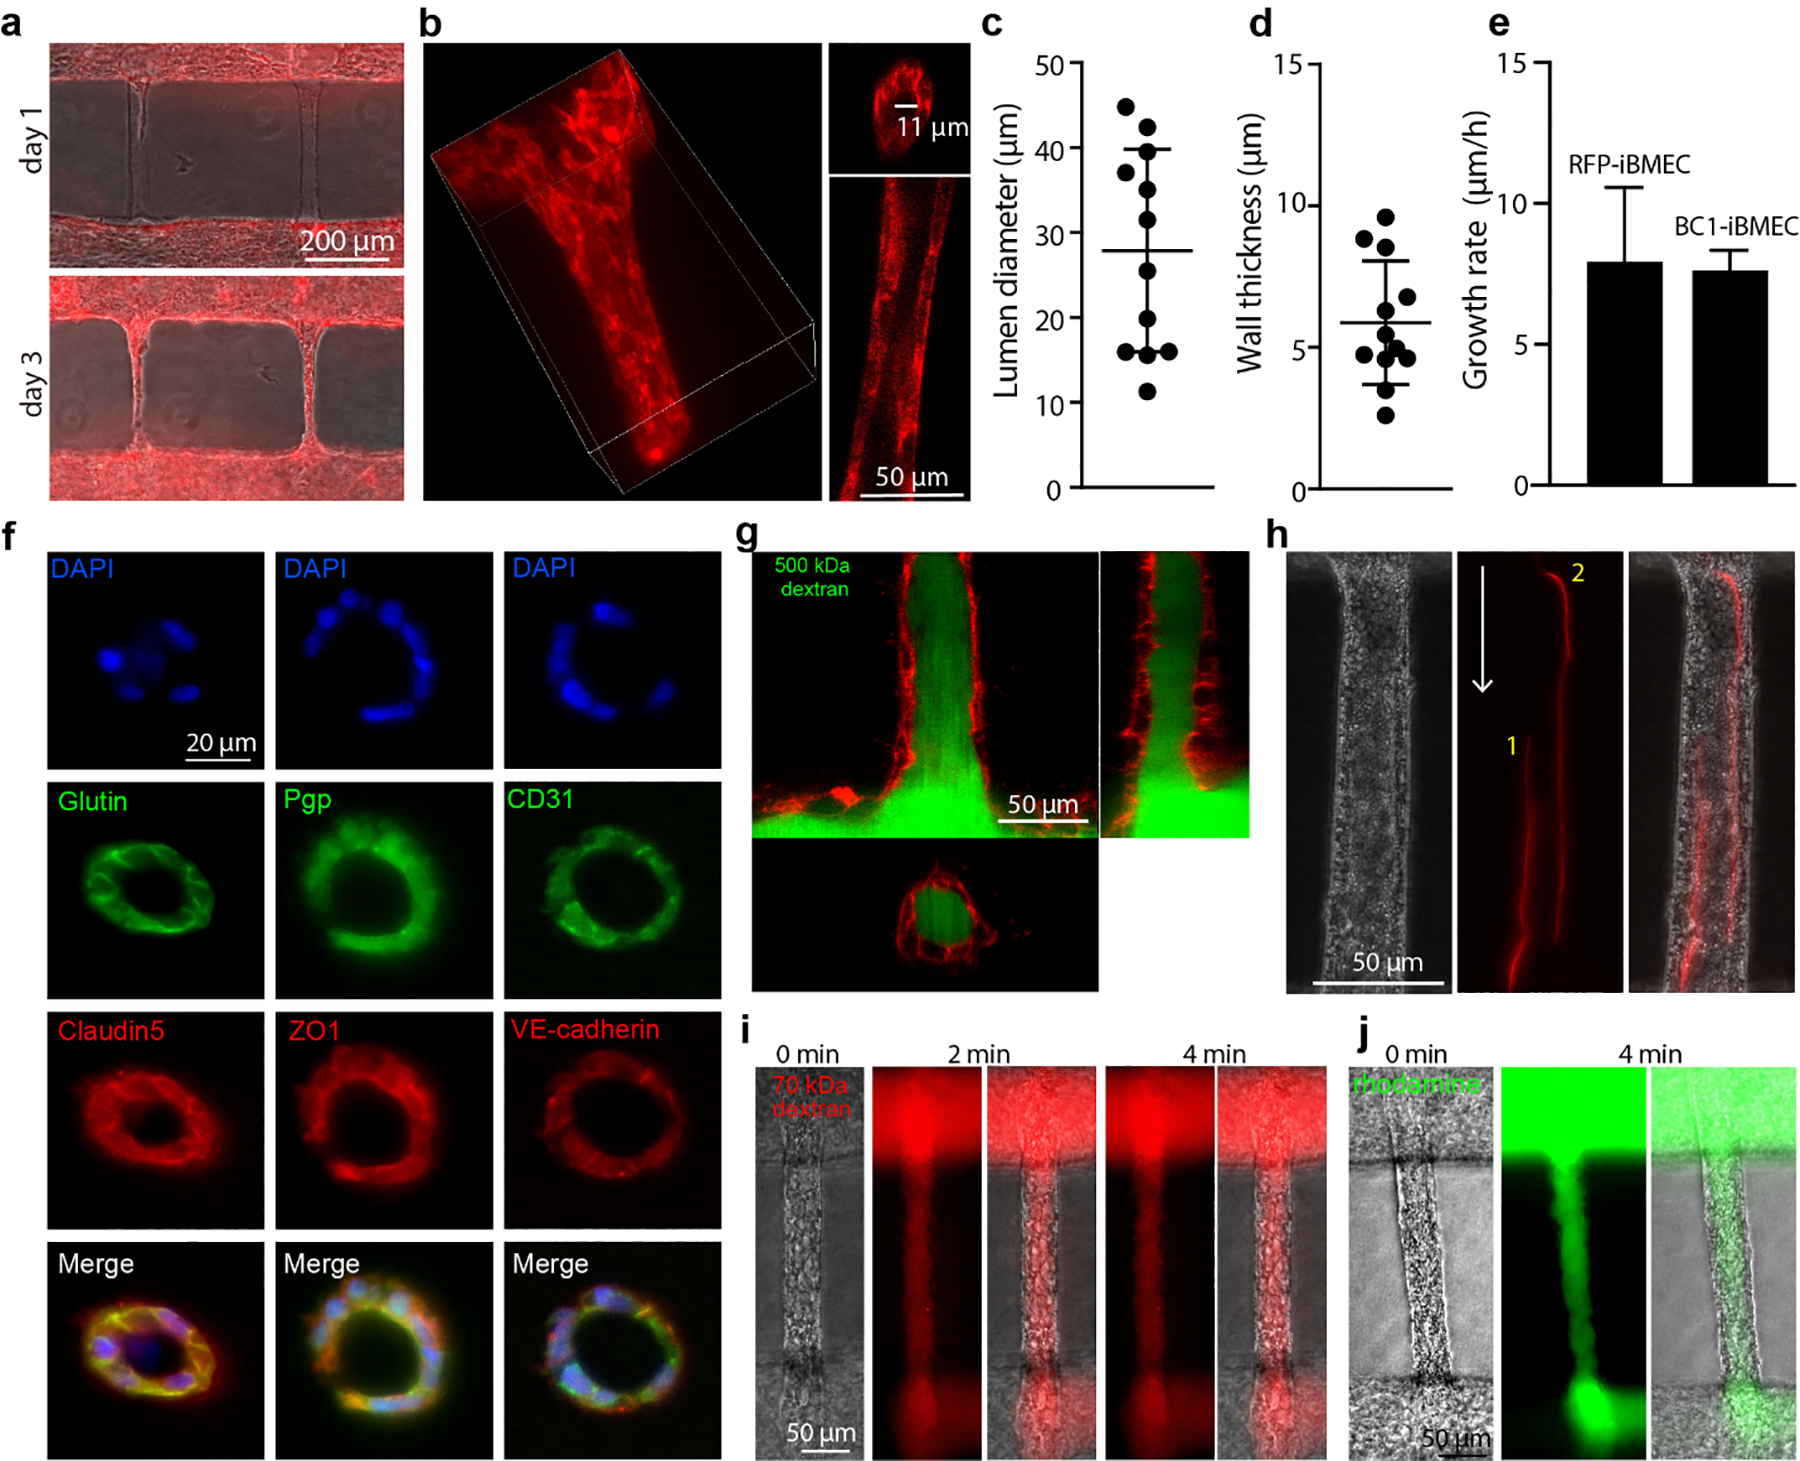
(a) Formation of RFP-iBMEC capillary network. RFP-iBMECs differentiated from WTC-iPSC-RFP labeled with red fluorescent protein (RFP). Merged image of optical channel and RFP channel. (b) Representative confocal images of RFP-iBMEC capillary. 3D reconstruction of RFP-iBMEC capillary (left); cross-section of the capillary (right). (c) The lumen diameter of RFP-iBMEC capillaries (n = 12 capillaries). (d) The wall thickness of RFP-iBMEC capillaries (n = 12 capillaries). (e) Growth rate of iBMEC capillaries (n = 6 capillaries for RFP-iBMECs and n=3 capillaries for BC1-iBMECs). (f) Immunostaining of key brain microvascular endothelial cell (BMEC) markers. BC1-iBMECs capillaries were sectioned into 20 μm slices and stained. BC1-iBMECs, iBMECs differentiated from BC1-iPSCs. (g) Confocal images of 500 kDa dextran-FITC in the RFP-iBMEC capillary. (h) Perfusion of 2 μm fluorescent microspheres into a BC1-iBMEC capillary. The red line shows the flow trail of two microspheres within the capillary. White arrow indicates the direction of flow. Locations 1 and 2 indicate two microspheres. (i) Representative phase/fluorescence images during perfusion of BC1-iBMEC capillaries with 70 kDa dextran-Texas Red (n = 3 capillaries). (j) Representative phase/fluorescence images during perfusion of BC1-iBMEC capillaries with rhodamine 123 (n = 3 capillaries).
Confocal imaging of RFP-iBMEC capillary-scale vessels during perfusion with 500 kDa dextran-FITC revealed a confluent endothelium with no visible defects larger than the dextran (Fig. 3g). Long exposure time images of fluorescently-labeled microspheres revealed the flow lines within the capillaries (Fig. 3h). From analysis of fluorescence images following perfusion of the source microvessel with 70 kDa dextran-Texas Red (Fig. 3i) and rhodamine 123 (MW 381 Da) (Fig. 3j, S5b) we confirmed that solutes with dimensions typical of proteins and small molecular weight solutes were also restricted by the capillary lumen, consistent with previous results in microvessels [3a]. Together, these results show that we are able to engineer BBB networks with high barrier function at the capillary scale.
Leukocyte interactions within a hierarchical BBB model
To demonstrate the ability to use brain-specific capillary-scale structures to study biologically-relevant processes, we modeled THP1 cell interactions within iBMEC capillaries following activation by inflammatory cytokines. THP1s cells are human leukemia monocytic cells that have been extensively used to study processes associated with inflammation [30]. Circulating monocytes do not transmigrate into the healthy central nervous system [31], but they can cross the BBB and infiltrate the brain parenchyma in response to injury, foreign body infections, Alzheimer’s disease, and multiple sclerosis [31–32]. During neuroinflammatory disease (e.g. ischemia, Alzhemier’s disease), pro-inflammatory cytokines such as TNFα released by resident immune cells (e.g. microglia) and other supporting cells (e.g. astrocytes), activate BMECs and promote the adhesion and transmigration of leukocytes [33]. Recent studies in animal models of Alzhemier’s disease and stroke have shown that leukocytes can block capillaries resulting in stalled flow [34]. Here we recapitulated this phenomenon by modeling the local inflammatory response in our hierarchical BBB model.
We first confirmed that the adhesion molecules ICAM1 and VCAM1 were upregulated in 2D confluent monolayers of iECs and iBMECs exposed to TNFα in a dose dependent manner (Fig. S6a). Perfusion of 3D devices with 5 ng mL−1 TNFα confirmed upregulation of ICAM1 and VCAM1 in source microvessels (Fig. S6b, c) and capillaries (Fig. 4a, S6d). TNFα treatment for 24 hours did not significantly increase the permeability of iBMEC and iEC capillaries to 70 kDa dextran (Fig. S5c).
Fig. 4. Modeling leukocyte interactions with brain capillaries.
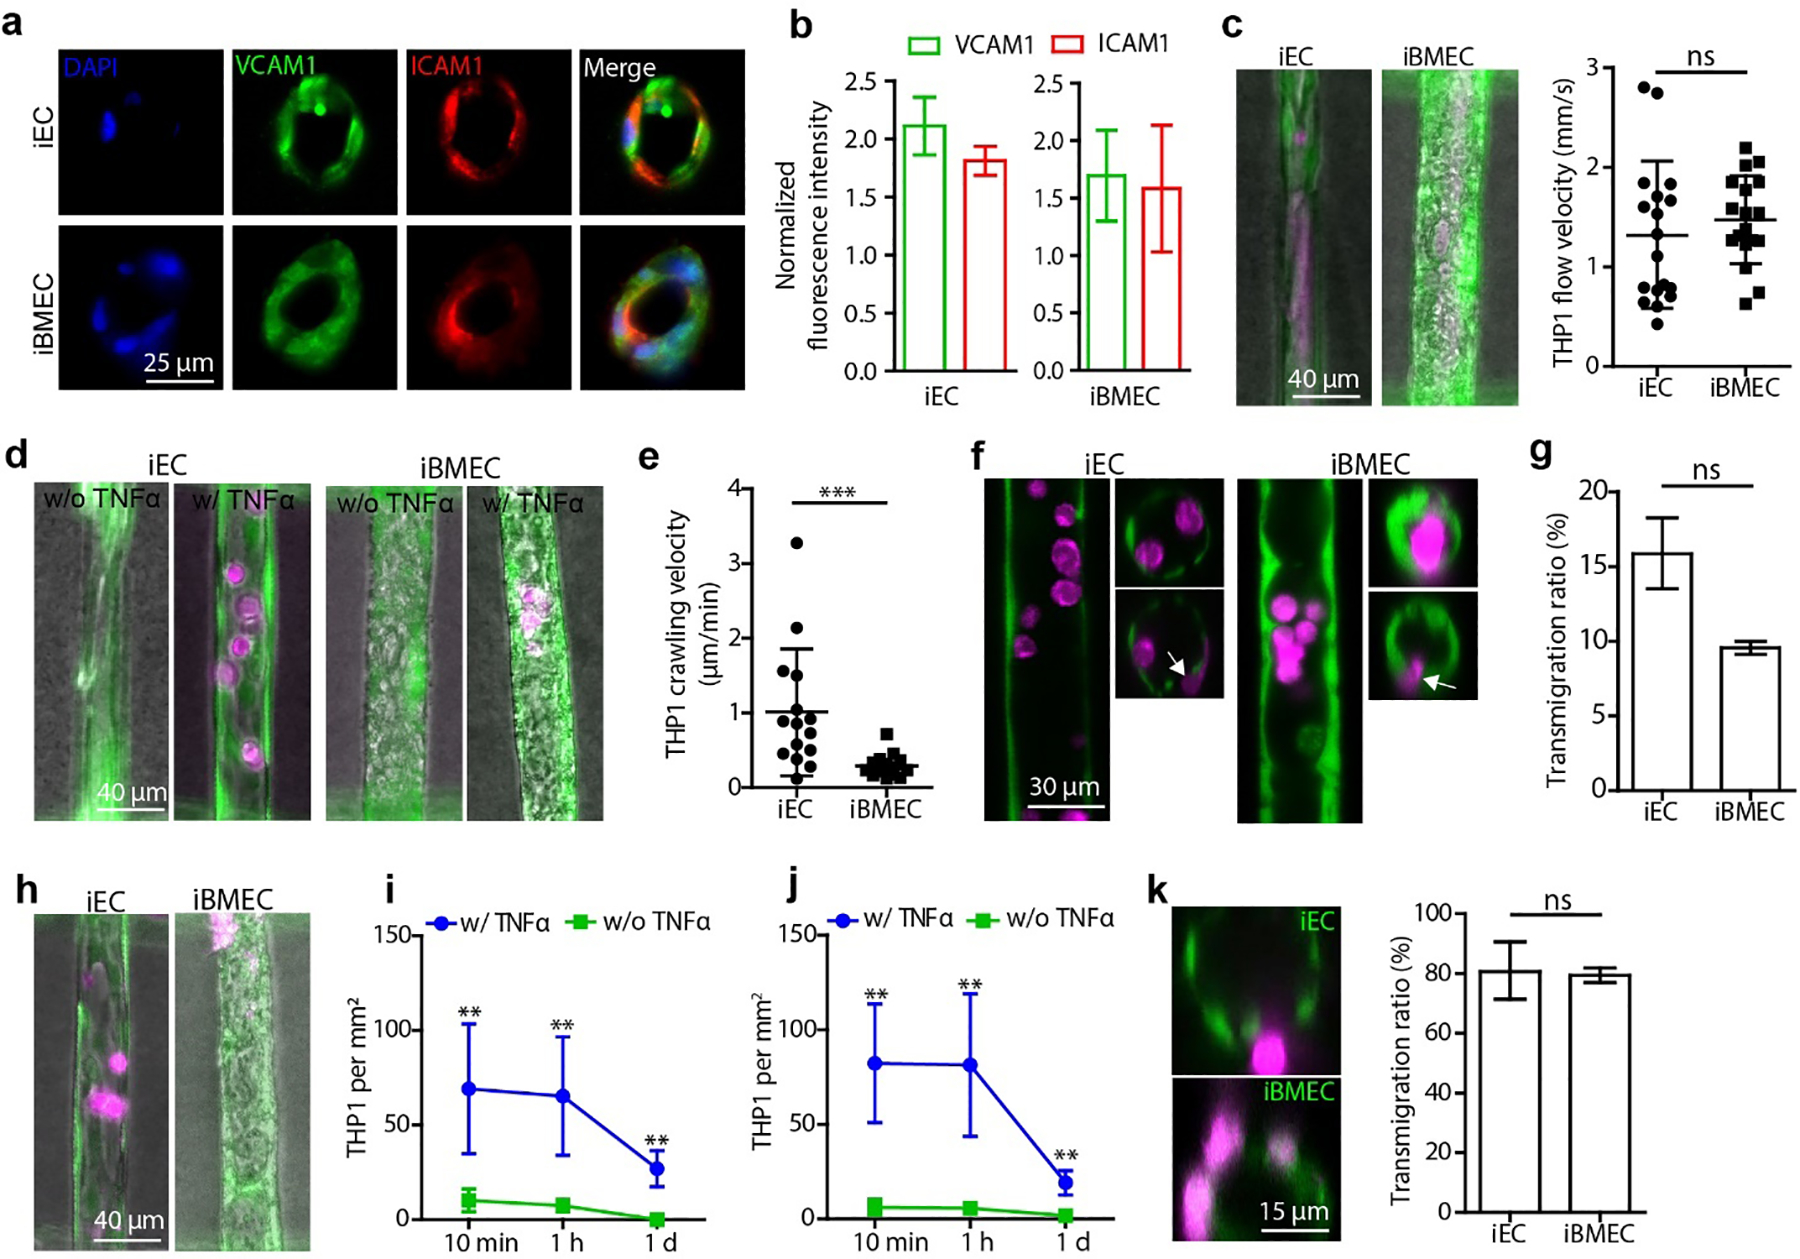
(a) Immunostaining of VCAM1 and ICAM1 in isogenic iEC and iBMEC capillaries following perfusion with 5 ng mL−1 TNFα. See Fig.S6d for control vessels without TNFα treatment. (b) VCAM1 and ICAM1 expression in the endothelium normalized to the fluorescence intensity in the corresponding control group without TNFα treatment (n = 3 devices). (c) THP1 immune cell flow velocity in iEC and iBMEC capillaries (n = 18 leukocytes). iECs and iBMECs were stained with Calcein AM (green), and THP1 cells were stained with Deep Red Cell Tracker (magenta). (d) Fluorescence images of adhered THP1 cells in iEC and iBMEC capillaries after flowing with immune cells for 5 min and perfusion with medium without TNFα (w/o TNFα) or with (w/ TNFα) for one hour. Capillaries were perfused with medium (w/o TNFα) or medium supplemented with 5 ng mL−1 TNFα (w/ TNFα) for 1 day prior to perfusion with THP1 cells. (e) THP1 crawling velocity along capillaries recorded after one-hour perfusion with medium supplemented with TNFα (n = 15 leukocytes). (f) Confocal images of THP1 cells (magenta) in iEC and iBMEC capillaries after activation with TNFα, flowing with immune cells for 5 min and perfusion with medium supplemented with TNFα for one hour. Longitudinal section (left) and cross-section (right). White arrows indicate transmigrating THP1 cells. (g) THP1 transmigration ratio after perfusion with medium supplemented with TNFα for 1 hour (n = 3 devices for each capillary type). The transmigration ratio is the ratio of THP1 cells in capillaries that were undergoing transmigration or had completed transmigration to the total number of adherent THP1 cells. (h) Fluorescence images of adherent THP1 cells in capillaries one day after activation and perfusion with THP1 cells. (i) The density of adherent THP1 cells (per mm2 endothelium) on iEC capillaries after perfusion with medium at different time points (n = 3 devices for each capillary type). (j) The density of adherent THP1 cells on iBMEC capillaries after perfusion with medium at different time points (n = 3 devices for each capillary type). (k) Transmigration of THP1 cells one day after activation and immune cell perfusion for 1 day (n = 3 devices for each capillary type). Statistics: Mann-Whitney test (c, e, g and k); two-way ANOVA (i and j) ns - no significant difference; **, p<0.01; ***, p<0.001.
Having confirmed that perfusion with TNFα resulted in iBMEC activation, we then perfused the source microvessel with THP1 leukocytes for 5 min after 24 hour perfusion with medium or medium supplemented with 5 ng mL−1 TNFα (Video S1 to S4). THP1s were perfused at a concentration of 1 × 10⁶ cells mL−1 which is close to the monocyte concentration human blood (0.95 × 10⁶ cells mL−1) [35]. The flow velocity of the THP1 cells in control capillaries (no activation) was ~1.5 mm s−1 (Fig. 4c), close to values of monocyte velocity observed in the mouse brain (~1 mm s−1) [36]. During the perfusion process, the THP1 cells maintained a spherical shape, indicating a normal and healthy morphology. Following perfusion with THP1 cells for 1 hour, the number of adherent leukocytes in activated iEC and iBMEC capillaries was much higher than in control capillaries (no activation) (Fig. 4d), showing that TNFα activation increases the adhesion of leukocytes in the human BBB capillary model. The shape of THP1 cells changed from a spherical shape to disc shaped after the adhesion, typical of capture and firm adhesion [37].
Following adhesion, we then quantified crawling of THP1 cells along the endothelium. The adherent THP1 cells all migrated against the flow direction in both iBMEC and iEC capillaries. Migration against the flow direction has been reported for T-cells on 2D monolayers of primary mouse BMECs in vitro [37], and in vivo in meningeal vessels in a rat model of auto immune disease [38], and is thought to be related to upregulation of ICAM1 [37]. The average crawling speed of THP1 cells on activated iEC capillaries was ~1 μm min−1, 5-fold faster than on activated iBMEC capillaries (~0.2 μm min−1) (Fig. 4e). Previous studies have reported a leukocyte crawling velocity of ~4 μm min−1 on TNFα-treated 2D primary mouse BMECs under 1.5 dyne cm−2 shear stress [37], around 20-fold faster than observed in iBMEC capillaries here. This difference could result from loss of phenotype of the primary cells [25a, 25b], different shear stresses in the 2D experiment, or differences in leukocytes.
We next examined whether the attached leukocytes were capable of transmigration. Confocal imaging over 1 hour after the 5 minutes perfusion with THP1s showed that most of the adhered THP1 cells remained within the lumen of both iEC and BC1-iBMEC capillary-scale vessels (Fig. 4f). Around 9% of the adherent THP1 cells on iBMEC capillaries had penetrated the endothelium, the first step in transmigration (Fig. 4g). For iEC capillaries, ~16% of adherent THP1 cells started crossing the endothelium.
The overall number of adherent THP1 cells in the TNFα-treated groups decreased from ~81 cells mm−2 at 1 hour to 19 cells mm−2 at 1 day for the iBMEC capillaries, and from ~65 cells mm−2 at 1 hour to ~27 cells mm−2 at 1 day for iEC capillaries (Fig. 4i, j). At all time points, TNFα treated iBMEC and iEC capillary-scale vessels both showed a significantly higher number of adherent THP1 cells than that of the corresponding control group (Fig. 4 j), indicating that TNFα increased the residence time of THP1 cells in capillaries. After one day, THP1 cells were observed in the extracellular matrix indicating that some cells had undergone successful transmigration (Fig. 4k). The fraction of THP1 cells undergoing transmigration or that had completed transmigration reached about 80% of the total number of adherent cells for both iEC and iBMEC capillaries (Fig. 4k).
In some cases, clustering of adherent THP1 cells in TNFα treated vessels resulted in capillary occlusion leading to downstream cell death and cell loss, likely due to oxygen and glucose deprivation (Fig. S7a). In contrast, occlusion of control capillaries (no activation) usually resulted in removal of the occlusion after a few days (Fig. S7b). These observations match recent reports of leukocyte plugging and stalled flow in capillaries in a mouse model of Alzheimer’s disease [34a].
The ability to study processes such as immune cell interactions with endothelial cells in hierarchical vascular networks overcomes limitations associated with traditional 2D methods, which lack the cylindrical geometry, capillary-scale, and shear flow. However, the model reported here does not include supporting cells which play an important role in many processes involving the BBB. Nevertheless, our tissue-engineered BBB model represents a significant advance in the ability to study processes such as leukocyte trafficking in capillaries following neuroinflammation.
Conclusions
We developed a double-templating technique that can be used to generate microvessel channels with diameters from 7 μm to 150 μm in hydrogels. This double-templating approach allows the engineering of vascular networks with capillary-scale structures. In combination with iPSC-derived iBMECs, we showed that the double-templating approach enables the engineering of BBB models with physiological barrier function at capillary scale. Following perfusion with the inflammatory cytokine TNFα, our BBB model recapitulates upregulation of adhesion molecules, leukocyte adhesion and migration against the direction of flow, leukocyte transmigration, and capillary plugging and stalled flow. This BBB model also has the potential to be used for modeling drug delivery and neurodegenerative disease.
Supplementary Material
Acknowledgements
The authors would like to thank Mr. Benjamin Kolda for assistance with COMSOL simulations, Mr. Grant Kitchen, Dr. Dinh-Tuan Phan, and Dr. Yi Lu for help with the design and fabrication of the mold. This work was supported by NIH (NINDS R01NS106008 and NHLBI R61HL154252).
Footnotes
Conflicts of Interest
The authors declare no conflicts of interest.
References
- [1].a) Wong A, Ye M, Levy A, Rothstein J, Bergles D, Searson PC, Frontiers in neuroengineering 2013, 6, 7; [DOI] [PMC free article] [PubMed] [Google Scholar]; b) Abbott NJ, Patabendige AA, Dolman DE, Yusof SR, Begley DJ, Neurobiol Dis 2010, 37, 13; [DOI] [PubMed] [Google Scholar]; c) Ballabh P, Braun A, Nedergaard M, Neurobiology of disease 2004, 16, 1. [DOI] [PubMed] [Google Scholar]
- [2].Sweeney MD, Kisler K, Montagne A, Toga AW, Zlokovic BV, Nature neuroscience 2018, 21, 1318. [DOI] [PMC free article] [PubMed] [Google Scholar]
- [3].a) Linville RM, DeStefano JG, Sklar MB, Xu Z, Farrell AM, Bogorad MI, Chu C, Walczak P, Cheng L, Mahairaki V, Biomaterials 2019, 190, 24; [DOI] [PMC free article] [PubMed] [Google Scholar]; b) Linville RM, DeStefano JG, Sklar MB, Chu CY, Walczak P, Searson PC, J Cerebr Blood F Met 2020, 40, 1517; [DOI] [PMC free article] [PubMed] [Google Scholar]; c) Linville RM, DeStefano JG, Nerenberg RF, Grifno GN, Ye R, Gallagher E, Searson PC, Mol Pharm 2020, 17, 3425; [DOI] [PMC free article] [PubMed] [Google Scholar]; d) DeStefano JG, Jamieson JJ, Linville RM, Searson PC, Fluids and Barriers of the CNS 2018, 15, 32; [DOI] [PMC free article] [PubMed] [Google Scholar]; e) Campisi M, Shin Y, Osaki T, Hajal C, Chiono V, Kamm RD, Biomaterials 2018, 180, 117; [DOI] [PMC free article] [PubMed] [Google Scholar]; f) Blanchard JW, Bula M, Davila-Velderrain J, Akay LA, Zhu L, Frank A, Victor MB, Bonner JM, Mathys H, Lin Y-T, Nature medicine 2020, 26, 952. [DOI] [PMC free article] [PubMed] [Google Scholar]
- [4].a) Lippmann ES, Azarin SM, Kay JE, Nessler RA, Wilson HK, Al-Ahmad A, Palecek SP, Shusta EV, Nature biotechnology 2012, 30, 783; [DOI] [PMC free article] [PubMed] [Google Scholar]; b) Adriani G, Ma D, Pavesi A, Kamm RD, Goh EL, Lab on a Chip 2017, 17, 448. [DOI] [PubMed] [Google Scholar]
- [5].a) Chrobak KM, Potter DR, Tien J, Microvascular research 2006, 71, 185; [DOI] [PubMed] [Google Scholar]; b) Wong AD, Searson PC, Cancer Res 2014, 74, 4937; [DOI] [PMC free article] [PubMed] [Google Scholar]; c) Wong AD, Searson PC, Cancer Res 2017, 77, 6453; [DOI] [PMC free article] [PubMed] [Google Scholar]; d) Wong AD, Russell LM, Katt ME, Searson PC, ACS Biomater. Sci. Eng 2019, 5, 633; [DOI] [PMC free article] [PubMed] [Google Scholar]; e) Bogorad MI, DeStefano J, Karlsson J, Wong AD, Gerecht S, Searson PC, Lab on a Chip 2015, 15, 4242; [DOI] [PMC free article] [PubMed] [Google Scholar]; f) Bogorad MI, Searson PC, Integrative Biology 2016, 8, 976; [DOI] [PMC free article] [PubMed] [Google Scholar]; g) Bogorad MI, DeStefano J, Wong AD, Searson PC, Microcirculation 2017, 24, e12360. [DOI] [PMC free article] [PubMed] [Google Scholar]
- [6].Zheng Y, Chen J, Craven M, Choi NW, Totorica S, Diaz-Santana A, Kermani P, Hempstead B, Fischbach-Teschl C, López JA, Proceedings of the national academy of sciences 2012, 109, 9342. [DOI] [PMC free article] [PubMed] [Google Scholar]
- [7].Arakawa C, Gunnarsson C, Howard C, Bernabeu M, Phong K, Yang E, DeForest CA, Smith JD, Zheng Y, Science advances 2020, 6, eaay7243. [DOI] [PMC free article] [PubMed] [Google Scholar]
- [8].Kolesky DB, Truby RL, Gladman AS, Busbee TA, Homan KA, Lewis JA, Advanced materials 2014, 26, 3124. [DOI] [PubMed] [Google Scholar]
- [9].a) Kim S, Lee H, Chung M, Jeon NL, Lab on a Chip 2013, 13, 1489; [DOI] [PubMed] [Google Scholar]; b) Moya ML, Hsu Y-H, Lee AP, Hughes CC, George SC, Tissue Engineering Part C: Methods 2013, 19, 730. [DOI] [PMC free article] [PubMed] [Google Scholar]
- [10].Golden AP, Tien J, Lab on a Chip 2007, 7, 720. [DOI] [PubMed] [Google Scholar]
- [11].Linville RM, Boland NF, Covarrubias G, Price GM, Tien J, Cellular and molecular bioengineering 2016, 9, 73. [DOI] [PMC free article] [PubMed] [Google Scholar]
- [12].Schöneberg J, De Lorenzi F, Theek B, Blaeser A, Rommel D, Kuehne AJ, Kießling F, Fischer H, Scientific reports 2018, 8, 1. [DOI] [PMC free article] [PubMed] [Google Scholar]
- [13].Kurokawa YK, Yin RT, Shang MR, Shirure VS, Moya ML, George SC, Tissue Engineering Part C: Methods 2017, 23, 474. [DOI] [PMC free article] [PubMed] [Google Scholar]
- [14].a) Katt ME, Xu ZS, Gerecht S, Searson PC, PloS one 2016, 11, e0152105; [DOI] [PMC free article] [PubMed] [Google Scholar]; b) Qian T, Maguire SE, Canfield SG, Bao X, Olson WR, Shusta EV, Palecek SP, Science advances 2017, 3, e1701679. [DOI] [PMC free article] [PubMed] [Google Scholar]
- [15].Wang K, Lin R-Z, Hong X, Ng AH, Lee CN, Neumeyer J, Wang G, Wang X, Ma M, Pu WT, Science advances 2020, 6, eaba7606. [DOI] [PMC free article] [PubMed] [Google Scholar]
- [16].Huxley V, Curry F, Adamson R, American Journal of Physiology-Heart and Circulatory Physiology 1987, 252, H188. [DOI] [PubMed] [Google Scholar]
- [17].Nguyen D-HT, Stapleton SC, Yang MT, Cha SS, Choi CK, Galie PA, Chen CS, Proceedings of the National Academy of Sciences 2013, 110, 6712. [DOI] [PMC free article] [PubMed] [Google Scholar]
- [18].Poon C, J Mech Behav Biomed Mater 2022, 126, 105024. [DOI] [PubMed] [Google Scholar]
- [19].Grutzendler J, Nedergaard M, Trends in neurosciences 2019, 42, 528. [DOI] [PMC free article] [PubMed] [Google Scholar]
- [20].Kamiya A, Bukhari R, Togawa T, Bulletin of mathematical biology 1984, 46, 127. [DOI] [PubMed] [Google Scholar]
- [21].Ye M, Sanchez HM, Hultz M, Yang Z, Bogorad M, Wong AD, Searson PC, Scientific reports 2014, 4, 1. [DOI] [PMC free article] [PubMed] [Google Scholar]
- [22].Armstrong JK, Wenby RB, Meiselman HJ, Fisher TC, Biophysical journal 2004, 87, 4259. [DOI] [PMC free article] [PubMed] [Google Scholar]
- [23].Jamieson JJ, Searson PC, Gerecht S, Journal of biological engineering 2017, 11, 1. [DOI] [PMC free article] [PubMed] [Google Scholar]
- [24].Hajal C, Shin Y, Li L, Serrano JC, Jacks T, Kamm RD, Science Advances 2021, 7, eabg8139. [DOI] [PMC free article] [PubMed] [Google Scholar]
- [25].a) Daneman R, Zhou L, Kebede AA, Barres BA, Nature 2010, 468, 562; [DOI] [PMC free article] [PubMed] [Google Scholar]; b) Sabbagh MF, Nathans J, Elife 2020, 9, e51276; [DOI] [PMC free article] [PubMed] [Google Scholar]; c) Eigenmann DE, Xue G, Kim KS, Moses AV, Hamburger M, Oufir M, Fluids and Barriers of the CNS 2013, 10, 1. [DOI] [PMC free article] [PubMed] [Google Scholar]
- [26].Lu TM, Houghton S, Magdeldin T, Durán JGB, Minotti AP, Snead A, Sproul A, Nguyen D-HT, Xiang J, Fine HA, Proceedings of the National Academy of Sciences 2021, 118. [DOI] [PMC free article] [PubMed] [Google Scholar]
- [27].a) Roudnicky F, Zhang JD, Kim BK, Pandya NJ, Lan Y, Sach-Peltason L, Ragelle H, Strassburger P, Gruener S, Lazendic M, Proceedings of the National Academy of Sciences 2020, 117, 19854; [DOI] [PMC free article] [PubMed] [Google Scholar]; b) Roudnicky F, Kim BK, Lan Y, Schmucki R, Küppers V, Christensen K, Graf M, Patsch C, Burcin M, Meyer CA, Scientific reports 2020, 10, 1. [DOI] [PMC free article] [PubMed] [Google Scholar]
- [28].Grifno GN, Farrell AM, Linville RM, Arevalo D, Kim JH, Gu L, Searson PC, Scientific reports 2019, 9, 1. [DOI] [PMC free article] [PubMed] [Google Scholar]
- [29].DeStefano JG, Xu ZS, Williams AJ, Yimam N, Searson PC, Fluids and Barriers of the CNS 2017, 14, 1. [DOI] [PMC free article] [PubMed] [Google Scholar]
- [30].Chanput W, Mes JJ, Wichers HJ, International immunopharmacology 2014, 23, 37. [DOI] [PubMed] [Google Scholar]
- [31].Varvel NH, Neher JJ, Bosch A, Wang W, Ransohoff RM, Miller RJ, Dingledine R, Proceedings of the National Academy of Sciences 2016, 113, E5665. [DOI] [PMC free article] [PubMed] [Google Scholar]
- [32].a) Giri R, Shen Y, Stins M, Du Yan S, Schmidt AM, Stern D, Kim K-S, Zlokovic B, Kalra VK, American Journal of Physiology-Cell Physiology 2000, 279, C1772; [DOI] [PubMed] [Google Scholar]; b) Persidsky Y, Stins M, Way D, Witte MH, Weinand M, Kim KS, Bock P, Gendelman HE, Fiala M, The Journal of Immunology 1997, 158, 3499. [PubMed] [Google Scholar]
- [33].Ley K, Laudanna C, Cybulsky MI, Nourshargh S, Nature Reviews Immunology 2007, 7, 678. [DOI] [PubMed] [Google Scholar]
- [34].a) Hernandez JCC, Bracko O, Kersbergen CJ, Muse V, Haft-Javaherian M, Berg M, Park L, Vinarcsik LK, Ivasyk I, Rivera DA, Nature neuroscience 2019, 22, 413; [DOI] [PMC free article] [PubMed] [Google Scholar]; b) Rolfes L, Riek-Burchardt M, Pawlitzki M, Minnerup J, Bock S, Schmidt M, Meuth SG, Gunzer M, Neumann J, Brain, Behavior, and Immunity 2021, 93, 322. [DOI] [PubMed] [Google Scholar]
- [35].Scott MK, Quinn K, Li Q, Carroll R, Warsinske H, Vallania F, Chen S, Carns MA, Aren K, Sun J, The Lancet Respiratory Medicine 2019, 7, 497. [DOI] [PMC free article] [PubMed] [Google Scholar]
- [36].Schneider CA, Velez DXF, Azevedo R, Hoover EM, Tran CJ, Lo C, Vadpey O, Gandhi SP, Lodoen MB, Proceedings of the National Academy of Sciences 2019, 116, 24796. [DOI] [PMC free article] [PubMed] [Google Scholar]
- [37].Steiner O, Coisne C, Cecchelli R, Boscacci R, Deutsch U, Engelhardt B, Lyck R, The Journal of Immunology 2010, 185, 4846. [DOI] [PubMed] [Google Scholar]
- [38].Bartholomaus I, Kawakami N, Odoardi F, Schlager C, Miljkovic D, Ellwart JW, Klinkert WE, Flugel-Koch C, Issekutz TB, Wekerle H, Flugel A, Nature 2009, 462, 94. [DOI] [PubMed] [Google Scholar]
Associated Data
This section collects any data citations, data availability statements, or supplementary materials included in this article.