

Abstract
Abiogenic metals Pb and Hg are highly toxic since chronic and/or acute exposure often leads to severe neuropathologies. Mn2+ is an essential metal ion but in excess can impair neuronal function. In this study, we address in vitro the interactions between neuronal calcium sensor 1 (NCS1) and divalent cations. Results showed that non-physiological ions (Pb2+ and Mn2+) bind to EF-hands in NCS1 with nanomolar affinity and lower equilibrium dissociation constant than the physiological Ca2+ ion. (Kd, Pb2+ = 7.0 ± 1.0 nM; Kd, Mn2+ = 34.0 ± 6.0 nM; K). Native ultra-high resolution mass spectrometry (FT-ICR MS) and trapped ion mobility spectrometry—mass spectrometry (nESI-TIMS-MS) studies provided the NCS1-metal complex compositions—up to four Ca2+ or Mn2+ ions and three Pb2+ ions (M⋅Pb1-3Ca1-3, M⋅Mn1-4Ca1-2, and M⋅Ca1-4) were observed in complex—and similarity across the mobility profiles suggests that the overall native structure is preserved regardless of the number and type of cations. However, the non-physiological metal ions (Pb2+, Mn2+, and Hg2+) binding to NCS1 leads to more efficient quenching of Trp emission and a decrease in W30 and W103 solvent exposure compared to the apo and Ca2+ bound form, although the secondary structural rearrangement and exposure of hydrophobic sites are analogous to those for Ca2+ bound protein. Only Pb2+ and Hg2+ binding to EF-hands leads to the NCS1 dimerization whereas Mn2+ bound NCS1 remains in the monomeric form, suggesting that other factors in addition to metal ion coordination, are required for protein dimerization.
Keywords: neuronal calcium sensor 1, calcium, non-physiological metals, EF-hands, metal binding, fluorescence
Graphical Abstract
Graphical Abstract.

Association of Pb2+ and Hg2+ to EF hands stabilizes a NCS1 dimer whereas Mn2+ bound NCS1 favors a monomeric form.
Abbreviation
- neuronal calcium sensor 1
(NCS1)
- 1-anilinonaphthalene-8-sulfonic acid
(1,8- ANS)
- equilibrium dissociation constant
(Kd)
Introduction
Calcium ion (Ca2+) is considered to be a universal second messenger ion as a change in its intracellular concentration regulates a wide variety of biological processes ranging from muscle contraction,1 to neuronal signaling,2 fertilization at the beginning of the life cycle, cell cycle progression, to cell division.3,4. The majority of Ca2+ sensor proteins contain Ca2+ binding sites, so called EF-hands that bind Ca2+ with high specificity and affinity. Ca2+ association to the EF hands triggers a conformation transition and ultimately modulates affinity of Ca2+ sensors for downstream effector proteins.5 EF-hands were shown to bind abiogenic ions such as Pb2+ and Cd2+ and biogenic Mn2+ with nano to micro molar affinity and association of these metals often promotes structural changes that are analogous to those triggered by Ca2+.6–8 Here, we focused on three metal ions (Pb2+, Mn2+, and Hg2+) as potential electron acceptors for neuronal calcium sensor 1 (NCS1). Pb2+ and Hg2+ have ionic radii of 1.20 Å and 1.02 Å, and a charge to radius ratio of 1.68 eÅ–1 and 1.96 eÅ–1, respectively,8 that are comparable to the physical properties of Ca2+ ion; ionic radius and charge to radius ratio of 0.99 Å and 2.02 eÅ–1, respectively.9 Although Mn2+ has the smaller ionic radius and the larger charge to radius ratio (0.66 Å and 2.98 eÅ–1, respectively) compared to the Ca2+ ion, this cation exhibits similar preferences towards the negatively charged amino acid residues and a coordination geometry analogous to that seen with Ca2+ and Mg2+ 8 and thus can potentially interact with EF-hands in neuronal calcium sensors (NCS).
NCS1 is a 200 amino acid residue protein (i.e. the most ancient member of the NCS protein family) and has orthologues ranging from Saccharomyces cerevisiae to humans.10 In the human genome NCS1 and other NCS family members are encoded by 14 genes.11,12 NCS1 contains four EF-hands. A non-functional EF-1 and Mg2+/Ca2+ binding EF-2 are in the N-terminal domain whereas the C-terminal domain carries Ca2+ binding EF-3 and EF-4 (Fig. 1).13,14 The 12-residue canonical EF-hand loops bind Ca2+ ions through oxygen atoms in the sidechain carboxyl group or carbonyl group of the residues located in the position 1, 3, 5, 7, and 9. The sixth coordinating residue, Glu, is located in the exiting helix and serves as a bidentate ligand (Fig. 1).13,15
Fig. 1.

Left: Cartoon presentation of the NCS1 structure (PDB entry 2LCP). Non-functional EF-hand 1 is colored in green, Mg2+/Ca2+ binding EF-hand 2 is shown in red, and Ca2+ binding EF-hand 3 and 4 are shown in yellow and cyan, respectively. Ca2+ ions are shown as green spheres and the sidechains of W30 and W103 are colored in green and yellow, respectively. Right top: Sequence alignment for NCS1 EF-hand 2, 3, and 4. Positions of amino acid residues that coordinate Ca2+ ions are labeled using arrows. Right bottom: Structure of Ca2+ bound EF-hand 4 in NCS1 with the Ca2+ coordinating residues shown as sticks (PDB entry 2LCP).
NCS1 structure shows 2 × 2 structural arrangements of four EF-hands and a hinge loop that connects the N-terminal EF-2 with the C-terminal EF-3.16 Ca2+ binding to NCS1 causes a positional shift in the C-terminal EF-hands leading to exposure of the hydrophobic crevice on protein surface, modulating affinity for target molecules.13,17 The pairing of the EF-hands plays a significant role in modulating Ca2+ binding affinity and a subtle change in Ca2+ concentration can be detected15,18 which points to the evolution of NCS1 as a Ca2+ sensor protein rather than merely as a Ca2+ buffer.19 The NCS1 sequence contain two Trp residues that can serve as intrinsic fluorescence probes for metal binding as their emission quantum yield is modulated by Ca2+ association to the EF-hands.20 W103 is located in the entrance helix of EF-3 and its indole ring is partially shielded from solvent as it is positioned between the N- and C-terminal domain (Fig. 1). This residue is highly conserved among NCS proteins, pointing towards its potential structural and/or functional role. The second Trp residue, W30 is located in the entering helix of EF hand 1 and its sidechain is solvent exposed.
NCS1 regulates a wide number of cellular functions including exocytosis,21 neurite outgrowth,22 neuroprotection,23 axonal regeneration,24 and nuclear regulation.25 Several NCS1 intracellular partners have been identified including ADP-ribosylation factor 1,26,27 α1 subunit of voltage-gated Ca2+ channel 2.1,28,29 dopamine D2 receptor,30–32 and inositol-1,4,5-triphosphate receptor (InsP3R).33–35 NCS1 also interacts with interleukin receptor accessory protein like-1 (IL1RAPL1), particularly found in the hippocampus, and this interaction may mediate the downregulation of N-type calcium channels.36–38 NCS1 has been implicated in several neuro-pathologies and non-neurological diseases such as aggressive form of breast cancer.39 A point mutation in NCS1 sequence, R102Q, has been found in patients with autism and associated with structural deficit in this protein.40 NCS1 has also been linked to schizophrenia, bipolar disorder, and Parkinson's disease.41,42 Recently NCS1 was also implicated in the susceptibility to cocaine addiction and the effectiveness of nicotine replacement therapy through the interaction with dopamine D2 receptor.43–45
Recent studies from our group have shown that another member of the NCS1 family downstream regulatory element antagonist modulator (DREAM) can bind divalent metals Pb2+ and Cd2+ with an affinity superior to that for Ca2+.6,7 Considering a high sequence and structural similarity between NCS1 and DREAM; here, we address the potential role of NCS1 as a target protein for non-physiological metals Pb2+, Hg2+ , and Mn2+. Importantly, NCS1 was implicated in physiological and pathological processes that were associated with Mn2+ and Pb2+ neurotoxicity such as learning difficulties, decrease in IQ, and cognitive deficiencies,46,47 suggesting that non-physiological metals interactions with NCS1 may represent a molecular mechanism of acute and chronic Pb2+, Mn2+, and Hg2+ poisoning.
Material and methods
Isolation and purification of NCS1 protein.
The human NCS1, variant 1, expression vector was purchased from GeneCopoeia (product number EX-V0686-B31) and the gene sequence is provided in the Supplementary information (Table S1). Expression of recombinant NCS1 with a C-terminally attached His-tag was accomplished in BL21 (DE3) Escherichia coli (E. coli) competent cells. The recombinant protein was purified following the published protocol with minor modifications.48 Briefly, the NCS1 expression vector was transformed into BL21 (DE3) E. coli competent cells and cells were grown in Terrific Broth medium at 37°C in the presence of 100 μg mL–1 ampicillin until reaching an optical density of 0.6 at 600 nm. The recombinant protein expression was induced by addition of 0.5 mM IPTG to the cell culture and the cells were incubated with shaking (250 rpm) for an additional 12 h at room temperature and then harvested through 20 min centrifugation at 5000 rpm. The cell pellets were resuspended in Lysis buffer (100 mM Tris buffer, pH 8.0, 0.5 M NaCl, 1 mM CaCl2, 5 mM MgCl2, 5 mM imidazole, 1.0% Triton-X100, 0.5% Tween 20, and 10% glycerol), supplemented with 20 μg ml–1 DNase and 200 μg ml–1 lysozyme, and sonicated on an ice bath for 30 min at 50% duty cycle. The supernatant obtained upon centrifugation of the cell lysate at 5000 rpm for 5 h was loaded to a Ni-NTA column equilibrated with buffer A (20 mM Tris-HCl, pH 7.40, 300 mM NaCl, 0.5 mM CaCl2) and the column was washed extensively with buffer A containing increasing concentration of imidazole (5 to 25 mM). Protein was eluted upon passing buffer A with 30 mM imidazole through the column. Isolated protein was then dialyzed twice against 20 mM Tris, pH 7.40 for 12 h and stored in same buffer. The protein purity was assessed using SDS-PAGE electrophoresis.
Sample Preparation. All protein samples were prepared in 20 mM Tris, pH 7.40 and the concentrations were determined by single beam UV-vis spectrophotometer (Cary 50, Varian) using ε280nm = 22 000 M–1cm–1.49 The 1-anilinonaphthalene-8-sulfonic acid (1,8-ANS) concentration was determined using ε350nm = 4999 M–1cm–1.50 For native MS and TIMS-MS measurements, 50 μM protein was dialyzed against 50 mM ammonium acetate buffer (pH 6.9) overnight and appropriate salt (20 μM CaCO3, 100 μM Pb (AcO)2, or 300 μM MnCO3) was added to the protein sample before MS analysis. All solvents for MS analysis were HPLC grade from Thermo Fisher Scientific Inc. (Waltham, MA).
Steady State Fluorescence Emission. Steady state emission spectra were measured at room temperature (20°C) using a 0.2 × 1 cm path length quartz cuvette by a custom ChronosFD spectrofluorimeter (ISS, Champaign IL). Protein samples were excited along 0.2 cm path length and emitted light was detected through a 1.0 cm path length. For Trp emission measurements, samples were excited at 295 nm while 350 nm excitation was used to characterize the emission of the 1,8-ANS: NCS1 complex. To determine the equilibrium dissociation constants for Pb2+, Mn2+, or Hg2+ binding to NCS1, small aliquots of metal ion stocks (6 mM Pb (AcO)2, 100 mM Mn CO3, 50 mM HgCl2 dissolved in 20 mM Tris, pH 7.40) were titrated into 10 μM NCS1 protein samples in the presence/absence of 1 mM Ca2+, 20 mM Tris buffer, pH 7.40. Due to the precipitation of NCS1 samples at increased Pb2+ concentration, the maximum concentration of Pb2+ used in titration studies was 160 μM. To prepare apoNCS1 samples, freshly prepared protein was dialyzed against 20 mM Tris, 200 μM EDTA, pH = 7.40 for 12 h. NCS1 protein sample was further dialyzed for 12 h against 20 mM Tris buffer, pH 7.40 for two cycles. The fraction of Pb2+, Mn2+, and Hg2+ bound protein in the absence or presence of Ca2+ (fb) was determined from the decrease in fluorescence emission intensity at 330 nm or 335 nm, using Equation 1.
 |
(1) |
where Ii is the fluorescence emission intensity at various metal ions concentrations; I0 is the intensity in the absence of metal; and Imax is the emission intensity of the saturated solution of metal bound NCS1.
The equilibrium dissociation constants for Pb2+ and Mn2+ binding to NCS1 were determined using a quadratic equation (Equation 2).51
 |
(2) |
where Pt is the total protein concentration, Lt is the total ligand concentration, and n denotes the number of binding sites. In case of Ca2+ displacement measurements, Kd in Equation 2 represents apparent dissociation constant, Kapp, for Pb2+ or Mn2+ binding to Ca2+NCS1 or Pb2+, Mn2+, or Hg2+ binding to 1,8-ANS: Ca2+NCS1. The titration curve for Hg2+ association to apo and Ca2+NCS1 were analysed using Equation 3.
 |
(3) |
where Kd indicates the apparent dissociation constant, and c1 and c2 are the scaling factors.
The Kapp and Kd values and associated errors reported in Table 1 were obtained as the mean values and standard deviations, respectively, from three independent measurements. Based on the apparent dissociation constant for metals binding to Ca2+NCS1, the dissociation constants for metal binding to apoNCS1 (Kd) was calculated using Equation 4.52
 |
(4) |
where Kd, Ca2+ is the equilibrium dissociation constant for Ca2+ binding to apoNCS1, which was found to be 96±48 nM 53 and [Ca2+]T is the total calcium concentration, which is 1 mM.
As the emission intensity of 1,8-ANS: NCS1 complexes increases considerably in the presence of metals, we used the change in 1,8-ANS: NCS1 emission to determine equilibrium dissociation constant for metal binding to NCS1. In those measurements, small aliquots of metal stocks were added to 1,8-ANS: NCS1 complex (20 μM NCS1, 40 μM 1,8-ANS, 20 mM Tris buffer, pH 7.40), and the emission spectra were collected. The increase in emission intensity at the emission maximum of 466 nm was used to calculate the fraction of metal bound to 1,8-ANS: protein complex by Equation 1, and data were fitted to Equation 2 or Hill equation (Equation 5) to determine the dissociation constant for metal binding to 1,8-ANS: Ca2+ NCS1 complexes.
 |
(5) |
Circular Dichroism. Far-UV circular dichroism spectra of 10 μM NCS1 in 20 mM Tris buffer, pH 7.40 in presence of 1 mM EDTA, 1 mM Ca2+, or 120 μM Pb2+/1 mM Mn2+/1 mM Hg2+ were recorded using a quartz cuvette (1 mm × 10 mm) by J-810 Jasco CD spectrometer and data were collected through a 1 mm path from 200 to 250 nm at room temperature (20°C).
Quenching Study. Trp quenching studies of apo, and metal bound NCS1 were performed with acrylamide, a polar organic compound that is frequently used in Trp quenching studies. Steady state emission spectra of intrinsic Trp residues were detected from 300 nm to 450 nm using the excitation wavelength of 295 nm. NCS1 protein was titrated with the freshly prepared acrylamide solution in the presence or absence of metals. Data were analysed using the Stern–Volmer equation:
 |
(6) |
where I0 and I denote the emission intensity in absence and presence of the quencher acrylamide, respectively, KSV is the Stern–Volmer quenching constant, and [Q] stands for quencher concentration.
Frequency Domain Lifetime and Time Resolved Anisotropy. Frequency domain lifetime and time resolved anisotropy measurements were carried out for both intrinsic Trp and 1,8-ANS: NCS1 complexes. Samples for fluorescence lifetime and time resolved anisotropy study contained 10 μM NCS1, 20 mM Tris buffer, pH 7.40, 1 mM EDTA, 1 mM Ca2+, and/or 120 μM Pb2+, 1 mM Mn2+ or 1 mM Hg2+. 40 μM 1,8-ANS was added to samples for time resolved measurements of 1,8-ANS: NCS1 complex. The measurements were carried out at room temperature (20°C) using ChronosFD spectrofluorometer (ISS, Champaign IL). For Trp study, apo and metal bound NCS1 samples were excited using a 280 nm laser diode and the emissions were collected through 305 nm long pass filter. A 300 nm laser diode was used for 1,8-ANS: NCS1 complex excitation and emission was collected through 400 nm long pass and 600 nm short pass filter. 1,4-bis(5-phenyloxazol-2-yl) benzene (POPOP) in ethanol was used as a reference in time resolved measurements (τ = 1.35 ns). Trp and 1,8-ANS:NCS1 data were analysed using a sum of three discrete exponential decay model according to Equation 7.54 We attempted to analyse fluorescence decay data using other models such as a single exponential decay model, a sum of two discreet exponential decay model, or a Gaussian distribution model. Those models provided less satisfactory fits than the three discrete exponential decay model based on the χ2 parameter and residuals. The data were analysed using Vinci software (ISS Inc., Champaign, IL).
 |
(7) |
where I(t) is the emission intensity, αi is the pre-exponential factor, t is the time, and τi is the lifetime. The time resolved anisotropy data were analysed using a double-exponential decay model according to Equation 855 using Vinci software.
 |
(8) |
where Θ1 and Θ2 represent the rotational correlation times, and r1 and r2 are anisotropy amplitudes.
Nano electrospray Ionization Fourier transform ion cyclotron resonance mass spectrometry (nESI-FT-ICR MS). Ultrahigh resolution MS experiments were performed in a Solarix 7T FT-ICR MS spectrometer with an infinity ICR cell (Bruker Daltonics Inc., MA) and a custom-built nanoESI source operated in positive ion mode. Small aliquots (7-10 μL) of NCS1 samples were loaded into a glass capillary tip located at the instrument inlet. Typical operating conditions were 1600 V capillary voltage, skimmer 15 V, funnel RF amplitude 230 Vpp, transfer line RF 400 Vpp, and collision cell RF 1000 Vpp. Broadband MS spectra (500–600 scans) in the mass range of 600–3500 Da were collected at 1 MW data acquisition size. External mass calibration was performed using Agilent Tuning Mix calibration standard.
Native Trapped Ion Mobility Spectrometry − Mass Spectrometry (nESI-TIMS−MS). In TIMS, ions are separated in terms of their mobility where TIMS holds the ions stationary using an electric field against a moving column of gas. The separation in a TIMS device works by the center of the mass frame using the same principles as in a conventional IMS drift tube. The TIMS analyser was coupled to a maXis Impact Q-UHRToF instrument (Bruker Daltonics Inc., Billerica, MA). Data acquisition was controlled using in-house software, written in National Instruments Lab VIEW (2012, version 12.0f3) and synchronized with the maXis Impact acquisition program. TIMS separation was performed using nitrogen as a bath gas at ∼300 K, and typical P1 and P2 values are 1.8 and 0.6 mbar, respectively. The same RF (880 kHz and 200 − 350 Vpp) was applied to all electrodes, including the entrance funnel, the mobility separating section, and the exit funnel. A custom-built, nano electrospray ionization source was coupled to the TIMS − MS analyzer and was used for all analyses. A typical source voltage of 600−1200 V was used, and analyses were performed in positive ion mode. Mobility calibration was performed using the Tuning Mix calibration standard (G24221A, Agilent Technologies, Santa Clara, CA) in positive ion mode (e.g. m/z = 322, K0 = 1.376 cm2 V–1 s–1 and m/z = 622, K0 = 1.013 cm2 V–1 s–1).56 The TIMS operation was controlled using in-house software, written in National Instruments Lab VIEW, and synchronized with the maXis Impact Q-ToF acquisition program. Theoretical CCS were calculated using the IMoS (v1.04b) package with nitrogen as a bath gas at ca. 300 K.57,58
Results
Impact of non-physiological metals binding to NCS1 on Trp emission properties
Tryptophan emission is a powerful tool to probe structural transitions in proteins. We took advantage of the presence of two Trp residues (W30 and W103) in the sequence of NCS1 to (i) monitor metal binding to the protein and its impact on the protein's tertiary structure and (ii) determine the affinity of NCS1 for Pb2+, Mn2+ , and Hg2+. The fluorescence emission spectra of apoNCS1, NCS1 in the presence of physiological metals (Mg2+ or Ca2+), and non-physiological ions (Pb2+, Mn2+, or Hg2+) are shown in Fig. 2.
Fig. 2.

Intrinsic fluorescence emission of 10 μM NCS1 in the apo form (1 mM EDTA) and metal bound form (1 mM Mg2+and 1 mM EGTA, 1 mM Ca2+ and/or 120 μM Pb2+, 1 mM Mn2+, 1 mM Hg2+). Conditions: 10 μM NCS1 solubilized in 20 mM Tris buffer, pH 7.40, λexc = 295 nm and temperature of 20°C.
ApoNCS1 exhibits an emission maximum at 335 nm and the emission intensity increases by 18% upon Ca2+ addition and a further increase is observed upon addition of Mg2+ in the absence of Ca2+ due to distinct surrounding of Trp residues in apo-, Mg2+ , and Ca2+ bound NCS1 protein, in agreement with previously published data.20 Interestingly, NCS1 emission spectra measured in the presence of non-physiological metal ions are distinct from those measured for apo- and Mg2+ or Ca2+ bound NCS1. Specifically, addition of non-physiological metals to NCS1 results in quenching of Trp emission and in case of Pb2+ to an additional hypsochromic shift of 5 nm with respect to the spectrum for the apo protein. Such shift in the emission maximum points towards a more hydrophobic surrounding of Trp residues upon complexation with Pb2+. Interestingly, the emission spectrum recorded upon Pb2+, Mn2+, or Hg2+ addition to Ca2+NCS1 exhibits nearly identical emission intensity as the spectra of Pb2+NCS1, Mn2+NCS1, or Hg2+NCS1 in the absence of Ca2+. This result indicates that non-physiological metal ions may either displace Ca2+ from the EF hands or they bind to a distinct site on the protein surface and trigger analogous changes in the protein structure in the absence and presence of Ca2+. Unlike Trp emission intensity, the Trp absorbance at 278 nm is not sensitive to the presence of Ca2+ and other ions studied here.
Equilibrium dissociation constants for non-physiological metals binding to NCS1
The equilibrium dissociation constants for Pb2+, Hg2+, Mn2+ association to NCS1 were determined either by direct titration, i.e. adding small aliquots of metal ion solution to apoNCS1, or using the displacement approach where small aliquots of metal ion solution were added to NCS1 in the presence of 1 mM Ca2+. Fig. S1(a–b) shows emission spectra for Ca2+NCS1 as a function of increasing concentration of Pb2+ and Mn2+. The direct and displacement titration curves were determined by monitoring changes in the intrinsic Trp emission intensity and are presented in Fig. 3 and Fig. S2.
Fig. 3.

Titration curves for Pb2+ left, Mn2+ (middle), Hg2+ (right) binding to apoNCS1 (in red), and Ca2+NCS1 (in black). Conditions: 10 μM apoNCS1 or 10 μM NCS1 and 1 mM Ca2+ in 20 mM Tris buffer, pH 7.40. The solid line represents the fit of the experimental data according to Equation 2 for Pb2+ and Mn2+ titration curve and Equation 3 for Hg2+ association to NCS1.
The titration curves for Pb2+ or Mn2+binding to apoNCS1 or Ca2+NCS1 were analysed using Equation 2 to determine the equilibrium dissociation constant for Pb2+ and Mn2+ binding to the apo protein and the apparent equilibrium dissociation constant for Pb2+ and Mn2+ binding to Ca2+NCS1, respectively. The measured equilibrium dissociation constants are listed in Table 1. Both approaches, direct titration and displacement approach, provide nearly identical equilibrium dissociation constants for Pb2+ and Mn2+ binding to apoNCS1 with Kd, Pb2+ = 7.0 ± 1.0 nM and Kd, Mn2+ = 34.0 ± 6.0 nM. The very good agreement between the Kd values obtained by both approaches supports the binding mechanism where Pb2+ and Mn2+ displaces Ca2+ from the EF-hands. The number of binding sites (n parameter in Equation 2) obtained by analysing the titration curves were approximately 1 for Pb2+ and Mn2+ binding to apoNCS1 and Ca2+NCS1. This value is lower than number of binding sites identified using MS spectrometry. The discrepancy is likely due to the fact that the fluorescence change due to the ion binding to individual binding sites may not be additive or binding to certain EF-hands may not lead to a measurable fluorescence signal. The titration curves for Hg2+ binding to both apoNCS1 and Ca2+NCS1 were fitted using a two binding site model, Equation 3, as the data analysis using one binding site model did not provide a satisfactory fit, suggesting the presence of at least two Hg2+ binding sites with distinct affinities. The analysis of titration curves for Hg2+ binding to apoNCS1 and Ca2+NCS1 provided nearly identical equilibrium dissociation constants, suggesting that Hg2+ does not displaces Ca2+ from EF-hands.
Table 1.
Emission λmax and metal ions binding properties of metal: NCS1 complexes.
| Metal Ion |

|
Kd,appCa2+NCS1 (μM) | KdapoNCS1 (μM) | KdapoNCS1 (μM) | Kd,appCa2+NCS1:ANS (μM) |
|---|---|---|---|---|---|
| Ca2+ displacement | direct titration | ||||
| Ca2+a | 332 | n. a. | n. a. | 0.096 ± 0.048 | n. d. |
| Pb2+ | 330 | 68.0 ± 2.0 (1.0 ± 0.06) | 0.006 ± 0.002 | 0.007 ± 0.004 (0.95 ± 0.05) | 103 ± 23 |
| Mn2+ | 335 | 340 ± 67 (1.1 ± 0.03) | 0.034 ± 0.006 | 0.037 ± 0.003 (1.05 ± 0.05) | 924 ± 185 |
| Hg2+ | 335 | 5.1 ± 1.3 (0.6) 272 ± 126 (0.4) | n.a. | 5.1 ± 2.6 (0.7) 315 ± 129 (0.3) | 18.8 ± 3.0 |
Impact of non-physiological metals binding to NCS1 on the protein secondary structure
To determine whether the metal binding alters the secondary structure of the NCS1 protein, far-UV circular dichroism experiments were carried out for the apo and metal bound NCS1 at room temperature (Fig. 4).
Fig. 4.

Far-UV CD spectra of 10 μM NCS1 protein in apo and metal bound form. Experimental conditions as in the Fig. 2.
The CD spectra recorded between 200 and 250 nm show that binding of Ca2+ leads to a decrease in the CD signal at 220 and 208 nm, in agreement with previous data.59 Addition of non-physiological metals to NCS1 causes a more negative CD signal at 208 and 220 nm, compared to apo- and Ca2+ bound protein, due to an increase of the protein α-helical content or rearrangement of α- helices. Notably, the CD spectra measured upon Pb2+, Mn2+, or Hg2+ addition to Ca2+NCS1 are nearly identical to that of Pb2+, Mn2+, Hg2+ bound NCS1 in the absence of Ca2+.
Solvent accessibility of Trp residues
To further investigate the changes in the protein structure due to the non-physiological metal binding, we have characterized the solvent accessibility of W30 and W103, by probing Trp emission quenching using a neutral quencher, acrylamide. The emission spectra of Pb2+NCS1 as a function of increasing concentration of acrylamide are shown in Fig. S1(d). The ratio of the fluorescence intensities in absence and presence of acrylamide was plotted as a function of the quencher concentration and the Stern–Volmer constant was determined according to Stern–Volmer equation (Equation 5). The Stern–Volmer plot and the calculated results are presented in Fig. 5 and Table 2, respectively.
Fig. 5.

Stern–Volmer plot for acrylamide quenching of Trp emission in apo and metal bound NCS1 protein. Conditions: 10 μM NCS1, 1 mM EDTA, 1 mM Mg2+, 1 mM Ca2+ and/or 120 μM Pb2+, 1 mM Mn2+, or 1 mM Hg2 in 20 mM Tris buffer, pH 7.40. Solid lines correspond to the linear fit of the experimental data, and the error bar represents the standard deviations from three independent measurements.
Table 2.
Ksv and kq values for NCS1 emission quenching by acrylamide.
| KSV (M–1) | <τ0> (ns) | <τq> (ns) | kq (M–1s–1) | |
|---|---|---|---|---|
| ApoNCS1 | 2.82 ± 0.34 | 4.06 | 1.74 | (6.9 ± 0.8) ×1010 |
| Mg2+NCS1 | 3.36 ± 0.06 | 4.6 | 1.82 | (7.3 ± 0.1) ×1010 |
| Ca2+NCS1 | 3.11 ± 0.05 | 3.59 | 1.78 | (8.7 ± 0.2) ×1010 |
| Pb2+NCS1 | 1.66 ± 0.20 | 2.64 | 2.31 | (6.3 ± 0.7) ×1010 |
| Mn2+NCS1 | 2.54 ± 0.08 | 3.67 | 1.56 | (6.9 ± 0.2) ×1010 |
| Hg2+NCS1 | 2.51 ± 0.15 | 3.06 | 2.01 | (8.2 ± 0.5) ×1010 |
Acrylamide quenching of Mg2+NCS1 exhibits the Stern–Volmer quenching constant (Ksv = 3.36 ± 0.06 M–1) that is larger than that determined for Ca2+NCS1 (Ksv = 3.11 ± 0.05 M–1) and for the apo protein (KSV = 2.82 ± 0.34 M–1). The increase in the KSV value is consistent with the enhanced Trp accessibility in the presence of Mg2+ ion. The comparable KSV values determined for apoNCS1 and Ca2+NCS1 indicate that even through Ca2+ triggers changes in the NCS1 secondary structure and an increase in Trp emission intensity, the solvent accessibility of W30 and W103 sidechains is not affected by the Ca2+ binding to EF-hands. This is consistent with the identical Trp emission maximum in apo and Ca2+NCS1, indicating similar polarity of Trp microenvironment in the metal free and Ca2+ bound protein.
On the other hand, binding of Pb2+ and to similar extent Hg2+ and Mn2+ binding, result in a decreased accessibility of Trp residues as evident from smaller KSV values (Ksv = 1.66 ± 0.20 M–1 for Pb2+NCS1). The linear Stern–Volmer plots and the ability of acrylamide to equally quench the emission intensity and Trp lifetime, suggest that the acrylamide acts as a collisional quencher for the Trp fluorophores. This is further supported by the values for bimolecular quenching constant, kq ∼1010 M–1s–1 i.e. consistent with the diffusion-limited mechanism for acrylamide quenching of Trp fluorescence. The acrylamide quenching data were also analysed using a modified Stern–Volmer equation (Equation 9)60:
 |
(9) |
where I0 and I are the emission in the absence and presence of the quencher, respectively, and fa is the fraction of fluorophore accessible to the quencher. Analysis of the quenching data for apo, Ca2+ , and Pb2+ bound NCS1 using the modified Stern–Volmer equation provided fa values of ∼1 (Fig. S3 and Table S2) suggesting that W30 and W103 are fully quenched by acrylamide in the apoNCS1 and Ca2+ or Pb2+ bound protein. Interestingly, in case of Hg2+NCS1, at least one Trp residue is only partially accessible to the quencher as the fa value for acrylamide quenching is 0.78. As the modified Stern–Vomer plot for Mn2+NCS1 is not linear, the data at low and high concentration of acrylamide were analysed separately using Equation 9. The fa value obtained at high concentration of quencher is close to unity, fa = 0.96, in agreement with the complete quenching of both Trp residues. The fa value determined at the quencher concentrations below 250 mM is ∼0.57 suggesting limited accessibility of either one or both Trp residue in Mn2+NCS1.
Time resolved study of Trp emission
Trp lifetime is highly sensitive to interactions between Trp indole ring and surrounding residues and provides important insight into conformational dynamics of W30 and W103 surrounding in apo and metal bound forms of NCS1. The fluorescence decay data (Fig. S4) were analysed using a sum of three exponential decay model and determined parameters are summarized in Table 3. The binding of Mg2+ to NCS1 leads to an increase in the average lifetime with respect to the lifetime for the apo protein, <τ> = 4.06 ns for the apo protein and <τ> = 4.60 ns for the Mg2+ bound protein. Binding of other metals, including Ca2+, results in shorter average fluorescence lifetimes compared to apoNCS1. Namely, association of Pb2+ to NCS1 and Ca2+NCS1 leads to a decrease in the fluorescence lifetime with <τ> = 2.64 ns and 2.84 ns, respectively, mainly due to the decrease of τ1 and increase of the pre-exponential factor α1. Similar decrease in the average value of fluorescence lifetime was observed for other non-physiological metals (<τ> = 3.67 ns for Mn2+NCS1 and <τ> = 3.06 ns for Hg2+NCS1).
Table 3.
Fluorescence decay parameters for NCS1 in the presence/absence of metal ions.
| τ1 (ns) | α1 (%) | f 1 (%) | τ2 (ns) | α2 (%) | f 2 (%) | τ3 (ns) | α3 (%) | f 3 (%) | <τ> (ns) | χ2 | |
|---|---|---|---|---|---|---|---|---|---|---|---|
| ApoNCS1 | 0.64 | 49.65 | 12.70 | 3.36 | 39.33 | 60.00 | 6.73 | 11.00 | 26.30 | 4.06 | 1.60 |
| Mg2+NCS1 | 0.43 | 51.55 | 10.00 | 3.79 | 44.51 | 49.67 | 7.16 | 11.50 | 33.00 | 4.60 | 1.10 |
| Ca2+NCS1 | 0.60 | 34.45 | 12.95 | 2.82 | 47.10 | 50.20 | 5.38 | 18.50 | 36.90 | 3.59 | 1.10 |
| Pb2+NCS1 | 0.03 | 96.67 | 23.77 | 1.79 | 1.98 | 28.83 | 4.34 | 1.35 | 47.50 | 2.64 | 1.20 |
| Ca2+Pb2+NCS1 | 0.04 | 90.24 | 13.00 | 1.39 | 4.93 | 24.00 | 3.98 | 23.50 | 44.00 | 2.84 | 1.13 |
| Mn2+NCS1 | 0.21 | 62.91 | 10.00 | 2.80 | 23.82 | 33.33 | 5.84 | 13.20 | 56.70 | 3.67 | 1.18 |
| Ca2+Mn2+NCS1 | 0.26 | 51.85 | 10.00 | 2.84 | 40.74 | 27.00 | 6.55 | 7.40 | 63.00 | 3.61 | 1.04 |
| Hg2+NCS1 | 0.17 | 71.50 | 12.00 | 1.79 | 15.78 | 31.00 | 4.30 | 12.40 | 56.30 | 3.06 | 1.15 |
| Ca2+Hg2+NCS1 | 0.15 | 60.00 | 4.50 | 1.47 | 22.08 | 28.50 | 4.10 | 18.40 | 66.50 | 3.18 | 0.90 |
αi denotes the amplitude factors and fi corresponds to fractional intensity
To determine the impact of non-physiological metals binding on NCS1 oligomerization, we measured the anisotropy decay of Trp residues in apo, and metal bound NCS1 using frequency domain approach (Fig. 6). The data were analysed using a sum of two rotational correlation times: Θint corresponds to the rotational correlation time of the fluorophore and Θprot reflects the rotational correlation time of the protein. The theoretical Θ value was calculated based on the Stokes—Einstein equation (Θcalc = ηV/RT)50 where η is the viscosity of water (η = 1.02 cP),50 V is the hydrodynamic molecular volume, R is the ideal gas constant, and T is the temperature (293 K). Based on molar weight of NCS1 of 23 kDa and considering the shape of NCS1 to be spherical, we estimated the rotational correlation time for the NCS1 monomer to be 12 ns and the NCS1 dimer to be 24 ns, respectively. The measured rotational correlation times for the NCS1 samples in the presence and absence of metals ions are listed in Table 4. For all samples, a sub nanosecond rotational correlation time, Θint, was observed and can be attributed to a local motion of Trp side chains around Cα-Cβ or Cβ-Cγ bond as its values is comparable to the reported values for Trp sidechain mobility in troponin C and its mutants (Θint = 0.33 ns to 1.46 ns).61 The binding of metals to NCS1 has relatively small impact on the Trp side chain mobility as Θint increases from 0.11 ns for the apo protein to 0.39 ns for the Ca2+ bound protein. The values measured for NCS1 in complex with non-physiological metals are somewhat smaller than the value determined for Ca2+NCS1 and range from 0.22 ns to 0. 33 ns. These value indicate a decreased mobility of Trp sidechains in NCS1 in the presence of Ca2+ and non-physiological metals possibly due to a more compact environment of Trp residues upon metal binding to EF-hands. The longer rotational correlation time, Θprot, can be attributed to a tumbling motion of the entire protein and reflects the changes in the protein's oligomerization state. Shorter Θprot was observed for apoNCS1 (Θprot = 14.3 ns) and Mn2+NCS1 (Θprot = 13.0 ns) and this value is comparable to Θcalc calculated for the NCS1 monomer suggesting monomeric form of NCS1 in the apo form and in the presence of Mn2+. The value of, Θprot doubles for NCS1 in complex with Ca2+, Pb2+ , and Hg2+, Θprot = 24.0, 24.6 and 25.0 ns, respectively, indicating that Ca2+, Pb2+ , and Hg2+ binding to the protein triggers the dimerization of NCS1.
Fig. 6.

Time resolved anisotropy data for apo and metal bound NCS1. Solid and open symbols represent Δ phase shift and amplitude ratio, respectively, measured as a function of modulation frequency. Solid line represents the non-linear fit of the experimental data using a two exponential decay model. Conditions: 10 μM NCS1, 20 mM Tris buffer, pH 7.40, 1 mM EDTA, 1 mM Ca2+, 120 μM Pb2+, 1 mM Mn2+ or 1 mM Hg2+. Temperature 20 °C.
Table 4.
Anisotropy decay parameters for NCS1 and 1,8-ANS: NCS1 complex in the presence/absence of metal ions.
| NCS1 | 1,8-ANS: NCS1 | |||||||||
|---|---|---|---|---|---|---|---|---|---|---|
| Metal Ion | Θint (ns) | f 1 (%) | Θprot (ns) | f 2 (%) | χ2 | ΘANS (ns) | f 1 (%) | Θprot (ns) | f 2 (%) | χ2 |
| Apo | 0.11 ± 0.01 | 88 | 14.3 ± 1.6 | 12 | 0.5 | 0.11 | 33 | 14 ± 2.7 | 67 | 0.3 |
| Ca2+ | 0.39 ± 0.02 | 75 | 24.0 ± 0.6 | 25 | 1.0 | 0.11 | 23 | 18 ± 5.0 | 77 | 0.6 |
| Pb2+ | 0.21 ± 0.04 | 86 | 24.6 ± 1.0 | 14 | 0.7 | 0.11 | 17 | 23 ± 6.2 | 82 | 0.4 |
| Mn2+ | 0.23 ± 0.07 | 80 | 13.0 ± 1.3 | 20 | 1.1 | 0.11 | 45 | 10 ± 2.8 | 55 | 0.6 |
| Hg2+ | 0.33 ± 0.05 | 88 | 25.0 ± 1.6 | 12 | 0.8 | 0.11 | 29 | 37.0 ± 3.5 | 71 | 0.6 |
Non-physiological metal induced changes in NCS1 surface hydrophobicity
1,8-ANS is a hydrophobic fluorescence probe that is nearly non-fluorescent in the aqueous solution and it's quantum yield increases in the non-polar environment. This probe is often used to monitor conformational changes in proteins as it binding to hydrophobic cavities on protein surface results in fluorescence increase and hypsochromic shift in the emission maximum.62 It was shown previously by Aravind et al.20 that Ca2+ and Mg2+ association to NCS1 promotes binding of 1,8-ANS molecules to hydrophobic cavities on NCS1 surface and a similar impact of Ca2+ binding on protein hydrophobic surfaces was reported for Ca2+ binding to DREAM.6 Here, we investigated whether binding of non-physiological metals impacts NCS1 affinity for 1,8-ANS. The emission spectrum of 1,8-ANS: apoNCS1 complex exhibits a maximum at 466 nm and the spectra for both apo and metal bound complexes are shown in Fig. 7. Addition of Ca2+ or Mg2+, has a distinct impact on the emission spectrum of 1,8-ANS: NCS1 complex, as emission intensity decreases for 1,8-ANS: Mg2+NCS1 complex and increases for 1,8-ANS: Ca2+NCS1 complex, in agreement with previously published results.20 Addition of non-physiological metals leads to an increase in the emission intensity of the 1,8-ANS: NCS1 complex without concomitant change in the emission maximum. These results demonstrate that association of non-physiological metals leads to an increase in 1,8-ANS binding that can be associated with the enhanced solvent exposed hydrophobic surfaces. The emission spectra for Pb2+, Mn2+, Hg2+ bound 1,8-ANS: NCS1 complexes show almost identical intensity in presence and absence of Ca2+ ion which is consistent with the Trp emission and far-UV CD results.
Fig. 7.
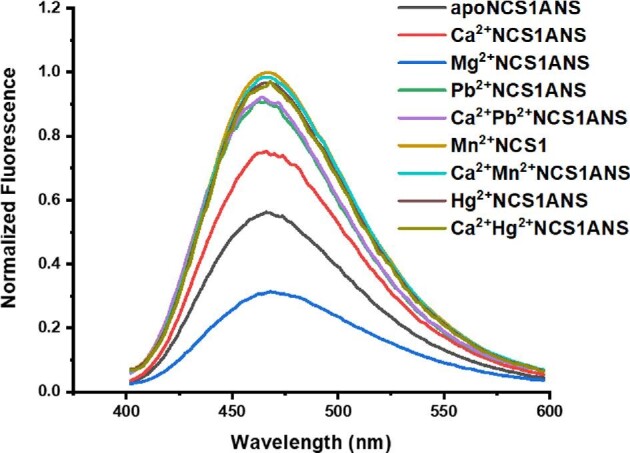
Emission spectra of NCS1:1,8-ANS complexes in absence and presence of metal ions. Samples were excited at 350 nm. The experimental conditions as in Fig. 2.
We took advantage of the distinct emission intensity of metal free, and metal bound 1,8-ANS: NCS1 complex, to characterize the equilibrium dissociation constants for non-physiological metal binding to this protein. To determine the affinity of the non-physiological metals, small aliquots of metal solution were added to 1,8-ANS: Ca2+NCS1 complex and the changes in 1,8-ANS emission were measured (1,8-ANS: Ca2+NCS1 emission traces as a function of Pb2+ concentration are shown in Fig. S1(c)). The titration curves for non-physiological metals binding to NCS1 in presence of 1,8-ANS are shown in Fig. S5 and the determined apparent dissociation constants are summarized in Table 2. The titration curve for Hg2+ and Mn2+ binding to 1,8-ANS: Ca2+NCS1 complex are hyperbolic and provide an apparent dissociation constant of 18.8 ± 3.0 μM and 924.0 ± 185.0 μM, respectively. The recovered apparent dissociation constants are larger than that determined by monitoring the emission of intrinsic Trp residues, suggesting the 1,8-ANS association to the hydrophobic sites on the protein surface modulates the affinity for metals. Unlike Mn2+ and Hg2+, the titration curve for Pb2+ binding to Ca2+NCS1 in the presence of 1,8-ANS is cooperative with  = 103.0 ± 23.0 μM and n = 1.57 ± 0.06, suggesting allosteric interactions between 1,8-ANS binding site(s) and Pb2+ binding sites.
Identification of ANS binding sites
To better understand the impact of non-physiological metals binding to NCS1 on the protein's hydrophobic surface, we have identified 1,8-ANS binding sites through ligand docking simulations using Auto dock software version 4.2.63 The NMR structure of Ca2+ bound NCS1 (PDB entry 2LCP) was used as the static macromolecule and the 1,8-ANS ligands as flexible molecules. The binding sites were identified based on the free energy values and the presence of favorable hydrophobic and electrostatic interactions between the fluorescent probe and the protein. Non-specific binding sites were excluded from this study due to unfavorable binding energy and hydrophobic/polar interactions. Two potential 1,8-ANS binding sites were found (Fig. S6) with the first binding site located at the interface between EF-hand 3 and EF-hand 4. In this site, 1,8-ANS molecule is surrounded by mostly hydrophobic residues (L97, L101, A104, L107, Y108, F169, I179, V180, A182, L183). Site-1 also contains three polar residues (K100, Q181, S184) with positively charged K100 sidechain stabilizing an 1,8-ANS molecule through ionic interactions with the sulfate group. The second binding site is found in the interface between EF- 1 and EF-2 with 1,8-ANS molecule surrounding being more polar as three polar residues (Q29, K36, D37, Q54) and seven hydrophobic residues (W30, G33, F34, L43, I51, F55, F85) surround the probe. In addition to hydrophobic interactions, the fluorescent probe forms an ionic bond with the sidechain of the nearby K36 residue.
Determination of lifetime for 1,8-ANS bound to NCS1: metal complexes
To further characterize the properties of the 1,8-ANS binding sites, we have determined the fluorescence lifetime of 1,8-ANS bound to the protein in the absence and presence of metal ions (Fig. S7). Analysis of lifetime data using sum of three discrete exponential decay model provide three lifetimes (Table S3). The shortest lifetime corresponds to an unbound 1,8-ANS molecule (τ1 = 0.28 ns) whereas additional two lifetimes reflect the fluorescence decay of 1,8-ANS bound to at least two binding sites on the protein surface. We attribute the longest lifetime, τ3 = 13.2 ns to 17.2 ns to 1,8-ANS associated to the binding site between EF-hand 3 and EF-hand 4, as the probe in this site is surrounded by hydrophobic residues, resulting in the stabilization of the 1,8-ANS excited state. The modulation of τ3 and α3 values by metal binding to NCS1 indicates the polarity of this site is influence by the metal binding to EF-hands. Analogously, the τ2 reflects the fluorescent probe that is located in the binding site between EF-hand 2 and EF-hand 1 as its surrounding is formed by more polar residues compared to the binding site located between EF-hand 3 and 4. The value of both lifetimes, τ2 and τ3, and corresponding α2 and α3 values decrease upon Mg2+ binding to NCS1, which agrees with steady state data that shown the lowest emission intensity for 1,8-ANS bound to Mg2+NCS1. On the other hand, binding of Ca2+ and non-physiological metals leads to the increase in both lifetimes and pre-exponential factors, suggesting that binding of non-physiological metals has analogous impact on exposure of hydrophobic surfaces on NCS1 surface as Ca2+ ion.
Determination of rotational correlation times for 1,8-ANS: NCS1 complexes in time resolved anisotropy measurements provides additional way to determine oligomerization state of NCS1 in the presence or absence of metals. The time resolved anisotropy data (Fig. S8) were analysed using a sum of two rotational correlation times with ΘANS, corresponding to the unbound probe, and Θprot reflecting the tumbling motion of the entire protein in the presence of 1,8-ANS probe and recovered parameters are listed in Table 4. The ΘANS value was fixed to be 0.11 ns whereas other fitting parameters were allowed to vary during the analysis. For the apoNCS1, Mn2+ NCS1 and Pb2+NCS1, the Θprot values is nearly identical to those determined by monitoring time resolved anisotropy of intrinsic Trp probe, in agreement with the fact that these values reflect the size of the protein and thus are independent of the fluorescent probe. The small value of Θprot 14 ns, observed for apo protein and Mn2+NCS1 indicate that the protein is predominantly monomeric, whereas Θprot = 23 ns determined for Pb2+NCS complex agrees with the dimeric form of Pb2+ NCS1. Interestingly, the Θprot value measured for Ca2+NCS1, Θprot = 18 ns, is between the values expected for the monomeric and dimeric proteins. Therefore, the time resolved anisotropy curves were fitted using the sum of three exponential decay model. This approach provided Θprot1 = 10 ns and Θprot2 = 20 ns, suggesting the presence of the monomeric and dimeric forms of 1,8-ANS: Ca2+NCS1. The result of two exponential decay analysis for 1,8-ANS: Hg2+NCS1 complex provide Θprot = 37 ns. This value is significantly larger than expected for a dimeric protein and may indicate distinct conformation of 1,8-ANS: NCS1 in the presence of Hg2+.
Native FT-ICR MS and TIMS-MS analysis of Pb2+, Mn2+, and Hg2+ binding to NCS1
Newly developed mass spectrometry techniques became excellent tools in the field of structural biology due to their capability to investigate protein structure and structural changes including metal ions interactions with metalloproteins.64 Specifically, nESI-FT-ICR MS allows to quantify the binding stoichiometry and identify presence of distinct proteoforms based on the charge state distribution.64 TIMS-MS is well suited for monitoring impact of metal ions on protein structure in terms of changes in collisional cross section (CSS) values that reflect protein three-dimensional shape. The nESI-FT-ICR MS analysis of the apo form of NCS1 resulted in a neutral mass of 22,976 Da, in good agreement with the theoretical average neutral mass (22 975.6 Da) calculated based on the protein sequence (Fig. S9a bottom). The native MS spectra of NCS1 in the presence of Ca2+ or Mn2+ (Fig. S9a–c), and Pb2+ (Fig. 8) show a bimodal distribution of charge states with a narrow distribution centered at the 8 + charge state. Additional broad envelopes of low abundant species centered at 19 + for NCS1 in the presence of Ca2+ and 16 + for NCS1 in the presence of Pb2+, Mn2+ are also observed. The narrow distribution of low charges (7+ to 9+) are characteristic of native like conformations whereas the higher charges can be attributed to partially destabilized structures. Interestingly, NCS1 remains in the metal, predominantly Ca2+ bound form in all charge states observed including higher charge states (16+ to 20+) pointing towards enhanced structural stability and affinity for bivalent metals of this protein (Fig. 8 and Fig. S9a–c).
Fig. 8.

Expanded view of the 8 + charge state with annotated adduct species and the isotopic pattern of the ion [M•2Pb•2Ca]8+ shown in the inset (A). Typical broadband nESI-FT-ICR MS spectrum of NCS1 in the presence of Pb2+ (B). Deconvoluted spectrum showing the neutral species. The isotopic pattern shown in the inset confirms the theoretical isotopic average mass of the NCS1 protein 22.976 kDa (C).
A closer inspection of the 8 + charge state for NCS1 in the presence of Ca2+ (Fig. S9a) reveals the presence of several adducts including apo protein of a low abundance, and one to four Ca2+ bound NCS1 adducts with the NCS1: (Ca2+)3 complex being the most abundant, in agreement with the Ca2+ binding to three EF-hands (2, 3, and 4). The presence of NCS1: (Ca2+)4 adduct indicates that fourth Ca2+ ion can either bind to the non-functional EF-1 as observed previously for Ca2+ binding to EF-hand 1 in DREAM 65 or to a distinct binding site on the protein surface in the gas phase. The analysis of the charge state 8 + for NCS1 in the presence of Pb2+ is more complex (Fig. 8), as it contains NCS1: (Ca2+)1-4 adducts and NCS1: (Pb2+)1-3: (Ca2+)1-3 adducts. As observed for NCS1 samples in the presence of Pb2+, the MS analysis of NCS1 in the presence of Mn2+ (Fig. S9b) reveals several adducts with NCS1: (Mn2+)3 being the most abundant. Notably, the total metal binding stoichiometry of 4:1 is consistent with four EF-hands being the metal binding sites. Also, the absence of adducts with 4 Ca2+ and additional Pb2+ or Mn2+ ions bound to the protein agrees with the mechanism when Pb2+ or Mn2+ displaces Ca2+ from the EF-hands. Interestingly, we were unable to detect peaks corresponding to the NCS1 dimer in the MS spectra for Ca2+NCS1 and Pb2+NCS1. Such absence of the dimeric form is consistent with a low stability of the NCS1 dimer in the gas phase.
The native nESI-TIMS—MS data provided additional insight into the protein's conformation in the presence of various metals. The CCS values of ∼ 2145 Å2 to 2164 Å2 determined for the charge state 8 + of NCS1 in the presence of Ca2+, Pb2+, and or Mn2+ (Fig. S10) are nearly identical to the CCS values observed for 8 + charged state of apo protein 2153 Å2 and 2158 Å2 (Table S4) and the CCS value of 2428 Å2 calculated based on the Ca2+ bound NCS1 structure (PDB entry 2LCP) suggesting small impact of metal binding to EF-hands on the overall conformation of NCS1. Such negligible influence of metal binding on the overall protein structure may be a common feature for NCS proteins. These observations are in good agreement with reported NMR structures of one and two Ca2+ ion bound recoverin (PDB entry 4M2O and 4YI8) in the non-myristoylated form.
Discussion
The results reported here show NCS1’s capability of binding various abiogenic metals including neurotoxic Pb2+ and Hg2+ as well as biogenic Mn2+ with sub-nanomolar affinity. Interestingly, the association of non-physiological metals triggers conformational changes that are distinct from those triggered by physiological metal ions Ca2+ or Mg2+ pointing towards a high conformational flexibility of NCS1. EF-hand protein CaM has been frequently used as a model protein to investigate protein interactions with ions as its EF-hands bind various biogenic and abiogenic metals including divalent ions Pb2+, Cd2+, Zn2+, Hg2+, Sr2+, Mn2+ and trivalent ions La3+, Tb3+, and Sm3+.9 The interactions of non-physiological metal ions with CaM seem to be complex as they either directly compete with Ca2+ to bind to EF-hands and/or bind to so called auxiliary sites.66 Interactions between CaM and Pb2+ attracted significant attention as CaM was proposed to be a putative target for Pb2+ and Pb2+ neurotoxicity.67 As a soft-to-borderline metal ion, Pb2+ binds to oxygen ligands from sidechains of Asp and Glu residues and can adopt either hemi-directed geometry as observed in the X-ray structure of Pb2+ bound CaM (PDB entry 1N0Y) or holo-directed geometry as proposed for Pb2+ binding to CaM using computational approach.67,68
The nearly identical equilibrium dissociation constants determined by direct titration and Ca2+ displacement and the stoichiometry data showing maximum total number of metals binding to NCS1 to be four demonstrate that Pb2+ replaces native Ca2+ in EF-hands of NCS1 and apoNCS1 has 15 times higher affinity for Pb2+ compared to its native ion Ca2+. Both Pb2+NCS1, and 1,8-ANS: Pb2+NCS1 complex exhibit distinct fluorescence properties from Ca2+NCS1 and 1,8-ANS: Ca2+NCS1 complex, suggesting that Pb2+ binding does not trigger identical conformational changes in NCS1 as determined for Ca2+. This may be due to the distinct coordination geometry, as Pb2+ prefers six ligands in hexagonal geometry whereas Ca2+ favors a pentagonal bipyramidal configuration with seven-oxygen ligands.67 Notably, unlike Pb2+ association to NCS1, Pb2+ binding to 1,8-ANS: NCS1 complex is cooperative, n = 1.57 ± 0.06, and Pb2+ binds to 1,8-ANS: NCS1 with an affinity constant i.e. two times smaller than that for Pb2+ binding to NCS1 in the absence of 1,8-ANS pointing towards the presence of allosteric interactions between 1,8-ANS binding site and Pb2+ bound EF-hands. This is reminiscent of a non-cooperative Ca2+ association to NCS1 and its cooperative binding to myristoylated NCS1.69 Although the Trp residues in Pb2+NCS1 show distinct photo-physical properties compare to Trp residues in Ca2+NCS1 complex, Pb2+ association to EF-hands triggers NCS1 dimerization as observed previously for Ca2+ suggesting, that long-range structural changes required for protein dimerization are analogous in Ca2+NCS1 and Pb2+NCS1.
Analogous to Pb2+, Mn2+ also prefers six oxygen ligands in its coordination geometry.8 To predict Mn2+ binding sites in NCS1 we have used the Metal Ion-Binding Site Prediction and Docking Server (MIB).70 The docking results are summarized in Fig. S11. Potential residues for Mn2+ coordination overlap with the residues from EF-hand 2, 3, and 4 that coordinate Ca2+ in the NCS1 X-ray structures and together with the MS data, these results suggest that Mn2+ ions occupy three EF-hands in NCS1 in a similar position as Ca2+ ions. This is consistent with the X-ray structure of CaM with Mn2+ bound to the N-terminal EF-hands shows that Mn2+ binds to a position i.e. similar to that for Ca2+ but unlike Ca2+ coordination, the Glu residue in the 12th position serves as a monodentate ligand.8 The MS data indicate binding up to four Mn2+ ions to EF-hands in NCS1. In the gas phase, Mn2+ ions can bind to EF-hand 1 that is inactive in the solution or additional Mn2+ binding may be due to non-specific Mn2+ interactions with NCS1. Also, we cannot exclude that more than one Mn2+ ion binds to a single EF-hand as observed in the Mn2+ bound CaM structure (PDB entry 3UCT). Interestingly, although photo-physical properties of Trp residues in Mn2+NCS1 complex and properties of Mn2+NCS1:1,8-ANS complex are similar to those determined for Pb2+NCS1, i.e. increased quenching of Trp emission and increased binding of the 1,8-ANS probe in the presence of Pb2+ or Mn2+, the overall conformational changes triggered by Mn2+ and Pb2+ binding to EF-hands are distinct as Mn2+ binding to EF-hands in NCS1 does not undergo dimerization and the Mn2+ binding to NCS1:1,8ANS complex does not exhibit cooperativity.
The relatively high affinity of Hg2+ for NCS1 is surprising as this metal favors sulfur atoms in linear arrangement as the coordination ligands, although other coordination geometries such as tetrahedral and pseudo-octahedral with sulfur, nitrogen, and/or oxygen atoms as ligands were observed in structures of metalloproteins deposited in PDB.71 The prediction of Hg2+ binding sites in NCS1 using MIB was inconclusive as the potential coordination residues vary significantly based on different PDB structures used for the prediction. Unlike well documented Pb2+ affinity for EF-hands in CaM and troponin C, significantly less is known about Hg2+ interactions with EF-hand proteins. Using NMR spectroscopy, Ouyang and Vogel reported that Hg2+ binds to EF-hand 4 and EF-hand 1 in CaM with EF-hand 4 having larger affinity for Hg2+ compared to EF-hand 1.72 Nearly overlapping titration curves for Hg2+ binding to apoNCS1 and Ca2+ NCS1 provide comparable equilibrium Kd values, suggesting that Hg2+ binding sites on NCS1 surface are distinct from these for Ca2+. It is also possible that Hg2+ can bind to EF-hand(s) in the presence Ca2+. Considering that Hg2+ binding to NCS1 leads to an increase in the protein secondary structure, enhances 1,8-ANS binding to NCS1 and most importantly, triggers protein dimerization in a similar way as Ca2+ does, it seems to be unlikely that Hg2+ binding site is distinct from that for Ca2+. We propose that Hg2+ occupies EF-hands in the apo protein and in Ca2+ bound NCS1 shares EF hand with Ca2+. Although Hg2+ ionic radius of 1.02 Å is comparable to the Ca2+ ionic radius of 0.99 Å, suggesting sterically restrictions for two metals binding to a single EF hand, Hg2+ smaller coordination number and a plasticity of EF hands can promote binding of both metals. The binding of two ions to EF hands in NCS1 was reported previously by Tsvetkov et al.73 who proposed that Zn2+ binds to EF-hand 2 and 4 in NCS1 in the presence of Ca2+. In such case, Hg2+ binding to Ca2+ NCS1 partially reverses the conformational changes triggered by Ca2+, as the emission and CD spectra of Hg2+NCS1 are nearly identical in the presence and absence of Ca2+.
Importantly, the distinct emission properties of NCS1 in apo, Mg2+, Ca2+, or non-physiological metal ions bound form indicate that NCS1 carry enhanced structural flexibility as it can adopt several conformations based on the various coordination geometry of the metals and/or distinct number of EF-hands being in the metal bound form. Such conformational plasticity is likely to be crucial for functional properties of NCS1 as it may facilitate its distinct response to temporary changes in intracellular Ca2+ concentration as well as enable NCS1 to efficiently interact with various binding surfaces on effector proteins and provide molecular basis for discrimination among various intracellular targets. Indeed, analogous structural diversity was previously reported for CaM 74 and our data indicate that this feature may be also common among NCS proteins.
Also, the comparison of metal selectivity between CaM and two members of the NCS1 family, NCS1 and DREAM (Table S5), show that although all three proteins carry canonical Ca2+ binding EF-hands and all bind bivalent Pb2+ and trivalent Tb3+ with sub-millimolar affinity, EF-hands in NCS1 and DREAM demonstrate increased selectivity as NCS 1 does not bind Cd2+ and DREAM does not exhibit sub-millimolar affinity for divalent ions such as Mn2+ and Hg2+ that bind to EF-hands in CaM.9 Previously it was proposed that several factors impact the selectivity of EF-hands for various ions including (i) flexibility of metal binding loop; (ii) coordinating side chains in the binding loop and their hydrophobic contact (iii) hydrogen bonding network within the coordination loop (iv) long range electrostatic interactions in the proteins.75
The average net charge of the Ca2+ binding loops in EF-hands in CaM is more negative, with the individual net charges of −2, −4, −2, −5, compared to NCS proteins (Fig. S10). However, NCS1 and DREAM Ca2+ binding loops show comparable net charges (−2 and −3, depending on the EF-hand), so the net negative EF-hand charge cannot explain the different metal selectivity observed between DREAM and NCS1. According to the ‘side chain interaction model’ packing and multiple contacts between sidechain of coordinating residues contribute to ionic size selectivity.76 To estimate the packing of the individual EF hands we have determined the sum of the van der Waals volumes (vdW) for Ca2+ coordinating residues in each EF hand (Fig. S12). The total vdW volume of coordinating residues in DREAM and NCS1 is larger than that for coordinating residues in CaM EF-hands, suggesting an increased rigidity of the EF hand sidechains in DREAM and NCS1 that can potentially contribute to the increase in the metal binding energy and decreased affinity for certain ions. Also an additional Gly residue in the fourth position in the sequence of Ca2+ binding loops in CaM (Fig. S12) that is absent in the coordinating loops in DREAM and NCS1 EF hands, can provide additional loop flexibility, potentially allowing accommodation of various metals with different ionic radii, though Drake et al. reported relatively modest impact of Gly in the sixth position on ion affinity and selectivity of the EF-hand in E. coli galactose binding protein.77 The introduction of a negatively charged sidechain in the ninth position of EF-hand loop, so called ‘gate away’ position, was shown to lead to a decreased affinity for divalent ions and size selectivity.78 Only EF-2 in CaM and NCS1 carry negatively charge residue in the ninth position, so it is unlikely that the residue in this position enhances ion selectivity in DREAM and NCS1. Importantly, the metal binding selectivity is not only modulated by coordinating residues in individual EF-hands as the protein matrix influences the structure and rigidity of the metal binding site79 and long range electrostatic interactions and protein electric field were proposed to impact cation selectivity of EF hands in proteins.74
Summary
The data presented here indicate that in addition to physiological metals Ca2+ and Mg2+, NCS1 is capable of binding other biogenic and abiogenic metals with an affinity i.e. superior to that for Ca2+. Although, the impact of Pb2+ and Hg2+ on NCS1 structure in terms of Trp emission and secondary structure stabilization is distinct from Ca2+, both non-physiological metals promote NCS1 dimerization and thus their binding may modulate NCS1 interactions with intracellular partners in a similar way as Ca2+ ion. There results indicate that in addition to CaM, NCS1 may serve as a molecular target for toxic Pb2+ and Hg2+ as well as for biogenic metal Mn2+ and interactions between non-physiological metals and NCS1 are likely to contribute to the neurotoxic effects of those metals under acute and or chronical exposure.
Supplementary Material
Acknowledgement
This work was supported by the National Institute of Health 1R01GM134247-01 grant to FFL.
Contributor Information
Md Shofiul Alam, Department of Chemistry and Biochemistry, Florida International University, Miami, FL 33199, USA.
Samiol Azam, Department of Chemistry and Biochemistry, Florida International University, Miami, FL 33199, USA.
Khoa Pham, Department of Chemistry and Biochemistry, Florida International University, Miami, FL 33199, USA.
Dennys Leyva, Department of Chemistry and Biochemistry, Florida International University, Miami, FL 33199, USA.
Kevin Jeanne Dit Fouque, Department of Chemistry and Biochemistry, Florida International University, Miami, FL 33199, USA; Biomolecular Sciences Institute, Florida International University, Miami 33199, USA.
Francisco Fernandez-Lima, Department of Chemistry and Biochemistry, Florida International University, Miami, FL 33199, USA; Biomolecular Sciences Institute, Florida International University, Miami 33199, USA.
Jaroslava Miksovska, Department of Chemistry and Biochemistry, Florida International University, Miami, FL 33199, USA; Biomolecular Sciences Institute, Florida International University, Miami 33199, USA.
Conflicts of interest
There are no conflicts to declare.
Data availability statement
The data underlying this article are available in the article and in its online supplementary material.
References
- 1. Ebashi S., Endo M., Calcium and muscle contraction. Prog. Biophys. Mol. Biol., 1968, 18 (9), 123–183. [DOI] [PubMed] [Google Scholar]
- 2. Augustine G. J., Santamaria F., Tanaka K., Local calcium signaling in neurons. Neuron, 2003, 40 (2), 331–346. [DOI] [PubMed] [Google Scholar]
- 3. Stricker S. A., Comparative biology of calcium signaling during fertilization and egg activation in animals. Dev. Biol., 1999, 211 (2), 157–176. [DOI] [PubMed] [Google Scholar]
- 4. Mattson M. P., Chan S. L., Calcium orchestrates apoptosis. Nat. Cell Biol., 2003, 5 (12), 1041–1043. [DOI] [PubMed] [Google Scholar]
- 5. Marino V., Dell'Orco D., Evolutionary-conserved allosteric properties of three neuronal calcium sensor proteins. Front. Mol. Neurosci, 2019, 12 (50), 50–62. [DOI] [PMC free article] [PubMed] [Google Scholar]
- 6. Azam S., Miksovska J., Pb2+ binds to downstream regulatory element antagonist modulator (DREAM) and modulates its interactions with binding partners: a link between neuronal calcium sensors and Pb2+ neurotoxicity. ACS Chem. Neurosci., 2019, 10 (3), 1263–1272. [DOI] [PubMed] [Google Scholar]
- 7. Azam S., Louis G. S., Miksovska J., Cadmium association with DREAM promotes DREAM interactions with intracellular partners in a similar manner to its physiological ligand, calcium†. Metallomics, 2019, 11 (6), 1115–1127. [DOI] [PubMed] [Google Scholar]
- 8. Senguen F. T., Grabarek Z., X-ray structures of magnesium and manganese complexes with the N-terminal domain of calmodulin: insights into the mechanism and specificity of metal ion binding to an EF-hand. Biochemistry, 2012, 51 (31), 6182–6194. [DOI] [PMC free article] [PubMed] [Google Scholar]
- 9. Chao S. H., Suzuki Y., Zysk J. R., Cheung W. Y., Activation of calmodulin by various metal cations as a function of ionic radius. Mol. Pharmacol., 1984, 26 (1), 75. [PubMed] [Google Scholar]
- 10. Hendricks K. B., Qing Wang B., Schnieders E. A., Thorner J., Yeast homologue of neuronal frequenin is a regulator of phosphatidylinositol-4-OH kinase. Nat. Cell Biol., 1999, 1 (4), 234–241. [DOI] [PubMed] [Google Scholar]
- 11. Ames J. B., Hendricks K. B., Strahl T., Huttner I. G., Hamasaki N., Thorner J., Structure and calcium-binding properties of Frq1, a novel calcium sensor in the yeast Saccharomyces cerevisiae. Biochemistry, 2000, 39 (40), 12149–12161. [DOI] [PubMed] [Google Scholar]
- 12. Burgoyne R. D., The neuronal calcium-sensor proteins, Biochim. Biophys. Acta Mol. Cell. Res., 2004, 1742 (1), 59–68. [DOI] [PubMed] [Google Scholar]
- 13. Bourne Y., Dannenberg J., Pollmann V., Marchot P., Pongs O., Immunocytochemical localization and crystal structure of human frequenin (Neuronal Calcium Sensor 1)*. J. Biol. Chem., 2001, 276 (15), 11949–11955. [DOI] [PubMed] [Google Scholar]
- 14. Blachford C., Ćelić A., Petri E. T., Ehrlich B. E., Discrete proteolysis of neuronal calcium sensor-1 (NCS-1) by μ-calpain disrupts calcium binding. Cell Calcium, 2009, 46 (4), 257–262. [DOI] [PMC free article] [PubMed] [Google Scholar]
- 15. Chazin W. J., Relating form and function of EF-hand calcium binding proteins. Acc Chem. Res., 2011, 44 (3), 171–179. [DOI] [PMC free article] [PubMed] [Google Scholar]
- 16. Boeckel G. R., Ehrlich B. E., NCS-1 is a regulator of calcium signaling in health and disease. Biochim. Biophys. Acta Mol. Cell Res., 2018, 1865 (11 Pt B), 1660–1667. [DOI] [PMC free article] [PubMed] [Google Scholar]
- 17. Heidarsson P. O., Bjerrum-Bohr I. J., Jensen G. A., Pongs O., Finn B. E., Poulsen F. M., Kragelund B. B., The C-terminal tail of human neuronal calcium sensor 1 regulates the conformational stability of the Ca2+-activated state. J. Mol. Biol., 2012, 417 (1), 51–64. [DOI] [PubMed] [Google Scholar]
- 18. Cox J. A., Durussel I., Comte M., Nef S., Nef P., Lenz S. E., Gundelfinger E. D., Cation binding and conformational changes in VILIP and NCS-1, two neuron-specific calcium-binding proteins. J. Biol. Chem., 1994, 269 (52), 32807–32813. [PubMed] [Google Scholar]
- 19. Treloar H. B., Uboha U., Jeromin A., Greer C. A., Expression of the neuronal calcium sensor protein NCS-1 in the developing mouse olfactory pathway. J. Comp. Neurol., 2005, 482 (2), 201–216. [DOI] [PubMed] [Google Scholar]
- 20. Aravind P., Chandra K., Reddy P. P., Jeromin A., Chary K. V. R., Sharma Y., Regulatory and structural EF-hand motifs of neuronal calcium sensor-1: Mg2+ modulates Ca2+ binding, Ca2+-induced conformational changes, and equilibrium unfolding transitions. J. Mol. Biol., 2008, 376 (4), 1100–1115. [DOI] [PubMed] [Google Scholar]
- 21. McFerran B. W., Graham M. E., Burgoyne R. D., Neuronal Ca2+ sensor 1, the mammalian homologue of frequenin, is expressed in chromaffin and PC12 cells and regulates neurosecretion from dense-core granules. J. Biol. Chem., 1998, 273 (35), 22768–22772. [DOI] [PubMed] [Google Scholar]
- 22. Hui K., Fei G.-H., Saab B. J., Su J., Roder J. C., Feng Z.-P., Neuronal calcium sensor-1 modulation of optimal calcium level for neurite outgrowth. Development, 2007, 134 (24), 4479–4489. [DOI] [PubMed] [Google Scholar]
- 23. Nakamura T. Y., Jeromin A., Smith G., Kurushima H., Koga H., Nakabeppu Y., Wakabayashi S., Nabekura J., Novel role of neuronal Ca2+ sensor-1 as a survival factor up-regulated in injured neurons. J. Cell Biol., 2006, 172 (7), 1081–1091. [DOI] [PMC free article] [PubMed] [Google Scholar]
- 24. Yip P. K., Wong L.-F., Sears T. A., Yáñez-Muñoz R. J., McMahon S. B., Cortical overexpression of neuronal calcium sensor-1 induces functional plasticity in spinal cord following unilateral pyramidal tract injury in rat. PLoS Biol., 2010, 8 (6), e1000399–e1000399. [DOI] [PMC free article] [PubMed] [Google Scholar]
- 25. Nakao S., Wakabayashi S., Nakamura T. Y., Stimulus-dependent regulation of nuclear Ca2+ signaling in cardiomyocytes: a role of neuronal calcium sensor-1. PLoS One, 2015, 10 (4), e0125050. [DOI] [PMC free article] [PubMed] [Google Scholar]
- 26. Haynes L. P., Thomas G. M. H., Burgoyne R. D., Interaction of neuronal calcium sensor-1 and ADP-ribosylation factor 1 allows bidirectional control of phosphatidylinositol 4-kinase β and trans-golgi network-plasma membrane traffic*, J. Biol. Chem., 2005, 280 (7), 6047–6054. [DOI] [PubMed] [Google Scholar]
- 27. Haynes L. P., Sherwood M. W., Dolman N. J., Burgoyne R. D., Specificity, promiscuity and localization of ARF protein interactions with NCS-1 and phosphatidylinositol-4 kinase-III beta. Traffic, 2007, 8 (8), 1080–1092. [DOI] [PMC free article] [PubMed] [Google Scholar]
- 28. Tsujimoto T., Jeromin A., Saitoh N., Roder J. C., Takahashi T., Neuronal calcium sensor 1 and activity-dependent facilitation of P/Q-type calcium currents at presynaptic nerve terminals. Science, 2002, 295 (5563), 2276–2279. [DOI] [PubMed] [Google Scholar]
- 29. Sippy T., Cruz-Martín A., Jeromin A., Schweizer F. E., Acute changes in short-term plasticity at synapses with elevated levels of neuronal calcium sensor-1. Nat. Neurosci., 2003, 6 (10), 1031–1038. [DOI] [PMC free article] [PubMed] [Google Scholar]
- 30. Saab B. J., Georgiou J., Nath A., Lee F. J. S., Wang M., Michalon A., Liu F., Mansuy I. M., Roder J. C., NCS-1 in the dentate gyrus promotes exploration, synaptic plasticity, and rapid acquisition of spatial memory. Neuron, 2009, 63 (5), 643–656. [DOI] [PubMed] [Google Scholar]
- 31. Kabbani N., Negyessy L., Lin R., Goldman-Rakic P., Levenson R., Interaction with neuronal calcium sensor NCS-1 mediates desensitization of the D2 dopamine receptor. J. Neurosci., 2002, 22 (19), 8476–8486. [DOI] [PMC free article] [PubMed] [Google Scholar]
- 32. Lian L.-Y., Pandalaneni S. R., Patel P., McCue H. V., Haynes L. P., Burgoyne R. D., Characterization of the interaction of the C-terminus of the dopamine D2 receptor with neuronal calcium sensor-1. PLoS One, 2011, 6 (11), e27779–e27779. [DOI] [PMC free article] [PubMed] [Google Scholar]
- 33. Schlecker C., Boehmerle W., Jeromin A., DeGray B., Varshney A., Sharma Y., Szigeti-Buck K., Ehrlich B. E., Neuronal calcium sensor-1 enhancement of InsP3 receptor activity is inhibited by therapeutic levels of lithium. J. Clin. Investig., 2006, 116 (6), 1668–1674. [DOI] [PMC free article] [PubMed] [Google Scholar]
- 34. Zhang K., Heidrich F. M., DeGray B., Boehmerle W., Ehrlich B. E., Paclitaxel accelerates spontaneous calcium oscillations in cardiomyocytes by interacting with NCS-1 and the InsP3R. J. Mol. Cell. Cardiol., 2010, 49 (5), 829–835. [DOI] [PMC free article] [PubMed] [Google Scholar]
- 35. Nakamura T. Y., Jeromin A., Mikoshiba K., Wakabayashi S., Neuronal calcium sensor-1 promotes immature heart function and hypertrophy by enhancing Ca2+ signals. Circ. Res, 2011, 109 (5), 512–523. [DOI] [PubMed] [Google Scholar]
- 36. Carrié A., Jun L., Bienvenu T., Vinet M.-C., McDonell N., Couvert P., Zemni R., Cardona A., Van Buggenhout G., Frints S., Hamel B., Moraine C., Ropers H. H., Strom T., Howell G. R., Whittaker A., Ross M. T., Kahn A., Fryns J.-P., Beldjord C., Marynen P., Chelly J., A new member of the IL-1 receptor family highly expressed in hippocampus and involved in X-linked mental retardation. Nat. Genet., 1999, 23 (1), 25–31. [DOI] [PubMed] [Google Scholar]
- 37. Bahi N., Friocourt G., Carrié A., Graham M. E., Weiss J. L., Chafey P., Fauchereau F., Burgoyne R. D., Chelly J., IL1 receptor accessory protein like, a protein involved in X-linked mental retardation, interacts with Neuronal Calcium Sensor-1 and regulates exocytosis. Hum. Mol. Genet., 2003, 12 (12), 1415–1425. [DOI] [PubMed] [Google Scholar]
- 38. Gambino F., Pavlowsky A., Béglé A., Dupont J.-L., Bahi N., Courjaret R., Gardette R., Hadjkacem H., Skala H., Poulain B., Chelly J., Vitale N., Humeau Y., IL1-receptor accessory protein-like 1 (IL1RAPL1), a protein involved in cognitive functions, regulates N-type Ca2+-channel and neurite elongation. Proc. Natl. Acad. Sci. U. S.A., 2007, 104 (21), 9063–9068. [DOI] [PMC free article] [PubMed] [Google Scholar]
- 39. Moore L. M., England A., Ehrlich B. E., Rimm D. L., Calcium sensor, NCS-1, promotes tumor aggressiveness and predicts patient survival. Mol. Cancer Res., 2017, 15 (7), 942–952. [DOI] [PMC free article] [PubMed] [Google Scholar]
- 40. Piton A., Michaud J. L., Peng H., Aradhya S., Gauthier J., Mottron L., Champagne N., Lafrenière R. G., Hamdan F. F., team S. D., Joober R., Fombonne E., Marineau C., Cossette P., Dubé M.-P., Haghighi P., Drapeau P., Barker P. A., Carbonetto S., Rouleau G. A., Mutations in the calcium-related gene IL1RAPL1 are associated with autism. Hum. Mol. Genet., 2008, 17 (24), 3965–3974. [DOI] [PubMed] [Google Scholar]
- 41. Koh P. O., Undie A. S., Kabbani N., Levenson R., Goldman-Rakic P. S., Lidowl M. S., Up-regulation of neuronal calcium sensor-1 (NCS-1) in the prefrontal cortex of schizophrenic and bipolar patients. Proc. Natl. Acad. Sci. U. S.A., 2003, 100 (1), 313–317. [DOI] [PMC free article] [PubMed] [Google Scholar]
- 42. D'Onofrio S., Mahaffey S., Garcia-Rill E., Role of calcium channels in bipolar disorder. Curr. Psychopharmacol, 2017, 6 (2), 122–135. [DOI] [PMC free article] [PubMed] [Google Scholar]
- 43. Kabbani N., Woll M. P., Nordman J. C., Levenson R., Dopamine receptor interacting proteins: targeting neuronal calcium sensor-1/D2 dopamine receptor interaction for antipsychotic drug development. Curr. Drug Targets, 2012, 13 (1), 72–79. [DOI] [PMC free article] [PubMed] [Google Scholar]
- 44. Multani P. K., Clarke T.-K., Narasimhan S., Ambrose-Lanci L., Kampman K. M., Pettinati H. M., Oslin D. W., O'Brien C. P., Berrettini W. H., Lohoff F. W., Neuronal calcium sensor-1 and cocaine addiction: a genetic association study in African-Americans and European Americans. Neurosci. Lett., 2012, 531 (1), 46–51. [DOI] [PMC free article] [PubMed] [Google Scholar]
- 45. Dahl J. P., Jepson C., Levenson R., Wileyto E. P., Patterson F., Berrettini W. H., Lerman C., Interaction between variation in the D2 dopamine receptor (DRD2) and the neuronal calcium sensor-1 (FREQ) genes in predicting response to nicotine replacement therapy for tobacco dependence. Pharmacogenomics J., 2006, 6 (3), 194–199. [DOI] [PubMed] [Google Scholar]
- 46. Canfield R. L., Henderson C. R. Jr., Cory-Slechta D. A., Cox C., Jusko T. A., Lanphear B. P., Intellectual impairment in children with blood lead concentrations below 10 microg per deciliter. N. Engl. J. Med., 2003, 348 (16), 1517–1526. [DOI] [PMC free article] [PubMed] [Google Scholar]
- 47. Weisskopf M. G., Hu H., Mulkern R. V., White R., Aro A., Oliveira S., Wright R. O., Cognitive deficits and magnetic resonance spectroscopy in adult monozygotic twins with lead poisoning. Environ. Health Perspect., 2004, 112 (5), 620–625. [DOI] [PMC free article] [PubMed] [Google Scholar]
- 48. Osawa M., Tong K. I., Lilliehook C., Wasco W., Buxbaum J. D., Cheng H. Y. M., Penninger J. M., Ikura M., Ames J. B., Calcium-regulated DNA binding and oligomerization of the neuronal calcium-sensing protein, Calsenilin/DREAM/KChIP3*. J. Biol. Chem., 2001, 276 (44), 41005–41013. [DOI] [PubMed] [Google Scholar]
- 49. Pace C. N., Vajdos F., Fee L., Grimsley G., Gray T., How to measure and predict the molar absorption coefficient of a protein. Protein Sci., 1995, 4 (11), 2411–2423. [DOI] [PMC free article] [PubMed] [Google Scholar]
- 50. Gonzalez W. G., Miksovska J., Application of ANS fluorescent probes to identify hydrophobic sites on the surface of DREAM. Biochim. Biophys. Acta. Proteins Proteom., 2014, 1844 (9), 1472–1480. [DOI] [PubMed] [Google Scholar]
- 51. Hulme E. C., Trevethick M. A., Ligand binding assays at equilibrium: validation and interpretation. Br. J. Pharmacol., 2010, 161 (6), 1219–1237. [DOI] [PMC free article] [PubMed] [Google Scholar]
- 52. Kirberger M., Wong H. C., Jiang J., Yang J. J., Metal toxicity and opportunistic binding of Pb2+ in proteins. J. Inorg. Biochem., 2013, 125 (1), 40–49. [DOI] [PMC free article] [PubMed] [Google Scholar]
- 53. Wang B., Boeckel G. R., Huynh L., Nguyen L., Cao W., De La Cruz E. M., Kaftan E. J., Ehrlich B. E., Neuronal calcium sensor 1 has two variants with distinct calcium binding characteristics. PLoS One, 2016, 11 (8), e0161414. [DOI] [PMC free article] [PubMed] [Google Scholar]
- 54. Gratton E., Limkeman M., Lakowicz J. R., Maliwal B. P., Cherek H., Laczko G., Resolution of mixtures of fluorophores using variable-frequency phase and modulation data. Biophys. J., 1984, 46 (4), 479–486. [DOI] [PMC free article] [PubMed] [Google Scholar]
- 55. Lakowicz J. R., Gratton E., Cherek H., Maliwal B. P., Laczko G., Determination of time-resolved fluorescence emission spectra and anisotropies of a fluorophore-protein complex using frequency-domain phase-modulation fluorometry. J. Biol. Chem., 1984, 259 (17), 10967–10972. [PubMed] [Google Scholar]
- 56. Hernandez D. R., DeBord J. D., Ridgeway M. E., Kaplan D. A., Park M. A., Fernandez-Lima F., Ion dynamics in a trapped ion mobility spectrometer. Analyst, 2014, 139 (8), 1913–1921. [DOI] [PMC free article] [PubMed] [Google Scholar]
- 57. Larriba C., Hogan C. J., Ion mobilities in diatomic gases: measurement versus prediction with non-specular scattering models. J. Phys. Chem. A, 2013, 117 (19), 3887–3901. [DOI] [PubMed] [Google Scholar]
- 58. Larriba C., Hogan C. J., Free molecular collision cross section calculation methods for nanoparticles and complex ions with energy accommodation. J. Comput. Phys., 2013, 251, 344–363. [Google Scholar]
- 59. Tsvetkov P. O., Roman A. Y., Baksheeva V. E., Nazipova A. A., Shevelyova M. P., Vladimirov V. I., Buyanova M. F., Zinchenko D. V., Zamyatnin A. A., Devred F., Golovin A. V., Permyakov S. E., Zernii E. Y., Functional status of neuronal calcium sensor-1 is modulated by zinc binding. Front. Mol. Neurosci., 2018, 11 (459), 459–480. [DOI] [PMC free article] [PubMed] [Google Scholar]
- 60. van de Weert M., Fluorescence quenching to study protein-ligand binding: common errors. J. Fluoresc., 2010, 20 (2), 625–629. [DOI] [PubMed] [Google Scholar]
- 61. She M., Dong W. J., Umeda P. K., Cheung H. C., Time-resolved fluorescence study of the single tryptophans of engineered skeletal muscle troponin C. Biophys. J., 1997, 73 (2), 1042–1055. [DOI] [PMC free article] [PubMed] [Google Scholar]
- 62. Gasymov O. K., Glasgow B. J., ANS fluorescence: potential to augment the identification of the external binding sites of proteins. Biochim. Biophys. Acta, 2007, 1774 (3), 403–411. [DOI] [PMC free article] [PubMed] [Google Scholar]
- 63. Morris G. M., Huey R., Lindstrom W., Sanner M. F., Belew R. K., Goodsell D. S., Olson A. J., AutoDock4 and AutoDockTools4: automated docking with selective receptor flexibility. J. Comput. Chem., 2009, 30 (16), 2785–2791. [DOI] [PMC free article] [PubMed] [Google Scholar]
- 64. Liu X. R., Zhang M. M., Gross M. L., Mass spectrometry-based protein footprinting for higher-order structure analysis: fundamentals and applications. Chem. Rev., 2020, 120 (10), 4355–4454. [DOI] [PMC free article] [PubMed] [Google Scholar]
- 65. Zhang J., Li J., Craig T. A., Kumar R., Gross M. L., Hydrogen-deuterium exchange mass spectrometry reveals calcium binding properties and allosteric regulation of downstream regulatory element antagonist modulator (DREAM). Biochemistry, 2017, 56 (28), 3523–3530. [DOI] [PMC free article] [PubMed] [Google Scholar]
- 66. Mills J. S., Johnson J. D., Metal ions as allosteric regulators of calmodulin. J. Biol. Chem., 1985, 260 (28), 15100–15105. [PubMed] [Google Scholar]
- 67. Kirberger M., Yang J. J., Structural differences between Pb2+- and Ca2+-binding sites in proteins: implications with respect to toxicity. J. Inorg. Biochem., 2008, 102 (10), 1901–1909. [DOI] [PMC free article] [PubMed] [Google Scholar]
- 68. Gorkhali R., Huang K., Kirberger M., Yang J. J., Defining potential roles of Pb(2+) in neurotoxicity from a calciomics approach. Metallomics, 2016, 8 (6), 563–578. [DOI] [PMC free article] [PubMed] [Google Scholar]
- 69. Jeromin A., Muralidhar D., Parameswaran M. N., Roder J., Fairwell T., Scarlata S., Dowal L., Mustafi S. M., Chary K. V. R., Sharma Y., N-terminal myristoylation regulates calcium-induced conformational changes in neuronal calcium sensor-1. J. Biol. Chem., 2004, 279 (26), 27158–27167. [DOI] [PubMed] [Google Scholar]
- 70. Lin Y.-F., Cheng C.-W., Shih C.-S., Hwang J.-K., Yu C.-S., Lu C.-H., MIB: metal ion-binding site prediction and docking server. J. Chem. Inf. Model, 2016, 56 (12), 2287–2291. [DOI] [PubMed] [Google Scholar]
- 71. Rulíšek L. R., Vondrášek J., Coordination geometries of selected transition metal ions (Co2+, Ni2+, Cu2+, Zn2+, Cd2+, and Hg2+) in metalloproteins. J. Inorg. Biochem., 1998, 71 (3), 115–127. [DOI] [PubMed] [Google Scholar]
- 72. Ouyang H., Vogel H. J., Metal ion binding to calmodulin: NMR and fluorescence studies. Biometals, 1998, 11 (3), 213–222. [DOI] [PubMed] [Google Scholar]
- 73. Tsvetkov P. O., Roman A. Y., Baksheeva V. E., Nazipova A. A., Shevelyova M. P., Vladimirov V. I., Buyanova M. F., Zinchenko D. V., Zamyatnin A. A. Jr., Devred F., Golovin A. V., Permyakov S. E., Zernii E. Y., Functional status of neuronal calcium sensor-1 is modulated by zinc binding. Front. Mol. Neurosci, 2018, 11, 459–459. [DOI] [PMC free article] [PubMed] [Google Scholar]
- 74. Andrews C., Xu Y., Kirberger M., Yang J. J., Structural aspects and prediction of calmodulin-binding proteins. Int. J. Mol. Sci., 2020, 22 (1), 308. [DOI] [PMC free article] [PubMed] [Google Scholar]
- 75. Dudev T., Grauffel C., Lim C., Calcium in signaling: its specificity and vulnerabilities toward biogenic and abiogenic metal ions. J. Phys. Chem. B, 2021, 125 (37), 10419–10431. [DOI] [PubMed] [Google Scholar]
- 76. Strynadka N. C. J., James M. N. G., Crystal structures of the helix-loop-helix calcium-binding proteins. Annu. Rev. Biochem., 1989, 58 (1), 951–999. [DOI] [PubMed] [Google Scholar]
- 77. Drake S. K., Zimmer M. A., Miller C. L., Falke J. J., Optimizing the metal binding parameters of an EF-hand-like calcium chelation loop: coordinating side chains play a more important tuning role than chelation loop flexibility. Biochemistry, 1997, 36 (32), 9917–9926. [DOI] [PubMed] [Google Scholar]
- 78. Drake S. K., Lee K. L., Falke J. J., Tuning the equilibrium ion affinity and selectivity of the EF-hand calcium binding motif: substitutions at the gateway position. Biochemistry, 1996, 35 (21), 6697–6705. [DOI] [PubMed] [Google Scholar]
- 79. Dudev T., Lim C., Competition among metal ions for protein binding sites: determinants of metal ion selectivity in proteins. Chem. Rev., 2014, 114 (1), 538–556. [DOI] [PubMed] [Google Scholar]
Associated Data
This section collects any data citations, data availability statements, or supplementary materials included in this article.
Supplementary Materials
Data Availability Statement
The data underlying this article are available in the article and in its online supplementary material.