Abstract
BACKGROUND
Cuproptosis has recently been considered a novel form of programmed cell death. To date, long-chain non-coding RNAs (lncRNAs) crucial to the regulation of this process remain unelucidated.
AIM
To identify lncRNAs linked to cuproptosis in order to estimate patients' prognoses for hepatocellular carcinoma (HCC).
METHODS
Using RNA sequence data from The Cancer Genome Atlas Live Hepatocellular Carcinoma (TCGA-LIHC), a co-expression network of cuproptosis-related genes and lncRNAs was constructed. For HCC prognosis, we developed a cuproptosis-related lncRNA signature (CupRLSig) using univariate Cox, lasso, and multivariate Cox regression analyses. Kaplan-Meier analysis was used to compare overall survival among high- and low-risk groups stratified by median CupRLSig risk score. Furthermore, comparisons of functional annotation, immune infiltration, somatic mutation, tumor mutation burden (TMB), and pharmacologic options were made between high- and low-risk groups.
RESULTS
Three hundred and forty-three patients with complete follow-up data were recruited in the analysis. Pearson correlation analysis identified 157 cuproptosis-related lncRNAs related to 14 cuproptosis genes. Next, we divided the TCGA-LIHC sample into a training set and a validation set. In univariate Cox regression analysis, 27 LncRNAs with prognostic value were identified in the training set. After lasso regression, the multivariate Cox regression model determined the identified risk equation as follows: Risk score = (0.2659 × PICSAR expression) + (0.4374 × FOXD2-AS1 expression) + (-0.3467 × AP001065.1 expression). The CupRLSig high-risk group was associated with poor overall survival (hazard ratio = 1.162, 95%CI = 1.063-1.270; P < 0.001) after the patients were divided into two groups depending upon their median risk score. Model accuracy was further supported by receiver operating characteristic and principal component analysis as well as the validation set. The area under the curve of 0.741 was found to be a better predictor of HCC prognosis as compared to other clinicopathological variables. Mutation analysis revealed that high-risk combinations with high TMB carried worse prognoses (median survival of 30 mo vs 102 mo of low-risk combinations with low TMB group). The low-risk group had more activated natural killer cells (NK cells, P = 0.032 by Wilcoxon rank sum test) and fewer regulatory T cells (Tregs, P = 0.021) infiltration than the high-risk group. This finding could explain why the low-risk group has a better prognosis. Interestingly, when checkpoint gene expression (CD276, CTLA-4, and PDCD-1) and tumor immune dysfunction and rejection (TIDE) scores are considered, high-risk patients may respond better to immunotherapy. Finally, most drugs commonly used in preclinical and clinical systemic therapy for HCC, such as 5-fluorouracil, gemcitabine, paclitaxel, imatinib, sunitinib, rapamycin, and XL-184 (cabozantinib), were found to be more efficacious in the low-risk group; erlotinib, an exception, was more efficacious in the high-risk group.
CONCLUSION
The lncRNA signature, CupRLSig, constructed in this study is valuable in prognostic estimation of HCC. Importantly, CupRLSig also predicts the level of immune infiltration and potential efficacy of tumor immunotherapy.
Keywords: Hepatocellular carcinoma, Cuproptosis, Long-chain non-coding RNAs, Prognosis, Tumor microenvironment, Immunotherapy
Core Tip: Factors crucial to the regulation of cuproptosis remain unelucidated. Using transcriptome data from The Cancer Genome Atlas (TCGA-LIHC), we developed a cuproptosis- and prognosis-related long-chain non-coding RNAs signature (CupRLSig) for hepatocellular carcinoma. The high-risk group identified by CupRLSig was associated with poorer overall survival and progression-free survival. Less activation of natural killer cells and more infiltration of regulatory T cells in the high-risk group may explain the worse outcomes. Interestingly, based on checkpoint gene expression (CD276, CTLA-4, and PDCD-1) and tumor immune dysfunction and rejection, high-risk patients may respond better to immunotherapy.
INTRODUCTION
The second most deadly tumor type after pancreatic cancer, liver cancer has a 5-year survival rate of only 18% and a median survival time of just one year[1]. Around 80% of those primary liver tumors are hepatocellular carcinomas (HCC)[2]. Surgery, ablation, and orthotopic liver transplantation remain the most popular locoregional treatment options for HCC[3]. However, as most HCC patients are diagnosed at a late stage in the illness and often have metastases on diagnosis, surgical resection is rarely a viable treatment option. Such patients can only be treated with systemic therapies such as targeted therapies[4]. Despite the availability of several tyrosine kinase inhibitors for first- and second-line treatment, the overall survival (OS) of patients with advanced HCC remains poor owing to drug resistance and has not improved over the past decade[5]. Although the recent approval by the Food and Drug Administration of immune checkpoint inhibitors has transformed the clinical management of HCC, only a small proportion of patients are sensitive to this therapy owing to a lack of relevant selective biomarkers[6]. As a result, there is a pressing necessity to investigate novel treatment modalities and biomarkers in order to improve patient outcomes.
Levels of copper, including the complex form of ceruloplasmin, are significantly elevated in serum and tumors of cancer patients[7]. Excess copper acts as a powerful oxidant, promoting the intracellular production of reactive oxygen species (ROS) and apoptosis[8]. Malignant cells naturally possess higher basal ROS levels compared with normal cells[8] as they use mechanisms such as compensatory upregulation of the NRF2 gene to counter increases in ROS resulting from copper accumulation[2]. Thus, utilization of the altered copper distribution to generate an intolerable increase in ROS stress in malignant cells warrants consideration as a potential anticancer strategy[7]. Prior to the clinical utilization of spatial copper distribution for cancer treatment, however, the genes involved in copper metabolism and their regulatory networks must be elucidated. For example, alterations in copper bioavailability in KRAS-mutant tumors have been investigated in preclinical studies[9]. Copper has a dual function, being an essential enzyme cofactor but also producing toxicity that causes cell death. Thus, copper has been proposed as a new therapeutic target for use in strategies to specifically kill cancer cells by increasing intracellular copper accumulation[10,11]. Recently, researchers found that some cancer cells die when carrier molecules such as FDX1 import substantial levels of copper into the cytoplasm[12]. By blocking alternative cell death pathways, this was proved to be a specific type of cell death; further research revealed that cells more reliant on mitochondria for energy production were more sensitive to this copper-induced death, which was named cuproptosis[12]. Lipid acylation, a major target of cuproptosis for cytotoxicity, is widespread and conserved in nature[11]. This metabolic profile indicates the promise of copper-ion-targeted therapies for tumors. There is thus an urgent need for methods for reliable and accurate detection of biomarkers of cuproptosis in human tumor tissues.
Long non-coding RNAs (lncRNAs) are involved in a variety of biological processes. Several HCC-related lncRNAs have been discovered to be deregulated in tumor tissues and to play critical roles in shaping the tumor microenvironment via epigenetic regulation[13]. Similarly, lncRNAs have been reported to have crucial roles in the regulation of metabolism of metal ion homeostasis. Some 2564 LncRNAs were found to be significantly upregulated, whereas 1052 were downregulated, in a recently constructed toxic milk mouse model of Wilson’s disease (WD), which is characterized by a mutation of the ATP7B gene that affects copper transport[14]. The cytosolic lncRNA P53RRA was found to displace p53 from the G3BP1-p53 complex, resulting in increased intranuclear p53 retention and manifestation of ferroptosis, another ion-induced form of programmed cell death[15]. Although the mechanism characterizing the lncRNA-mediated epigenetic regulation of ferroptosis has been widely investigated[16], the lncRNA regulatory network associated with cuproptosis remains almost completely unknown. Given that lncRNAs play a role in a variety of biological processes, such as ferroptosis, they are highly likely to be involved in the regulation of cuproptosis. Thus, identification of transcriptional changes in lncRNAs will be critical for the characterization of cuproptosis and for determining its relevance in malignancy.
Here, we developed a cuproptosis-related lncRNA signature (CupRLSig) and demonstrated its ability to predict prognosis of HCC patients. Furthermore, we constructed a nomogram based on CupRLSig as well as a number of clinical features and compared gene enrichment, mutations, immune cell infiltration, and potential responses to targeted therapy and immunotherapy between CupRLSig-defined high- and low-risk groups. This study provides insight into the cuproptosis regulatory network, the understanding of which is critical for improving the efficacy of individualized HCC treatment.
MATERIALS AND METHODS
Dataset and sample extraction
RNA-sequencing data (RNA-seq), clinical characteristics, and mutation data of HCC patients were obtained from The Cancer Genome Atlas-Live Hepatocellular Carcinoma Database (TCGA-LIHC, https://portal.gdc.cancer.gov/). Initially, data from 424 HCC patients were collected. Patients with incomplete follow-up data or survival < 30 d and those lacking complete clinicopathological data were excluded from follow-up analysis; 343 patients were ultimately included. The 19 cuproptosis-related genes, listed in Supplementary Table 1, were obtained from the available literature[2,9,12,17-19] reporting findings of gene manipulation studies, and are genes that were found to either induce or inhibit cuproptosis. The present study was conducted in accordance with the Declaration of Helsinki as revised in 2013.
Identification of CupRLSig for prediction of HCC patient prognosis
Based on gene names, transcriptional expression profile data were classified as lncRNA or mRNA, and lncRNAs associated with 19 cuproptosis-related genes (mRNAs) were identified using the “limma” R package and the Pearson correlation test. The absolute value of the Pearson correlation coefficient (> 0.4) and P < 0.05 were used as thresholds for the establishment of a cuproptosis-related mRNA-lncRNA co-expression network to identify lncRNAs relevant in cuproptosis. The network was visualized using a Sankey diagram generated by the R software package “ggalluvial.” The entire TCGA-LIHC sample was subsequently randomly divided into a training group and a validation group (Table 1); univariate Cox regression analysis was used to determine whether these lncRNAs were associated with patient prognosis in the training group. Lasso regression analysis was also performed to avoid over-fitting and eliminate tightly correlated genes. The minimal penalty term (lambda) was chosen using ten-fold cross-validation. The aforementioned lncRNAs were subsequently used to construct a multivariate Cox regression model and determine correlation coefficients. The following formula was used to calculate risk scores based on the model: risk score = explncRNA1 × coef lncRNA1 + explncRNA2 × coef lncRNA2 + ... + explncRNAi × coef lncRNAi. We termed this predictive lncRNA signature CupRLSig. Risk scores were calculated for all patients in the training set, test set, and entire TCGA-LIHC set, and According to the median risk score in the training group, HCC samples from all three datasets were split into high- and low-risk groups. The CupRLSig model was tested using Kaplan-Meier curves, risk curves, survival status analyses, and heatmap analyses to see if it could effectively identify patients with different risk levels. The accuracy of the model was quantified using progression-free survival (PFS) analysis, the concordance index (C-index), independent prognostic analysis, and receiver operating characteristic (ROC) curves. The R software package “pheatmap” was used to visualize clinicopathological variables in the high- and low-risk groups from the entire TCGA-LIHC sample set; the distribution of patients with varying risk scores was evaluated using principal component analysis (PCA) and visualized using the R software package “scatterplot3d.” Finally, stratified analyses were performed using various pathological parameters to determine whether the model’s distinction between high- and low-risk groups significantly correlated with other clinical parameters.
Table 1.
Clinical characteristics of The Cancer Genome Atlas Live Hepatocellular Carcinoma sample training and test groups (n = 343)
|
Covariates
|
Sub type
|
Entire TCGA-LIHC, n (%)
|
Test group, n (%)
|
Training group, n (%)
|
P
value
|
| Age (yr) | ≤ 65 | 216 (62.97) | 103 (60.23) | 113 (65.70) | 0.3493 |
| > 65 | 127 (37.03) | 68 (39.77) | 59 (34.30) | ||
| Gender | Female | 110 (32.07) | 59 (34.50) | 51 (29.65) | 0.3971 |
| Male | 233 (67.93) | 112 (65.50) | 121 (70.35) | ||
| Grade | G1 | 53 (15.45) | 27 (15.79) | 26 (15.12) | 0.3 |
| G2 | 161 (46.94) | 85 (49.71) | 76 (44.19) | ||
| G3 | 112 (32.65) | 54 (31.58) | 58 (33.72) | ||
| G4 | 12 (3.50) | 3 (1.75) | 9 (5.23) | ||
| Unknown | 5 (1.46) | 2 (1.17) | 3 (1.74) | ||
| Stage | Stage I | 161 (46.94) | 81 (47.37) | 80 (46.51) | 0.9079 |
| Stage II | 77 (22.45) | 39 (22.81) | 38 (22.09) | ||
| Stage III | 80 (23.32) | 38 (22.22) | 42 (24.42) | ||
| Stage IV | 3 (0.87) | 2 (1.17) | 1 (0.58) | ||
| Unknown | 22 (6.41) | 11 (6.43) | 11 (6.40) | ||
| T | T1 | 168 (48.98) | 86 (50.29) | 82 (47.67) | 0.5683 |
| T2 | 84 (24.49) | 42 (24.56) | 42 (24.42) | ||
| T3 | 75 (21.87) | 37 (21.64) | 38 (22.09) | ||
| T4 | 13 (3.79) | 4 (2.34) | 9 (5.23) | ||
| Unknown | 3 (0.87) | 2 (1.17) | 1 (0.58) | ||
| M | M0 | 245 (71.43) | 118 (69.01) | 127 (73.84) | 0.9551 |
| M1 | 3 (0.87) | 2 (1.17) | 1 (0.58) | ||
| Unknown | 95 (27.70) | 51 (29.82) | 44 (25.58) | ||
| N | N0 | 239 (69.68) | 111 (64.91) | 128 (74.42) | 0.9081 |
| N1 | 3 (0.87) | 2 (1.17) | 1 (0.58) | ||
| Unknown | 101 (29.45) | 58 (33.92) | 43 (25.00) |
T: Tumor; N: Lymph node; M: Metastasis. The P value is indicated for the chi-square test and Kruskal-Wallis test among the three groups.
Construction of the nomogram
A nomogram was constructed using the R software packages “rms” and “regplot” for the prediction of HCC patient survival at 1, 3, and 5 years based on a combination of the risk score with other clinicopathological data. Calibration curves were used to evaluate whether the predicted survival rates were consistent with actual survival rates. A patient was randomly selected to confirm the predictive utility of the nomogram.
Analysis of functional enrichment of genes and lncRNAs with differential expression in different-risk CupRLSig groups
Differentially expressed genes and lncRNAs between the high- and low-risk CupRLSig groups were identified using the R software package “limma” with the criteria of log2 fold change absolute value greater than 1 and false discovery rate less than 0.05. Functional enrichment analysis of the differentially expressed genes and lncRNAs was then performed using the Gene Ontology (GO) and the Kyoto Encyclopedia of Genes and Genomes (KEGG) databases.
Analysis of somatic mutation data and TMB
The number of somatic non-synonymous point mutations in each sample was counted and visualized using the R software package “maftools”[20]. The TMB was calculated as the number of somatic, coding, base replacement, and insert-deletion mutations discovered per megabase of genome using non-synonymous and code-shifting indels with a 5% detection limit. In addition, TMB was compared between the high- and low-risk groups, and survival curves for TMB and risk score integration were plotted.
Estimation of immune infiltration
The CIBERSORT algorithm[21] was used to estimate the infiltration proportions of 22 immune cell types in HCC samples. The proportions of immune cells in different groups were compared using the Wilcoxon rank-sum test. Single-sample gene set enrichment analysis was performed using the R software package “GSVA”[22] to assess the activity of 13 immune-related functions and compare differences between the two groups.
Potential relationships of CupRLSig with immunotherapy, chemotherapy, and target therapy
First, differential expression of 47 immune checkpoint genes in the CupRLSig high- and low-risk groups was compared. The tumor immune dysfunction and exclusion (TIDE, http://tide.dfci.harvard.edu/) module was used to distinguish potential immunotherapy responses between groups. This module predicts anti-PD1 and anti-CTLA4 treatment response based on patients’ pre-treatment genome transcriptional expression profiles. The role of CupRLSig in predicting the therapeutic response of HCC was further evaluated by calculation of the half-maximal inhibitory concentration (IC50) values of drugs commonly used for chemotherapy and targeted therapy. The Wilcoxon signed-rank test and R software package “pRRophetic” were used to compare and visualize IC50 values in the high- and low-risk groups.
Statistical analysis
The Kaplan-Meier method were used to compare OS and PFS of different groups of patients. The R “survivalROC” package was used to construct ROC curves and calculate the area under the curve (AUC). The Kruskal-Wallis test was used to compare differences between groups, and clinical data were analyzed using either chi-squared or Fisher’s exact tests. Relationships between lncRNA expression, immune infiltration, and immune checkpoint gene expression were assessed using Spearman or Pearson correlation coefficients. All statistical analyses were performed using R software (version 4.1.2); a P value < 0.05 was considered to indicate statistical significance. The statistical methods used in this study were reviewed by Dr. GanFeng Luo from the Department of Epidemiology and Health Statistics, School of Public Health, Sun Yat-sen University.
RESULTS
Characteristics of the datasets and construction of the CupRLSig model
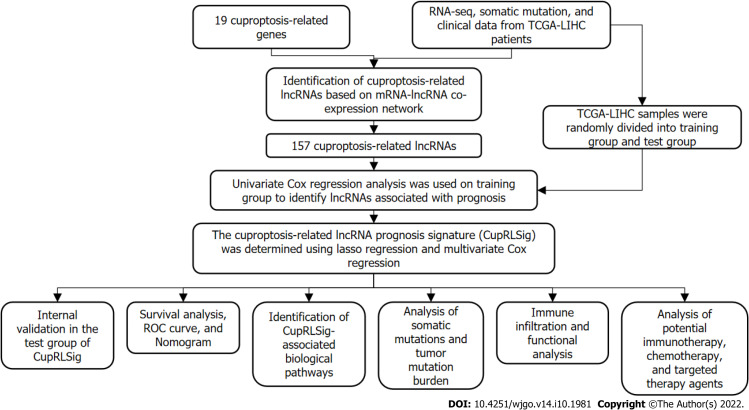
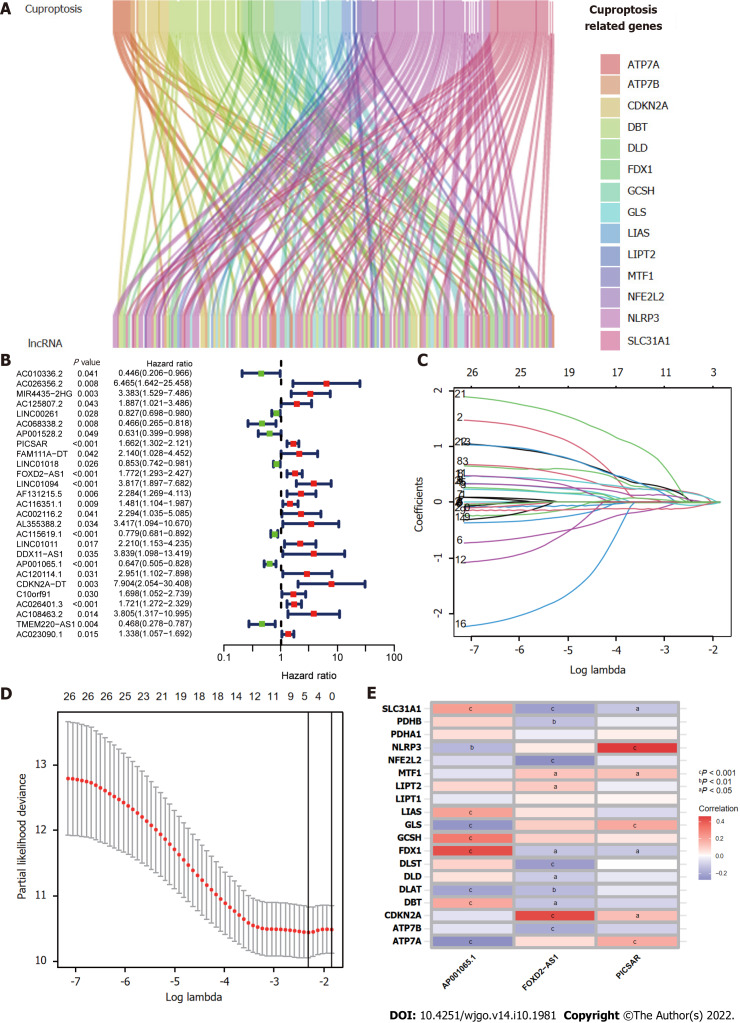
Figure 1 presents a flow chart of the present study. First, Pearson correlation analysis identified 157 cuproptosis-related lncRNAs related to 14 cuproptosis genes, with correlation coefficient > 0.4 and P < 0.05 (Figure 2A and Supplementary Table 2). We collected 343 samples with complete clinicopathological data from the TCGA-LIHC database. The samples and data were from 233 males and 110 females, 224 of whom were still alive. The age of HCC patients ranged from 16 to 90 years, and their survival after diagnosis ranged from 30 to 3675 d. More detailed characteristics are shown in Table 1.
Figure 1.
Study flowchart. RNA-seq: RNA sequencing; TCGA-LIHC: The Cancer Genome Atlas-Live Hepatocellular Carcinoma; lncRNAs: Long non-coding RNAs; ROC: Receiver operating characteristic.
Figure 2.
Construction of the cuproptosis-related long-chain non-coding RNA signature (CupRLSig) model. A: Sankey diagram showing the associations between cuproptosis-related long-chain non-coding RNAs (lncRNAs) and mRNAs; B: Forest plot showing 27 LncRNAs with hazard ratios (95% confidence intervals) and P values for association with HCC prognosis based on univariate Cox proportional-hazards analysis; C: Lasso coefficient profiles; D: Selection of the tuning parameter (lambda) in the Lasso model by ten-fold cross-validation based on minimum criteria for overall survival; E: Heatmap showing the correlations of the three lncRNAs incorporated into the cuproptosis-related long-chain non-coding RNA signature model (CupRLSig) model and 19 cuproptosis-related genes. aP < 0.05; bP < 0.01; cP < 0.001.
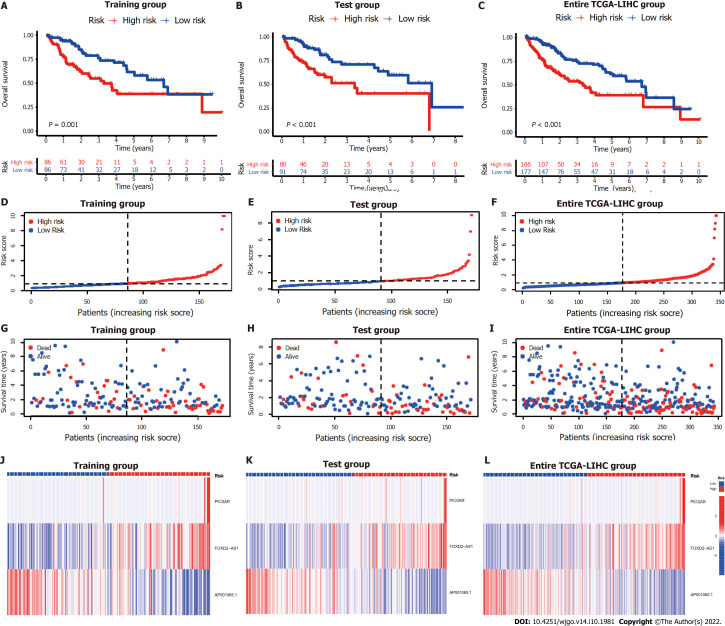
The entire TCGA-LIHC sample was subsequently randomly divided into a training group and a validation group (Table 1). Univariate Cox regression analysis revealed a total of 27 LncRNAs that had prognostic significance in the training group (Figure 2B). Following Lasso regression analysis (Figure 2C and D), three lncRNAs in the training group were retained and used to construct a multivariate Cox regression model. The correlations between these three lncRNAs (collectively termed CupRLSig) and the 19 cuproptosis-related genes are shown in Figure 2E. A formula for the CupRLSig risk score was established as follows: risk score = (0.2659 × PICSAR expression) + (0.4374 × FOXD2-AS1 expression) + (-0.3467 × AP001065.1 expression). Based on the median risk score in the training group, patients were divided into two risk groups using this formula. Finally, 86, 80, and 166 patients from the training, test, and entire set, respectively, were assigned to the high-risk group; and 86, 91, and 177 patients were assigned to the low-risk group (Figure 3A-C). Kaplan-Meier analysis revealed a significantly shorter OS in the high-risk group compared with the low-risk group for both datasets (Figure 3A-C). Individual patient risk scores and survival statistics are detailed in Figure 3D-I; notably, the risk score rose along with the number of deaths. The expression status of the three lncRNAs in each group is detailed in Figure 3J-L.
Figure 3.
Internal validation of cuproptosis-related long-chain non-coding RNA signature (CupRLSig) model for determination of overall survival in training, test, and entire The Cancer Genome Atlas-Live Hepatocellular Carcinoma groups. A-C: Kaplan-Meier survival curves in the high- and low-risk groups stratified by median CupRLSig risk scores for overall survival in the training set (A), test set (B), and entire The Cancer Genome Atlas-Live Hepatocellular Carcinoma (TCGA-LIHC) dataset (C); P values were determined using the log-rank test; D-F: Risk curves were based on the risk score for each sample in the training (D), test (E), and entire TCGA-LIHC (F) sets, where red and blue dots indicate high- and low-risk samples, respectively; G-I: The scatter plot was based on the survival status of each sample from the training (G), test (H), and entire TCGA-LIHC (I) sets, where red and blue dots indicate death and survival, respectively; J-L: Heatmaps detailing the expression levels of the three cuproptosis-related long-chain non-coding RNA (lncRNA) signature (CupRLSig) lncRNAs in each group. TCGA-LIHC: The Cancer Genome Atlas-Live Hepatocellular Carcinoma.
Evaluation of the accuracy of the CupRLSig model
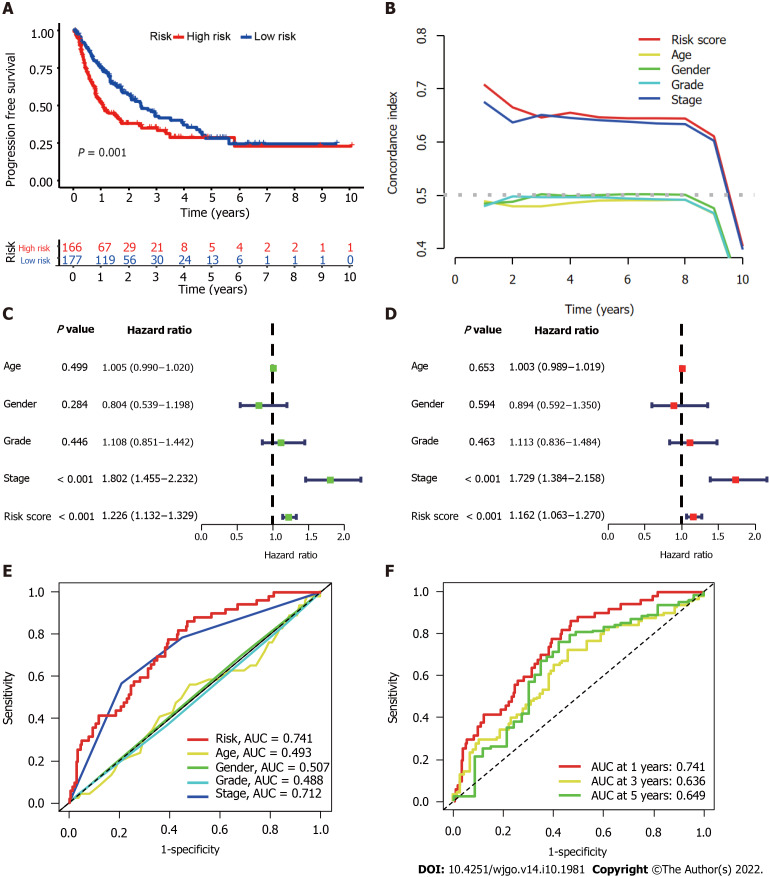
We further evaluated the PFS of 343 HCC patients using data downloaded from http://xena.ucsc.edu/ to assess the prediction accuracy of our CupRLSig prognostic model among HCC patients. High-risk patients were noted to have significantly shorter PFS (P = 0.001; Figure 4A). According to the C-index values, the model’s prognostic prediction performance was comparable with that of disease stage (Figure 4B). Univariate and multivariate Cox regression analyses revealed CupRLSig risk score to be an independent prognostic factor (Figure 4C and D); its AUC of 0.741 indicated that it was a better predictor of HCC prognosis than other clinicopathological variables (Figure 4E). The 1-, 3-, and 5-year ROC AUCs were 0.741, 0.636, and 0.649, respectively, indicating that CupRLSig exhibited good prognostic performance (Figure 4F).
Figure 4.
Evaluation of predictive accuracy of the cuproptosis-related long-chain non-coding RNAs signature (CupRLSig) model using the entire The Cancer Genome Atlas-Live Hepatocellular Carcinoma dataset. A: Kaplan-Meier curves for progression-free survival in high- and low-risk groups stratified by median value of cuproptosis-related long-chain non-coding RNAs signature (CupRLSig) risk score; B: Concordance index curves depicting CupRLSig risk scores and other clinical parameters relevant to predicting hepatocellular carcinoma patient prognosis; C and D: Forest plots for univariate (C) and multivariate (D) Cox proportional-hazards analysis for determination of the independent prognostic value of the CupRLSig risk score; E: Area under the curve (ROC) curves for the CupRLSig risk score and other clinicopathological variables; F: Time-dependent ROC curves for 1-, 3-, and 5-year survival for the CupRLSig signature. ROC: Receiver operating characteristic; AUC: Area under the curve.
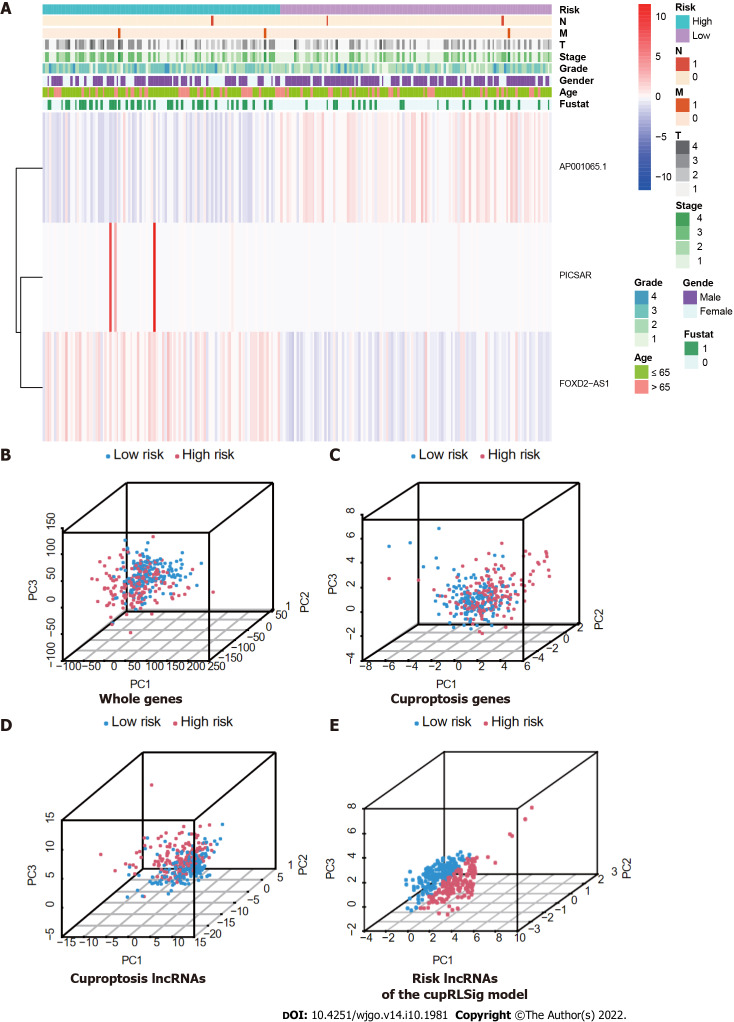
Expression levels of the three lncRNAs from the CupRLSig model, as well as clinicopathological factors, are detailed in Figure 5A. PCA was performed for whole genes, cuproptosis-related genes, cuproptosis-related lncRNAs, and risk-related lncRNAs from the CupRLSig model to determine their ability to distinguish between high- and low-risk patients (Figure 5B-E). The CupRLSig (Figure 5E) model was found to effectively distinguish between patients in the low- and high-risk groups, underscoring the accuracy of the model.
Figure 5.
Visualization of expression levels of the three component long-chain non-coding RNAs of the cuproptosis-related long-chain non-coding RNA signature (CupRLSig) model based on clinicopathological variable stratification and principal component analysis of different gene sets performed for classification of patient risk. A: Heatmaps of expression of the three long-chain non-coding RNAs (lncRNAs) and clinical characteristics for different risk groups; B-E: PCA of low- and high-risk groups based on (B) whole-genome genes, (C) cuproptosis-related genes, (D) cuproptosis-related lncRNAs, and (E) cuproptosis-related lncRNA signature (CupRLSig) model risk lncRNAs. Patients with high risk scores are denoted by red, while those with low risk scores are denoted by blue. N: Lymph node metastasis; M: Mistant metastasis; T: Tumor.
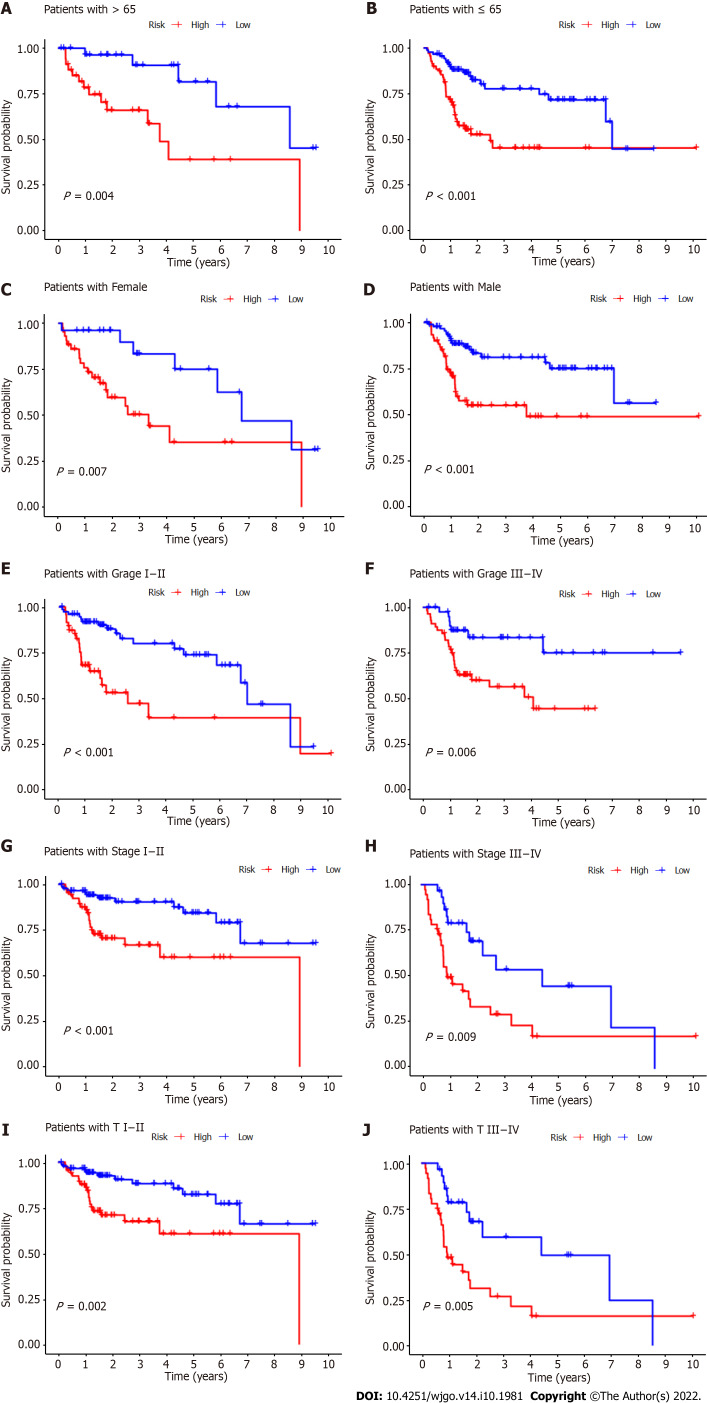
Subgroup analysis was also performed to determine whether CupRLSig had prognostic value in subgroups with different clinicopathological parameters (Figure 6). Risk score showed significant correlations with age (Figure 6A and B), sex (Figure 6C and D), tumor grade (Figure 6E and F), tumor stage (Figure 6G and H), and T stage (Figure 6I and J) in the assessment of correlations among risk score and clinicopathological factors. The numbers of cases in the M and N stage subgroups were too small for evaluation. Overall, the CupRLSig risk score was found to be an independent prognostic risk factor in HCC patients.
Figure 6.
Kaplan-Meier survival curves for high- and low-risk patient groups sorted by clinicopathological variables. A and B: Age; C and D: Sex; E and F: Grade; G and H: Overall stage; I and J: T stage. T: Tumor.
Construction of a predictive nomogram
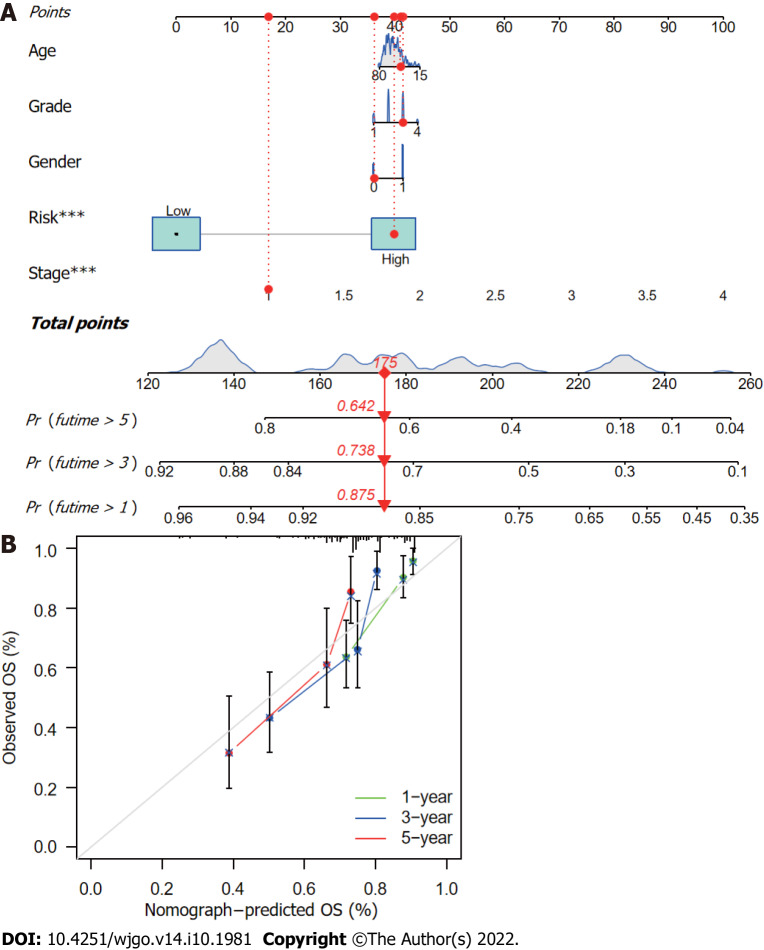
The CupRLSig risk score, in combination with other clinicopathological factors, was used to develop a nomogram to guide clinical assessment of prognosis and estimate 1-, 3-, and 5-year survival probability of HCC patients (Figure 7A). Patient 53 was randomly chosen for evaluation of the predictive utility of the nomogram. As shown in Figure 7A, the risk score of this patient was 175 points; the 5-year survival rate was 0.642, the 3-year survival rate was 0.738, and the 1-year survival rate was 0.875. The nomogram was found to accurately estimate mortality (Figure 7B).
Figure 7.
Nomogram construction and verification. A: Nomogram combining clinicopathological parameters and risk scores to predict 1-, 3-, and 5-year survival probabilities of hepatocellular carcinoma (HCC) patients. Multivariate Cox proportional-hazards analysis was used to determine each parameter’s independent prognostic value. Red dots, diamonds, triangles, and dashed lines represent the 53rd patient, randomly selected for illustration of the nomogram; B: Calibration curves to assess the consistency between actual observed and nomogram-predicted overall survival (OS) at 1-, 3-, and 5-years.
Identification of biological pathways linked to CupRLSig
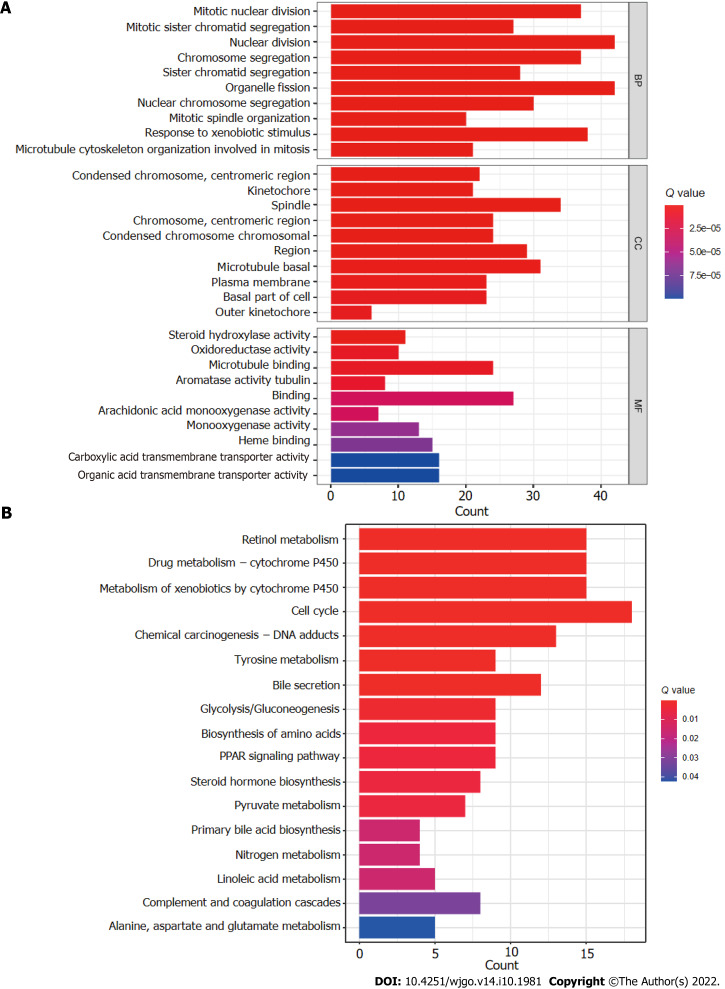
The R software “enrichplot” package was used for gene set functional annotation of differentially expressed genes and lncRNAs (n = 523, Supplementary Table 3) among the high- and low-risk HCC groups. The five biological processes with the highest enrichment according to GO analysis were mitotic nuclear division, mitotic sister chromatid segregation, nuclear division, chromosome segregation, and sister chromatid segregation (Figure 8A). The five cellular components with the highest enrichment were condensed chromosomes, kinetochores, spindle, chromosomes, and condensed chromosomes (Figure 8A). Finally, the most enriched molecular functions were steroid hydroxylase activity, oxidoreductase activity, microtubule binding, aromatase activity, and tubulin binding (Figure 8A). The five most enriched KEGG pathways were retinol metabolism, cytochrome P450 drug metabolism, cytochrome P450 xenobiotic metabolism, the cell cycle, and chemical carcinogenesis-DNA adducts (Figure 8B).
Figure 8.
Gene set functional annotation of differentially expressed genes and long-chain non-coding RNAs in high- and low-risk hepatocellular carcinoma groups. A: In gene ontology analysis, differentially expressed genes and long-chain non-coding RNAs (lncRNAs) were found to be most enriched in biological process terms mitotic nuclear division, mitotic sister chromatid segregation, nuclear division, chromosome segregation, and sister chromatid segregation; in cellular component terms condensed chromosomes, kinetochores, spindles, chromosomes, and condensed chromosomes; and in molecular function terms steroid hydroxylase activity, oxidoreductase activity, microtubule binding, aromatase activity, and tubulin binding; B: Differentially expressed genes and lncRNAs were found to be most enriched in the following five Kyoto Encyclopedia of Genes and Genomes (KEGG) pathways: retinol metabolism, cytochrome P450 drug metabolism, cytochrome P450 xenobiotic metabolism, cell cycle, and chemical carcinogenesis-DNA adducts. BP: Biological process; CC: Cellular component; MF: Molecular function.
Relationships of CupRLSig risk score with somatic mutation and TMB
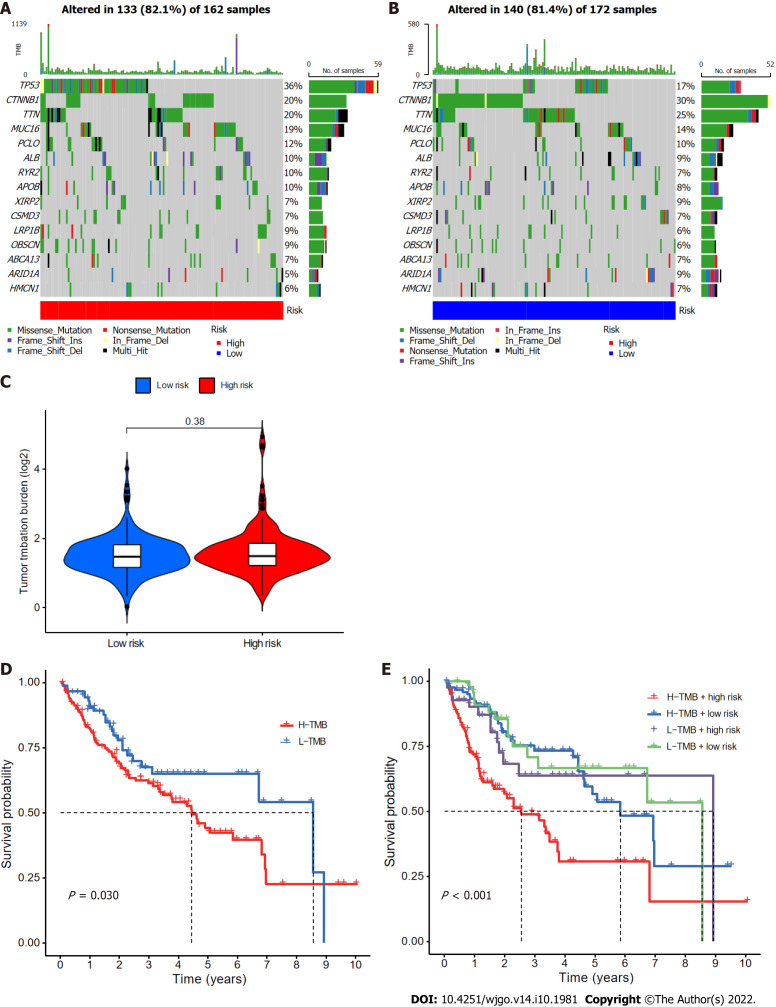
Somatic mutations in patients in the low- and high-risk subgroups were assessed separately (Figure 9A and B); TP53 (36% vs 17%) had a higher rate of somatic mutation in the high-risk group than the low-risk group, whereas CTNNB1 (30% vs 20%) and TTN (25% vs 20%) had higher rates of somatic mutation in the low-risk group. Furthermore, although no difference in TMB between the two groups (Figure 9C) was found, the survival time of patients with higher TMB was significantly reduced (Figure 9D). High TMB in high-risk group patients led to an even worse prognosis (Figure 9E), highlighting a significant synergistic effect between these two indicators.
Figure 9.
Relationships between cuproptosis-related long-chain non-coding RNA signature (CupRLSig) risk scores and somatic mutation and tumor mutation burden. A and B: Waterfall plots showing somatic mutations of the most significant 15 genes among high-risk (A) and low-risk (B) hepatocellular carcinoma (HCC) patients; C: Comparison of tumor mutation burden (TMB) between low- and high-risk subgroups; D: Kaplan-Meier curves for high- and low-TMB groups; E: Kaplan-Meier curves for subgroup analyses of patients stratified by TMB and risk score. The P value is representative of the results of the analysis of variance test among subgroups.
Immune infiltration in different risk subgroups
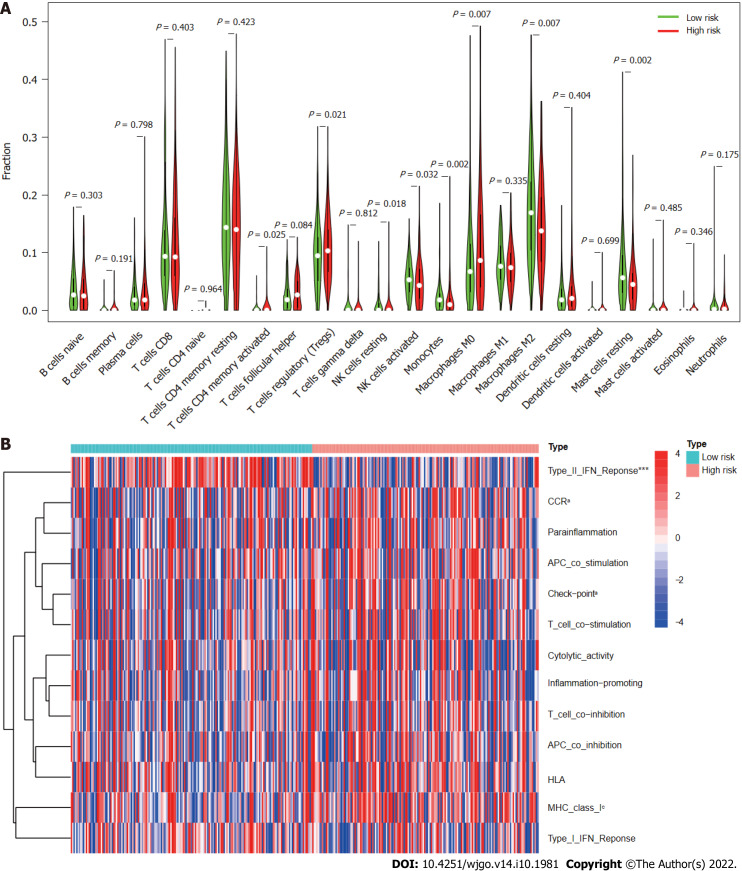
According to analysis using the CIBERSORT algorithm, the infiltration ratios of M2 macrophages (P = 0.007), resting mast cells (P = 0.002), monocytes (P = 0.002), and activated NK cells (P = 0.032) in the low-risk group were significantly higher than those in the high-risk group (Figure 10A). Ratios of resting NK cells (P = 0.018), regulatory T cells (Tregs; P = 0.021), CD4 memory activated T cells (P = 0.025), and M0 macrophages (P = 0.007) exhibited the opposite pattern (Figure 10A). Scores for immune functions including C-C chemokine receptor, check points, and major histocompatibility complex class I were significantly higher in high-risk group patients than in those in the low-risk group, although response to interferon type II exhibited the opposite pattern (Figure 10B). These findings reveal differences in immune infiltration between the two groups. As immunotherapy is understood to depend on the existence of a “hot” immune microenvironment[23], such differences highlight the potential of immunotherapy.
Figure 10.
Immune cell infiltration and immune-related functions in different risk groups. A: Violin plot showing whether there were significant differences in immune infiltration among 22 types of cells between high- and low-risk subgroups; B: Heatmap showing whether there were significant differences in 13 immune-related functions between high- and low-risk subgroups. NK: Natural killer; CCR: C-C chemokine receptor; APC: Antigen-presenting cell; HLA: Human leukocyte antigen; MHC: Major histocompatibility complex; IFN: Interferon. aP < 0.05; cP < 0.001.
Potential relationships of CupRLSig with immunotherapy, chemotherapy, and targeted therapy in HCC
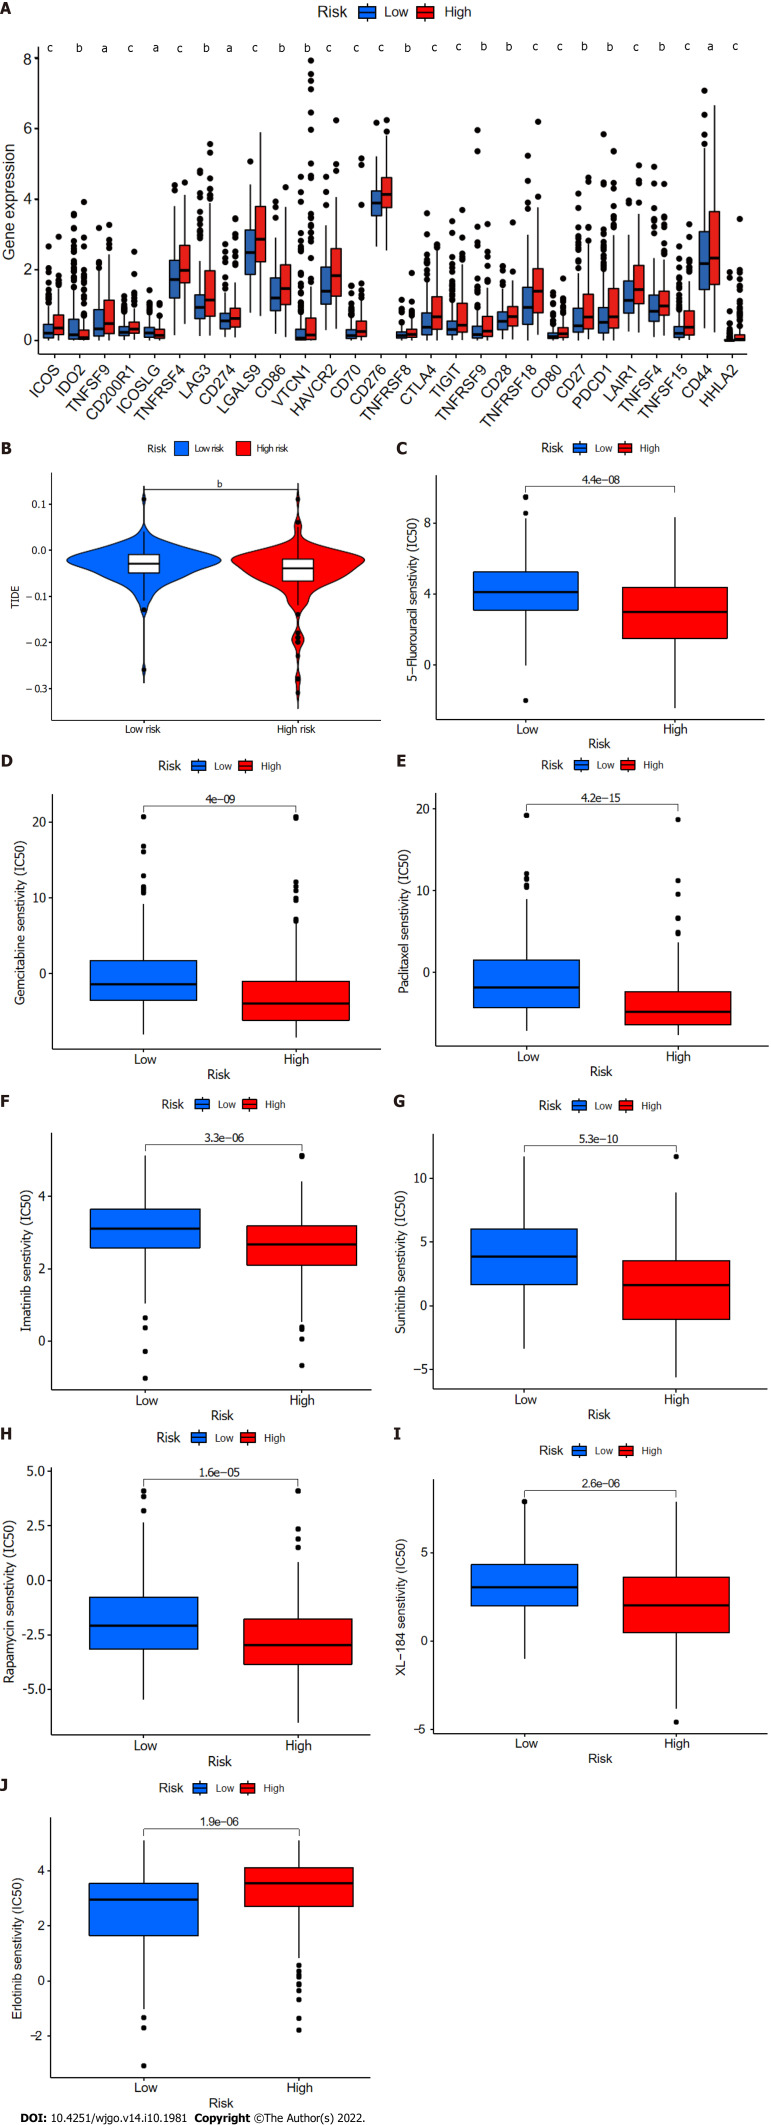
Twenty-eight of a total of 47 immune checkpoint genes evaluated were found to differ in terms of expression levels between the high- and low-risk groups (Figure 11A). Immunotherapy markers including CD276, CTLA-4, and PDCD-1, which are currently in widespread clinical use, were found to have markedly elevated expression in the high-risk group (Figure 11A), implying potential immunotherapeutic responses in high-risk patients. Moreover, when the online software TIDE was used to predict the outcomes of cancer patients treated with anti-PD1 or anti-CTLA4 therapies, higher TIDE scores were found in the low-risk group compared with the high-risk group (Figure 11B). Importantly, a higher TIDE score suggests a greater likelihood of tumor immune escape and a poorer response to immunotherapy. Based on the results for immune infiltration, checkpoint gene expression, and TIDE score, HCC patients with high cuproptosis-related risk scores are likely to respond better to immunotherapy.
Figure 11.
Comparison of immune checkpoints, tumor immune dysfunction, and exclusion module scores, and chemotherapy and targeted therapy drug efficacy in high- and low-risk groups. A: Expression of 28 immune checkpoint genes differed between the high- and low-risk groups. Red and blue boxes represent high- and low-risk patients, respectively; B: Online software tumor immune dysfunction (TIDE) predictions of outcomes in HCC subgroups treated with either anti-PD1 or anti-CTLA4 therapy. A higher TIDE score suggests a greater likelihood of tumor immune escape and a poorer response to immunotherapy; C-J: IC50 values for (C) 5-fluorouracil, (D) gemcitabine, (E) paclitaxel, (F) imatinib, (G) sunitinib, (H) rapamycin, (I) XL-184 (cabozantinib), and (J) erlotinib in high- and low-risk groups. IC50, half-maximal inhibitory concentration. aP < 0.05; bP < 0.01; cP < 0.001. NS: Not significant.
Finally, the relationships between CupRLSig risk score and the efficacies of chemotherapy and targeted therapy for HCC were evaluated. Most drugs commonly used in preclinical and clinical systemic therapies for HCC, including 5-fluorouracil (Figure 11C), gemcitabine (Figure 11D), paclitaxel (Figure 11E), imatinib (Figure 11F), sunitinib (Figure 11G), rapamycin (Figure 11H), and XL-184 (cabozantinib, Figure 11I) were found to be more efficacious in the low-risk group; erlotinib (Figure 11J), an exception, was more efficacious in the high-risk group. Our findings highlight the potential of CupRLSig for future clinical development of personalized treatment strategies.
DISCUSSION
Widespread hepatitis B vaccination in China has led to a gradual decline in the incidence of HCC, from 29.2/100000 in 1998 to 21.9/100000 in 2012[24]. However, the prognosis of HCC patients remains poor, in large part owing to a lack of therapeutic and prognostic biomarkers. Markers currently considered in clinical practice, such as alpha fetoprotein (AFP), can be used as diagnostic markers or for monitoring recurrence, but they do not provide treatment or prognostic data[25]. The combination of several biomarkers into a single model improves both therapeutic and prognostic prediction accuracy compared with a single biomarker[26].
Serum and tissue copper levels are known to be elevated in various malignancies, with this elevation being directly related to cancer progression[7]. As such, we hypothesized that abnormal expression of genes relevant to the copper metabolism pathway could serve as prognostic and therapeutic markers in HCC. Cuproptosis, a form of programmed cell death recently shown to result from the binding of accumulated intracellular copper to aliphatic components of the tricarboxylic acid cycle, causes aggregation of lipoacylated proteins and loss of iron-sulfur cluster proteins[12]. Although many pivotal genes in cuproptosis have been identified, the overall regulatory landscape of this process in HCC remains unclear. Here, we incorporated three cuproptosis-related lncRNAs into a CupRLSig signature capable of addressing both cuproptosis and HCC prognosis.
The ROC curves indicated that CupRLSig showed adequate predictive utility for the evaluation of OS of HCC patients. Additionally, our novel nomogram has the potential to direct the formulation of therapeutic approaches and enhance clinical decision-making. Both FOXD2-AS1 and PICSAR (components of the CupRLSig model) have been previously identified as oncogenes in HCC; FOXD2-AS1 aggravates HCC tumorigenesis by regulating the miR-206/MAP3K1 axis[27], whereas PICSAR accelerates disease progression by regulating the miR-588/PI3K/AKT/mTOR axis[28]. However, there has been a lack of research on the prognostic value of AP001065.1 and the extent of its involvement in cuproptosis; further study of this lncRNA is warranted.
This study also explored the important relationship between cuproptosis and treatment decisions in the management of HCC. Endogenous oxidative stress levels are known to be elevated in a variety of tumors, probably owing to a combination of active metabolism, mitochondrial mutations, cytokine activity, and inflammation[7]. Under constant oxidative stress, cancer cells tend to make extensive use of adaptive mechanisms and may deplete the intracellular ROS buffer capacity[7]. Thus, increased copper levels in cancer cells, as well as the resulting increase in oxidative stress, facilitate a novel cancer-specific therapeutic strategy. The liver is the most important organ for copper metabolism, with the biliary tract excreting 80% of copper ions[29]. The induction of cuproptosis in the setting of HCC thus offers a basis for effective management of this illness. The design of preclinical studies of this concept first requires a detailed understanding of the expression of regulatory genes of the cuproptosis pathway in HCC. A study using a WD mouse model revealed that ATP7B-deficient hepatocytes, such as those found in WD patients, activated autophagy in response to copper overload to prevent copper-induced apoptosis[17]. Inhibition of the autophagy pathway, and consequent further copper overload and elevated ROS, is thus likely to activate the cuproptosis pathway and lead to the death of copper-rich tumor cells. Notably, the efficacy of chemotherapeutic agents designed to induce ROS, such as paclitaxel, differed between patients in the high- and low-risk groups as defined by the CupRLSig model. The CupRLSig model was also shown to have a relationship with the HCC immune microenvironment. According to CupRLSig stratification, expression of most immune checkpoints, activation of immune pathways, and infiltration of immune cells were higher in the high-risk group compared with the low-risk group, while TIDE score showed the opposite pattern. These findings suggest that high-risk patients have more to benefit from immunotherapy. Taken together, these results confirm that CupRLSig has potential utility as an adjunctive selection tool for pharmacotherapy.
There were several limitations to this study. First, only TCGA datasets were used. Use of additional external data, such as data from the Gene Expression Omnibus, should be considered in future studies to further confirm the predictive utility of CupRLSig. Second, owing to a lack of complete data, prognostic factors such as surgical data were not considered in the construction of the nomogram. This may have affected the accuracy of the model. Third, functional studies are required to better understand the molecular mechanisms associated with the effects of cuproptosis-related lncRNAs.
CONCLUSION
This study proposes a novel CupRLSig lncRNA signature, as well as a nomogram based on that signature, which could be useful in predicting HCC patient prognosis. Importantly, CupRLSig also appears likely to predict levels of immune infiltration and indicate the potential efficacy of tumor immunotherapy, chemotherapy, and targeted therapy.
ARTICLE HIGHLIGHTS
Research background
Cuproptosis, a form of programmed cell death recently found to result from the binding of accumulated intracellular copper to aliphatic components of the tricarboxylic acid cycle, causes aggregation of lipoacylated proteins and loss of iron-sulfur cluster proteins. However, factors crucial to the regulation of cuproptosis remain unelucidated.
Research motivation
We hypothesized that abnormal expression of genes relevant to the copper metabolism pathway could serve as prognostic and therapeutic markers in hepatocellular carcinoma (HCC).
Research objectives
To identify long-chain non-coding RNAs (lncRNAs) associated with cuproptosis in order to predict the prognosis of patients with HCC.
Research methods
Using RNA sequencing data from The Cancer Genome Atlas Live Hepatocellular Carcinoma (TCGA-LIHC), a co-expression network of cuproptosis-related genes and lncRNAs was constructed. For HCC prognosis, we developed a cuproptosis-related lncRNA signature (CupRLSig) using univariate Cox, Lasso, and multivariate Cox regression analyses. Kaplan-Meier analysis was used to compare overall survival among high- and low-risk groups stratified by median CupRLSig risk score. Furthermore, comparisons of functional annotation, immune infiltration, somatic mutation, tumor mutation burden (TMB), and pharmacologic options were made between high- and low-risk groups.
Research results
The high-risk group identified by CupRLSig was associated with poorer overall survival and progression-free survival. Less activation of natural killer cells and more infiltration of regulatory T cells in the high-risk group may explain the worse outcomes. Based on checkpoint gene expression (CD276, CTLA-4, and PDCD-1) and tumor immune dysfunction and rejection (TIDE) scores, high-risk patients may respond better to immunotherapy.
Research conclusions
The lncRNA signature, CupRLSig, constructed in this study is valuable in prognostic estimation in the setting of HCC. Importantly, CupRLSig probably also predicts levels of immune infiltration and the potential efficacy of tumor immunotherapy, chemotherapy, and targeted therapy.
Research perspectives
We believe that we can expand the bulk-sequencing-generated lncRNA model to the standard care of HCC patients if sufficient external data is available to validate the predictive efficacy of CupRLSig.
ACKNOWLEDGEMENTS
The authors would like to thank The Cancer Genome Atlas (TCGA) for providing useful RNA-seq data with detailed accompanying clinical information (https://tcga-data.nci.nih.gov/tcga/); and Dr. Luo Ganfeng for his biostatistical review.
Footnotes
Institutional review board statement: The study was conducted in accordance with the Declaration of Helsinki (as revised in 2013). Since the present study is a bioinformatics work that did not involve animal or human specimens, there is no requirement for ethical permission from our institution or an ethics number.
Conflict-of-interest statement: There are no conflicts of interest to report.
Provenance and peer review: Unsolicited article; Externally peer reviewed.
Peer-review model: Single blind
Peer-review started: June 24, 2022
First decision: July 18, 2022
Article in press: August 17, 2022
Specialty type: Mathematical and computational biology
Country/Territory of origin: China
Peer-review report’s scientific quality classification
Grade A (Excellent): 0
Grade B (Very good): 0
Grade C (Good): C, C, C
Grade D (Fair): 0
Grade E (Poor): 0
P-Reviewer: Li ZZ, China; Nath L, India S-Editor: Chen YL L-Editor: A P-Editor: Guo X
Contributor Information
En-Min Huang, Department of Gastroenterological Surgery and Hernia Center, The Sixth Affiliated Hospital, Sun Yat-sen University, Guangzhou 510655, Guangdong Province, China; Guangdong Provincial Key Laboratory of Colorectal and Pelvic Floor Diseases, The Sixth Affiliated Hospital, Sun Yat-sen University, Guangzhou 510655, Guangdong Province, China.
Ning Ma, Department of Gastroenterological Surgery and Hernia Center, The Sixth Affiliated Hospital, Sun Yat-sen University, Guangzhou 510655, Guangdong Province, China; Guangdong Provincial Key Laboratory of Colorectal and Pelvic Floor Diseases, The Sixth Affiliated Hospital, Sun Yat-sen University, Guangzhou 510655, Guangdong Province, China.
Tao Ma, Department of Gastroenterological Surgery and Hernia Center, The Sixth Affiliated Hospital, Sun Yat-sen University, Guangzhou 510655, Guangdong Province, China; Guangdong Provincial Key Laboratory of Colorectal and Pelvic Floor Diseases, The Sixth Affiliated Hospital, Sun Yat-sen University, Guangzhou 510655, Guangdong Province, China.
Jun-Yi Zhou, Guangdong Provincial Key Laboratory of Colorectal and Pelvic Floor Diseases, The Sixth Affiliated Hospital, Sun Yat-sen University, Guangzhou 510655, Guangdong Province, China; Department of Gastrointestinal Surgery, The Sixth Affiliated Hospital, Sun Yat-sen University, Guangzhou 510655, Guangdong Province, China.
Wei-Sheng Yang, Department of Gastroenterological Surgery and Hernia Center, The Sixth Affiliated Hospital, Sun Yat-sen University, Guangzhou 510655, Guangdong Province, China; Guangdong Provincial Key Laboratory of Colorectal and Pelvic Floor Diseases, The Sixth Affiliated Hospital, Sun Yat-sen University, Guangzhou 510655, Guangdong Province, China.
Chuang-Xiong Liu, Department of Gastroenterological Surgery and Hernia Center, The Sixth Affiliated Hospital, Sun Yat-sen University, Guangzhou 510655, Guangdong Province, China; Guangdong Provincial Key Laboratory of Colorectal and Pelvic Floor Diseases, The Sixth Affiliated Hospital, Sun Yat-sen University, Guangzhou 510655, Guangdong Province, China.
Ze-Hui Hou, Department of Gastroenterological Surgery and Hernia Center, The Sixth Affiliated Hospital, Sun Yat-sen University, Guangzhou 510655, Guangdong Province, China; Guangdong Provincial Key Laboratory of Colorectal and Pelvic Floor Diseases, The Sixth Affiliated Hospital, Sun Yat-sen University, Guangzhou 510655, Guangdong Province, China.
Shuang Chen, Department of Gastroenterological Surgery and Hernia Center, The Sixth Affiliated Hospital, Sun Yat-sen University, Guangzhou 510655, Guangdong Province, China; Guangdong Provincial Key Laboratory of Colorectal and Pelvic Floor Diseases, The Sixth Affiliated Hospital, Sun Yat-sen University, Guangzhou 510655, Guangdong Province, China.
Zhen Zong, Department of Gastroenterological Surgery, The Second Affiliated Hospital, Nanchang University, Nanchang 330006, Jiangxi Province, China.
Bing Zeng, Department of Gastroenterological Surgery and Hernia Center, The Sixth Affiliated Hospital, Sun Yat-sen University, Guangzhou 510655, Guangdong Province, China; Guangdong Provincial Key Laboratory of Colorectal and Pelvic Floor Diseases, The Sixth Affiliated Hospital, Sun Yat-sen University, Guangzhou 510655, Guangdong Province, China.
Ying-Ru Li, Department of Gastroenterological Surgery and Hernia Center, The Sixth Affiliated Hospital, Sun Yat-sen University, Guangzhou 510655, Guangdong Province, China; Guangdong Provincial Key Laboratory of Colorectal and Pelvic Floor Diseases, The Sixth Affiliated Hospital, Sun Yat-sen University, Guangzhou 510655, Guangdong Province, China.
Tai-Cheng Zhou, Department of Gastroenterological Surgery and Hernia Center, The Sixth Affiliated Hospital, Sun Yat-sen University, Guangzhou 510655, Guangdong Province, China; Guangdong Provincial Key Laboratory of Colorectal and Pelvic Floor Diseases, The Sixth Affiliated Hospital, Sun Yat-sen University, Guangzhou 510655, Guangdong Province, China. zhoutch3@mail.sysu.edu.cn.
Data sharing statement
Publicly available datasets were analyzed in this study. These data can be found here: https://portal.gdc.cancer.gov/repository. Technical appendix, statistical code, and dataset available from the corresponding author at zhoutch3@mail.sysu.edu.cn.
References
- 1.Jemal A, Ward EM, Johnson CJ, Cronin KA, Ma J, Ryerson B, Mariotto A, Lake AJ, Wilson R, Sherman RL, Anderson RN, Henley SJ, Kohler BA, Penberthy L, Feuer EJ, Weir HK. Annual Report to the Nation on the Status of Cancer, 1975-2014, Featuring Survival. J Natl Cancer Inst. 2017;109 doi: 10.1093/jnci/djx030. [DOI] [PMC free article] [PubMed] [Google Scholar]
- 2.Ren X, Li Y, Zhou Y, Hu W, Yang C, Jing Q, Zhou C, Wang X, Hu J, Wang L, Yang J, Wang H, Xu H, Li H, Tong X, Wang Y, Du J. Overcoming the compensatory elevation of NRF2 renders hepatocellular carcinoma cells more vulnerable to disulfiram/copper-induced ferroptosis. Redox Biol. 2021;46:102122. doi: 10.1016/j.redox.2021.102122. [DOI] [PMC free article] [PubMed] [Google Scholar]
- 3.Zhang FJ, Yang JT, Tang LH, Wang WN, Sun K, Ming Y, Muhammad KG, Zheng YF, Yan M. Effect of X-ray irradiation on hepatocarcinoma cells and erythrocytes in salvaged blood. Sci Rep. 2017;7:7995. doi: 10.1038/s41598-017-08405-z. [DOI] [PMC free article] [PubMed] [Google Scholar]
- 4.El-Serag HB. Hepatocellular carcinoma. N Engl J Med. 2011;365:1118–1127. doi: 10.1056/NEJMra1001683. [DOI] [PubMed] [Google Scholar]
- 5.Giraud J, Chalopin D, Blanc JF, Saleh M. Hepatocellular Carcinoma Immune Landscape and the Potential of Immunotherapies. Front Immunol. 2021;12:655697. doi: 10.3389/fimmu.2021.655697. [DOI] [PMC free article] [PubMed] [Google Scholar]
- 6.Sangro B, Gomez-Martin C, de la Mata M, Iñarrairaegui M, Garralda E, Barrera P, Riezu-Boj JI, Larrea E, Alfaro C, Sarobe P, Lasarte JJ, Pérez-Gracia JL, Melero I, Prieto J. A clinical trial of CTLA-4 blockade with tremelimumab in patients with hepatocellular carcinoma and chronic hepatitis C. J Hepatol. 2013;59:81–88. doi: 10.1016/j.jhep.2013.02.022. [DOI] [PubMed] [Google Scholar]
- 7.Gupte A, Mumper RJ. Elevated copper and oxidative stress in cancer cells as a target for cancer treatment. Cancer Treat Rev. 2009;35:32–46. doi: 10.1016/j.ctrv.2008.07.004. [DOI] [PubMed] [Google Scholar]
- 8.Fruehauf JP, Meyskens FL Jr. Reactive oxygen species: a breath of life or death? Clin Cancer Res. 2007;13:789–794. doi: 10.1158/1078-0432.CCR-06-2082. [DOI] [PubMed] [Google Scholar]
- 9.Aubert L, Nandagopal N, Steinhart Z, Lavoie G, Nourreddine S, Berman J, Saba-El-Leil MK, Papadopoli D, Lin S, Hart T, Macleod G, Topisirovic I, Gaboury L, Fahrni CJ, Schramek D, Meloche S, Angers S, Roux PP. Copper bioavailability is a KRAS-specific vulnerability in colorectal cancer. Nat Commun. 2020;11:3701. doi: 10.1038/s41467-020-17549-y. [DOI] [PMC free article] [PubMed] [Google Scholar]
- 10.Ge EJ, Bush AI, Casini A, Cobine PA, Cross JR, DeNicola GM, Dou QP, Franz KJ, Gohil VM, Gupta S, Kaler SG, Lutsenko S, Mittal V, Petris MJ, Polishchuk R, Ralle M, Schilsky ML, Tonks NK, Vahdat LT, Van Aelst L, Xi D, Yuan P, Brady DC, Chang CJ. Connecting copper and cancer: from transition metal signalling to metalloplasia. Nat Rev Cancer. 2022;22:102–113. doi: 10.1038/s41568-021-00417-2. [DOI] [PMC free article] [PubMed] [Google Scholar]
- 11.Zhang G, Sun J, Zhang X. A novel Cuproptosis-related LncRNA signature to predict prognosis in hepatocellular carcinoma. Sci Rep. 2022;12:11325. doi: 10.1038/s41598-022-15251-1. [DOI] [PMC free article] [PubMed] [Google Scholar]
- 12.Tsvetkov P, Coy S, Petrova B, Dreishpoon M, Verma A, Abdusamad M, Rossen J, Joesch-Cohen L, Humeidi R, Spangler RD, Eaton JK, Frenkel E, Kocak M, Corsello SM, Lutsenko S, Kanarek N, Santagata S, Golub TR. Copper induces cell death by targeting lipoylated TCA cycle proteins. Science. 2022;375:1254–1261. doi: 10.1126/science.abf0529. [DOI] [PMC free article] [PubMed] [Google Scholar]
- 13.Huang Z, Zhou JK, Peng Y, He W, Huang C. The role of long noncoding RNAs in hepatocellular carcinoma. Mol Cancer. 2020;19:77. doi: 10.1186/s12943-020-01188-4. [DOI] [PMC free article] [PubMed] [Google Scholar]
- 14.Zhang J, Ma Y, Xie D, Bao Y, Yang W, Wang H, Jiang H, Han H, Dong T. Differentially expressed lncRNAs in liver tissues of TX mice with hepatolenticular degeneration. Sci Rep. 2021;11:1377. doi: 10.1038/s41598-020-80635-0. [DOI] [PMC free article] [PubMed] [Google Scholar]
- 15.Mao C, Wang X, Liu Y, Wang M, Yan B, Jiang Y, Shi Y, Shen Y, Liu X, Lai W, Yang R, Xiao D, Cheng Y, Liu S, Zhou H, Cao Y, Yu W, Muegge K, Yu H, Tao Y. A G3BP1-Interacting lncRNA Promotes Ferroptosis and Apoptosis in Cancer via Nuclear Sequestration of p53. Cancer Res. 2018;78:3484–3496. doi: 10.1158/0008-5472.CAN-17-3454. [DOI] [PMC free article] [PubMed] [Google Scholar]
- 16.Wu Y, Zhang S, Gong X, Tam S, Xiao D, Liu S, Tao Y. The epigenetic regulators and metabolic changes in ferroptosis-associated cancer progression. Mol Cancer. 2020;19:39. doi: 10.1186/s12943-020-01157-x. [DOI] [PMC free article] [PubMed] [Google Scholar]
- 17.Polishchuk EV, Merolla A, Lichtmannegger J, Romano A, Indrieri A, Ilyechova EY, Concilli M, De Cegli R, Crispino R, Mariniello M, Petruzzelli R, Ranucci G, Iorio R, Pietrocola F, Einer C, Borchard S, Zibert A, Schmidt HH, Di Schiavi E, Puchkova LV, Franco B, Kroemer G, Zischka H, Polishchuk RS. Activation of Autophagy, Observed in Liver Tissues From Patients With Wilson Disease and From ATP7B-Deficient Animals, Protects Hepatocytes From Copper-Induced Apoptosis. Gastroenterology. 2019;156:1173–1189.e5. doi: 10.1053/j.gastro.2018.11.032. [DOI] [PubMed] [Google Scholar]
- 18.Kahlson MA, Dixon SJ. Copper-induced cell death. Science. 2022;375:1231–1232. doi: 10.1126/science.abo3959. [DOI] [PubMed] [Google Scholar]
- 19.Dong J, Wang X, Xu C, Gao M, Wang S, Zhang J, Tong H, Wang L, Han Y, Cheng N. Inhibiting NLRP3 inflammasome activation prevents copper-induced neuropathology in a murine model of Wilson's disease. Cell Death Dis. 2021;12:87. doi: 10.1038/s41419-021-03397-1. [DOI] [PMC free article] [PubMed] [Google Scholar]
- 20.Mayakonda A, Lin DC, Assenov Y, Plass C, Koeffler HP. Maftools: efficient and comprehensive analysis of somatic variants in cancer. Genome Res. 2018;28:1747–1756. doi: 10.1101/gr.239244.118. [DOI] [PMC free article] [PubMed] [Google Scholar]
- 21.Newman AM, Liu CL, Green MR, Gentles AJ, Feng W, Xu Y, Hoang CD, Diehn M, Alizadeh AA. Robust enumeration of cell subsets from tissue expression profiles. Nat Methods. 2015;12:453–457. doi: 10.1038/nmeth.3337. [DOI] [PMC free article] [PubMed] [Google Scholar]
- 22.Rooney MS, Shukla SA, Wu CJ, Getz G, Hacohen N. Molecular and genetic properties of tumors associated with local immune cytolytic activity. Cell. 2015;160:48–61. doi: 10.1016/j.cell.2014.12.033. [DOI] [PMC free article] [PubMed] [Google Scholar]
- 23.Mlecnik B, Bindea G, Angell HK, Maby P, Angelova M, Tougeron D, Church SE, Lafontaine L, Fischer M, Fredriksen T, Sasso M, Bilocq AM, Kirilovsky A, Obenauf AC, Hamieh M, Berger A, Bruneval P, Tuech JJ, Sabourin JC, Le Pessot F, Mauillon J, Rafii A, Laurent-Puig P, Speicher MR, Trajanoski Z, Michel P, Sesboüe R, Frebourg T, Pagès F, Valge-Archer V, Latouche JB, Galon J. Integrative Analyses of Colorectal Cancer Show Immunoscore Is a Stronger Predictor of Patient Survival Than Microsatellite Instability. Immunity. 2016;44:698–711. doi: 10.1016/j.immuni.2016.02.025. [DOI] [PubMed] [Google Scholar]
- 24.Ferlay J, Colombet M, Bray F. Cancer incidence in five continents, CI5plus: IARC CancerBase No. 9. Lyon. France: International Agency for Research on Cancer, 2018. [Google Scholar]
- 25.Zhang JS, Wang ZH, Guo XG, Zhang J, Ni JS. A nomogram for predicting the risk of postoperative recurrence of hepatitis B virus-related hepatocellular carcinoma in patients with high preoperative serum glutamyl transpeptidase. J Gastrointest Oncol. 2022;13:298–310. doi: 10.21037/jgo-21-450. [DOI] [PMC free article] [PubMed] [Google Scholar]
- 26.Guo Y, Qu Z, Li D, Bai F, Xing J, Ding Q, Zhou J, Yao L, Xu Q. Identification of a prognostic ferroptosis-related lncRNA signature in the tumor microenvironment of lung adenocarcinoma. Cell Death Discov. 2021;7:190. doi: 10.1038/s41420-021-00576-z. [DOI] [PMC free article] [PubMed] [Google Scholar]
- 27.Hu W, Feng H, Xu X, Huang X, Chen W, Hao L, Xia W. Long noncoding RNA FOXD2-AS1 aggravates hepatocellular carcinoma tumorigenesis by regulating the miR-206/MAP3K1 axis. Cancer Med. 2020;9:5620–5631. doi: 10.1002/cam4.3204. [DOI] [PMC free article] [PubMed] [Google Scholar]
- 28.Liu Z, Mo H, Sun L, Wang L, Chen T, Yao B, Liu R, Niu Y, Tu K, Xu Q, Yang N. Long noncoding RNA PICSAR/miR-588/EIF6 axis regulates tumorigenesis of hepatocellular carcinoma by activating PI3K/AKT/mTOR signaling pathway. Cancer Sci. 2020;111:4118–4128. doi: 10.1111/cas.14631. [DOI] [PMC free article] [PubMed] [Google Scholar]
- 29.Valko M, Morris H, Cronin MT. Metals, toxicity and oxidative stress. Curr Med Chem. 2005;12:1161–1208. doi: 10.2174/0929867053764635. [DOI] [PubMed] [Google Scholar]
Associated Data
This section collects any data citations, data availability statements, or supplementary materials included in this article.
Data Availability Statement
Publicly available datasets were analyzed in this study. These data can be found here: https://portal.gdc.cancer.gov/repository. Technical appendix, statistical code, and dataset available from the corresponding author at zhoutch3@mail.sysu.edu.cn.


