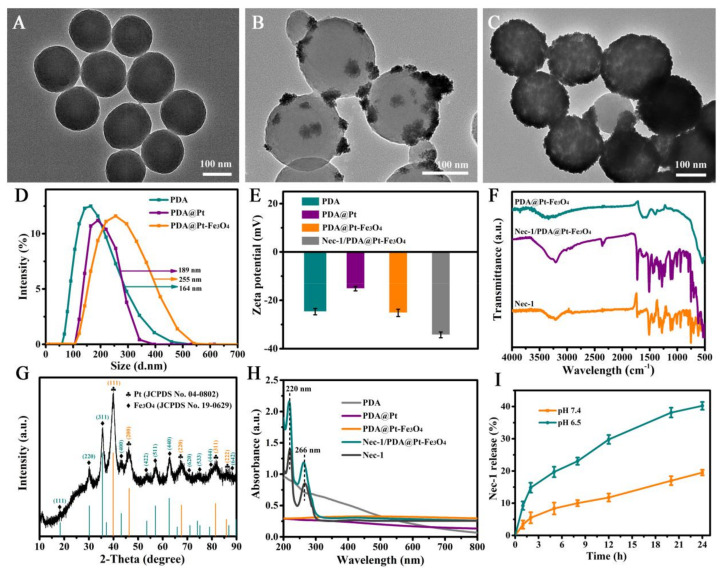
Figure 2.
The TEM images of (A) PDA nanoparticles, (B) PDA@Pt nanoparticles, (C) PDA@Pt-Fe3O4 nanoparticles. (D) The dynamic light scattering of PDA, PDA@Pt, and PDA@Pt-Fe3O4 nanoparticles, respectively. (E) The zeta potential of PDA, PDA@Pt, PDA@Pt-Fe3O4, and Nec-1/PDA@Pt-Fe3O4 nanoparticles, respectively. (F) FTIR spectra of the PDA@Pt-Fe3O4, Nec-1/PDA@Pt-Fe3O4, and free Nec-1. (G) XRD pattern of the PDA@Pt-Fe3O4. (H) UV-Vis-NIR spectra of the aqueous solutions of PDA, PDA@Pt, PDA@Pt-Fe3O4, Nec-1/PDA@Pt-Fe3O4, and free Nec-1. (I) Cumulative Nec-1 release of the Nec-1/PDA@Pt-Fe3O4 nanoparticles in PBS at pH 6.5 and 7.4.

