

Abstract
Aims
Coronary artery calcification is a marker of cardiovascular risk, but its association with qualitatively and quantitatively assessed plaque subtypes is unknown.
Methods and results
In this post-hoc analysis, computed tomography (CT) images and 5-year clinical outcomes were assessed in SCOT-HEART trial participants. Agatston coronary artery calcium score (CACS) was measured on non-contrast CT and was stratified as zero (0 Agatston units, AU), minimal (1–9 AU), low (10–99 AU), moderate (100–399 AU), high (400–999 AU), and very high (≥1000 AU). Adverse plaques were investigated by qualitative (visual categorization of positive remodelling, low-attenuation plaque, spotty calcification, and napkin ring sign) and quantitative (calcified, non-calcified, low-attenuation, and total plaque burden; Autoplaque) assessments. Of 1769 patients, 36% had a zero, 9% minimal, 20% low, 17% moderate, 10% high, and 8% very high CACS. Amongst patients with a zero CACS, 14% had non-obstructive disease, 2% had obstructive disease, 2% had visually assessed adverse plaques, and 13% had low-attenuation plaque burden >4%. Non-calcified and low-attenuation plaque burden increased between patients with zero, minimal, and low CACS (P < 0.001), but there was no statistically significant difference between those with medium, high, and very high CACS. Myocardial infarction occurred in 41 patients, 10% of whom had zero CACS. CACS >1000 AU and low-attenuation plaque burden were the only predictors of myocardial infarction, independent of obstructive disease, and 10-year cardiovascular risk score.
Conclusion
In patients with stable chest pain, zero CACS is associated with a good but not perfect prognosis, and CACS cannot rule out obstructive coronary artery disease, non-obstructive plaque, or adverse plaque phenotypes, including low-attenuation plaque.
Keywords: coronary calcium score, low-attenuation plaque, computed tomography, computed tomography coronary angiography, atherosclerotic plaque
Graphical Abstract
Graphical Abstract.

Coronary artery disease and high-risk plaque features are common in patients with zero or low coronary artery calcium score, and low-attenuation plaque burden (orange arrow) increases as the calcium score increases.
Introduction
Coronary artery calcification is an established marker of the presence of atherosclerosis1,2 and its quantification has prognostic implications over and above traditional cardiovascular risk factors.3 Patients with a zero-calcium score are at particularly low risk of subsequent cardiovascular events, with a ‘warranty period’ established for a zero-calcium score extending beyond 15 years.1,4 Cardiovascular risk increases as the calcium score increases, and coronary artery calcification is used to stratify patients in different risk groups in order to adjust management.5 However, concerns have been expressed that computed tomography (CT) calcium scoring measures the wrong type of plaque, namely plaques that are stable and relatively unlikely to rupture and cause events. To date, relatively little is known about the association between calcium score categories and other types of higher risk atherosclerotic plaque.
Coronary artery calcification quantifies macro-calcified plaques. While higher coronary artery calcium scores may be associated with an increased risk of total and adverse plaque, it does not completely account for the detailed specific plaque composition. Visually assessed adverse coronary plaque characteristics, such as positive remodelling and low-attenuation plaque, are associated with a three-fold increase in subsequent myocardial infarction, but this is not independent of the coronary artery calcium score.3 However, greater prognostic information can be derived from quantitative assessment of plaque burden on coronary computed tomography angiography (CCTA). We have previously established that the burden of low-attenuation plaque on CCTA, synonymous with the necrotic core of the thin cap fibroatheroma, is predictive of coronary events, over and above the presence of luminal stenosis, cardiovascular risk factors, and coronary artery calcium scores.6
In this post-hoc analysis of the Scottish Computed Tomography of the HEART (SCOT-HEART) study, we aimed to determine the presence of visually and quantitatively assessed adverse plaques in patients across the range of coronary artery calcium scores, and correlate this with subsequent clinical events.
Methods
Study design
We analysed the images of patients who underwent computed tomography (CT) as part of the SCOT-HEART trial. The rationale, design, and primary results of SCOT-HEART have been published previously.7–9 Briefly, SCOT-HEART is a multicentre open-label parallel-group randomized controlled trial that assessed the use of CT in patients who attended the out-patient department with suspected angina pectoris secondary to coronary artery disease.10 The study was approved by the local ethics committee and all participants gave written informed consent.
Participants
The SCOT-HEART trial recruited 4146 patients between 18 and 75 years old who attended cardiology outpatient clinics at 12 sites and were randomized to either standard care or standard care plus CT. In the intervention arm, 1778 of the 2073 participants underwent CT of which 1769 images were available and of suitable image quality for analysis. Non-contrast CT to assess coronary artery calcium score and CCTA were performed as described previously.7–9 Information on cardiovascular risk factors, estimated 10-year risk of cardiovascular disease [the ASSIGN (ASsessing cardiovascular risk using SIGN guidelines) cardiovascular risk score11] and subsequent outcomes were obtained from the SCOT-HEART database. The ASSIGN cardiovascular risk score is an estimated percentage risk of developing cardiovascular event at 10 years.11 Information on CCTA findings was provided to the patient’s clinician, and management was optimized by them based on these findings.
Coronary artery calcium score
Coronary artery calcium scores were calculated using the Agatston method12 using dedicated semi-automatic software (Vitrea Advanced, Vital Images, Minnetonka, MN, USA). Coronary artery calcium scorers were classified into six categories: zero (0 AU), minimal (1–9 AU), low (10–99 AU), moderate (100–399 AU), high (400–999 AU), and very high (≥1000 AU).
Coronary artery stenoses
Information on the presence of coronary artery stenoses on CCTA was obtained from the SCOT-HEART database. Trained observers performed a per-segment analysis using a 15-segment model to assess coronary artery stenoses, with complex cases classified by consensus. We have previously demonstrated high intra- and inter-observer agreement.13 Normal coronary arteries were defined as cross-sectional area luminal stenosis <10%, non-obstructive coronary artery disease as cross-sectional area luminal stenosis 10–70%, and obstructive coronary artery disease as cross-sectional area luminal stenosis >70% in at least one major epicardial vessel or >50% in the left main stem.
Visual identification of adverse plaque characteristics
Per segment analysis was performed to identify adverse plaque characteristics3 including positive remodelling, low-attenuation plaque, spotty calcification, and the napkin ring sign.14 Positive remodelling was defined as an outer vessel diameter >10% of the mean diameter of the segments directly proximal and distal to the plaque,14 low-attenuation plaque as an attenuation density <30 Hounsfield Units (HU),15 spotty calcification as coronary artery wall calcification <3 mm diameter,14 and the ‘napkin ring’ sign as a central area of low-attenuation plaque with a peripheral rim of high attenuation.16 Patients with either positive remodelling or low-attenuation plaque were defined as having an adverse plaque.6
Quantitative assessment of atherosclerotic plaque
Standardized semiautomatic software (Autoplaque, version 2.5, Cedars-Sinai Medical Center, Los Angeles, CA, USA) was used to quantify atherosclerotic plaque burden by one of four trained observers, with established high interobserver, intraobserver, and interscan agreement.17,18 Automated thresholds were used for scan-specific plaque attenuation19 and the vessel lumen, wall and plaque were defined automatically, with manual input as required. Quantitative analysis was performed for all patients with a coronary artery calcium score greater than 0 or those with at least 1 segment with >10% stenosis, in order to avoid missing patients with plaque but a calcium score of zero or evaluating segments with only image noise or motion artefact. Patients with normal coronary arteries were assigned plaque burdens of 0. Total plaque, calcified plaque, non-calcified plaque, and low-attenuation plaque volumes were measured (mm3) and plaque burden was calculated for each (100% × plaque volume/vessel volume of region assessed). The plaque burdens were summed on a per patient basis to give a per patient plaque burden.15 A cut-off of 4% was used to define patients with a high low-attenuation plaque burden, based on our previous findings.6
Clinical outcomes
Outcome information was obtained from the SCOT-HEART database. Information on clinical outcomes was obtained based on national coding data from the electronic Data Research and Innovation Service of National Health Service (NHS), Scotland. Review of electronic health records was performed to supplement this as required. Information was recorded on invasive coronary angiography (ICA), coronary revascularization with percutaneous coronary intervention (PCI), or coronary artery bypass graft (CABG) and late revascularization (undertaken more than 1 year from randomization). Outcome categorization was performed blinded to CT or other study information. Clinical outcomes were all-cause mortality, combined non-fatal myocardial infarction (MI) and coronary heart disease death, and major adverse cardiovascular events (MACE). MACE was defined as the composite of non-fatal myocardial infarction, non-fatal stroke, coronary heart disease death, or coronary revascularization. Early or late MACE was defined as MACE before or beyond 1 year from randomization, respectively.
Statistical analysis
Statistical analysis was performed using R, version 3.5.0 (R Foundation for Statistical Computing, Vienna, Austria). Normally distributed variables are presented as mean ± standard deviation. Non-normally distributed data are presented as median and interquartile interval (IQI). Statistical significance was derived using Wilcoxon test, Kruskal–Wallis test, Pearson χ2 test, Fisher’s exact test, and Wilcoxon rank-sum test with continuity correction for multiple comparisons, as appropriate. Correlations were assessed using Spearman rank-order correlation. Correlations were defined as very weak (<0.2), weak (0.2 to <0.4), moderate (0.4 to <0.6), strong (0.6 to <0.8), and very strong (0.8 to 1). Outcome data were analysed using Cox proportional hazards regression and graphically presented using a cumulative incidence plot. Deaths not related to coronary heart disease were censored for the Cox regression analysis. The estimated 10-year risk of cardiovascular disease and plaque burdens were log-transformed for analysis (log base 2 of 1 plus parameter). Multivariable models were constructed for both fatal or non-fatal myocardial infarction and late MACE endpoints. Variables included in the multivariable models were coronary artery calcium score groups, quantitatively assessed low-attenuation plaque burden, presence of obstructive coronary artery disease, and estimated 10-year risk of cardiovascular disease. Data are presented as hazard ratios (HRs) and 95% confidence intervals (CIs). A two-tailed P-value <0.05 was considered statistically significant. The data supporting the findings of this study are available from the corresponding author for checking the reproducibility of the study results upon reasonable request.
Results
The images of 1769 patients were assessed. Patients had a mean age of 58 ± 9 years, 56% were male and the median Agatston score was 21 (IQI 0–230) AU. Over a third (36%, n = 642) of patients had a zero-calcium score, 9% (n = 163) a minimal calcium score, 20% (n = 346) a low calcium score, 17% (n = 303) a moderate calcium score, 10% (n = 169) a high calcium score, and 8% (n = 146) a very high calcium score (Table 1).
Table 1.
Characteristics of study participants with different categories of coronary artery calcium score (CACS)
| CACS | P value | ||||||
|---|---|---|---|---|---|---|---|
| Zero 0 AU | Minimal 1–9 AU | Low 10–99 AU | Moderate 100–399 AU | High 400–999 AU | Very high ≥1000 AU | ||
| Number | 642 (36) | 163 (9) | 346 (20) | 303 (17) | 169 (10) | 146 (8) | |
| Male | 250 (39) | 87 (53) | 189 (55) | 210 (69) | 132 (78) | 129 (88) | <0.001 |
| Age (years) | 53 ± 10 | 56 ± 9 | 59 ± 8 | 61 ± 8 | 63 ± 7 | 64 ± 7 | <0.001 |
| BMI (kg/m2) | 30 ± 6 | 30 ± 6 | 30 ± 6 | 29 ± 4 | 30 ± 5 | 30 ± 5 | 0.049 |
| AF | 12 (1.9) | 4 (2.5) | 4 (1.2) | 5 (1.7) | 5 (3.0) | 4 (2.7) | 0.711 |
| Previous CHD | 21 (3.3) | 4 (2.5) | 24 (6.9) | 42 (13.9) | 36 (21.3) | 51 (34.9) | <0.001 |
| Previous CVD | 16 (2.5) | 4 (2.5) | 18 (5.2) | 18 (6.0) | 11 (6.5) | 12 (8.3) | 0.007 |
| Previous PVD | 6 (0.9) | 2 (1.2) | 6 (1.7) | 5 (1.7) | 7 (4.2) | 5 (3.4) | 0.055 |
| Smoking status | <0.001 | ||||||
| Non | 350 (55) | 88 (54) | 154 (45) | 121 (40) | 65 (39) | 67 (46) | |
| Ex | 164 (26) | 48 (29) | 120 (35) | 120 (40) | 79 (47) | 62 (43) | |
| Current | 127 (20) | 27 (17) | 72 (21) | 62 (21) | 25 (15) | 17 (12) | |
| Chest pain diagnosis | <0.001 | ||||||
| Non-anginal | 316 (49) | 77 (47) | 130 (38) | 89 (29) | 47 (28) | 24 (16) | |
| Atypical | 178 (28) | 38 (23) | 79 (23) | 82 (27) | 27 (16) | 28 (19) | |
| Typical | 148 (23) | 48 (29) | 137 (40) | 132 (44) | 95 (56.2) | 94 (64) | |
| Hypertension | 153 (24) | 55 (34) | 120 (35) | 114 (38) | 83 (50) | 83 (58) | <0.001 |
| Diabetes mellitus | 44 (6.9) | 22 (13.5) | 41 (11.8) | 35 (11.6) | 23 (13.6) | 31 (21.2) | <0.001 |
| Family history of CHD | 279 (44) | 76 (47) | 154 (45) | 125 (42) | 71 (43) | 60 (41) | 0.888 |
| Estimated 10-year risk of cardiovascular disease | 10 [6, 16] | 15 [10, 21] | 17 [12, 24] | 20 [14, 28] | 21 [15, 31] | 22 [16, 32] | <0.001 |
Number and percent (%), mean ± standard deviation, or median [interquartile interval]. Values in bold indicate statistical significance. Estimated 10-year risk of cardiovascular disease was calculated using the ASSIGN score.
AF, atrial fibrillation; BMI, body mass index; CTCA, computed tomography coronary angiography; CHD, coronary heart disease; PVD, peripheral vascular disease; CVD, cerebrovascular disease.
Patients with a zero-calcium score were younger, more likely to be female, non-smokers without a history of previous coronary heart disease, cerebrovascular disease, diabetes mellitus, or hypertension and were more likely to present with atypical angina or non-anginal chest pain. Patients with very high calcium scores were more likely to be older hypertensive male smokers with a history of coronary artery and cerebrovascular disease, and present with typical angina. There was a moderate correlation between coronary artery calcium score and estimated 10-year risk of cardiovascular disease (r = 0.46; P < 0.001), but half of patients (55%) with a zero-calcium score had an estimated 10-year risk of cardiovascular disease of ≥10% and 4% of patients with a very high calcium score had an estimated 10-year risk of cardiovascular disease of <10%.
Amongst patients with a zero-calcium score, those with obstructive disease, visually assessed adverse plaque or high low-attenuation plaque burden (>4%) on CCTA were more likely to be taking preventative therapy at 6 weeks (Supplementary data online, Table S1).
Visual assessment of coronary plaque characteristics
Although the majority (84%, n = 537/642) of patients with a zero-calcium score had normal coronary arteries (Table 2), 14% had non-obstructive disease (n = 92/642), and 2% had obstructive disease (n = 13/642), of which one patient (0.2%) had three-vessel disease. In addition, 41% (n = 66/163) of patients with a minimal calcium score had non-obstructive disease and 9% (n = 14/163) had obstructive coronary artery disease. In contrast, obstructive coronary artery disease was present in 85% (n = 124/146) of scans with very high coronary artery calcium score, 65% (n = 110/169) with a high calcium score, and 41% (n = 124/303) with a moderate calcium score. The number of patients with one-, two-, or three-vessel obstructive disease increased across the calcium score groups (Table 2).
Table 2.
Computed tomography findings
| CACS | P value | ||||||
|---|---|---|---|---|---|---|---|
| Zero 0 AU | Minimal 1–9 AU | Low 10–99 AU | Moderate 100–399 AU | High 400–999 AU | Very high ≥1000 AU | ||
| CACS | 0 | 3[1–6] | 37[22–62] | 204[146–291] | 611[507–785] | 1612[1235–2434] | |
| CCTA | |||||||
| Normal | 537 (84) | 83 (50) | 24 (6.9) | 2 (0.7) | 0 | 0 | <0.001 |
| Non-obstructive | 92 (14) | 66 (41) | 255 (74) | 177 (58) | 59 (35) | 22 (15) | |
| Obstructive | 13 (2) | 14 (9) | 67 (19) | 124 (41) | 110 (65) | 124 (85) | |
| Number of vessels with obstructive disease | |||||||
| One vessel | 10 (1.6) | 11 (6.7) | 48 (14) | 68 (22) | 39 (23) | 31 (21) | <0.001 |
| Two vessels | 2 (0.3) | 3 (1.8) | 13 (3.8) | 41 (14) | 35 (21) | 34 (23) | |
| Three vessels | 1 (0.2) | 0 | 6 (1.7) | 15 (5) | 36 (21) | 59 (40) | |
| Adverse plaquea | 14 (2.2) | 22 (13) | 128 (37) | 203 (67) | 121 (72) | 120 (82) | <0.001 |
| Positive remodelling | 12 (1.9) | 21 (13) | 127 (37) | 202 (67) | 121 (73) | 120 (82) | <0.001 |
| Low-attenuation | 4 (0.6) | 7 (4.3) | 28 (8.1) | 57 (19) | 35 (21) | 37 (25) | <0.001 |
| Napkin ring | 0 | 3 (1.8) | 12 (3.5) | 28 (9.2) | 14 (8.3) | 19 (13) | <0.001 |
| Spotty Calcification | 9 (1.4) | 17 (10) | 88 (25) | 108 (36) | 43 (25) | 34 (23) | <0.001 |
Number and percent (%). Values in bold indicate statistical significance.
Positive remodelling and/or low-attenuation plaque.
Adverse plaques (positive remodelling and low-attenuation plaque) were present in 2% (n = 14/642) of patients with a zero-calcium score (Table 2). There was a strong correlation between coronary artery calcium score and the number of plaques with positive remodelling (r = 0.65, P < 0.001), but a weak correlation with the number of plaques with spotty calcification (r = 0.31, P < 0.001), visually assessed low-attenuation plaque (r = 0.30, P < 0.001), or the napkin ring sign (r = 0.21, P < 0.001). Patients with CACS ≥1000 AU had the highest frequency of adverse plaques (82%, n = 120/146), but adverse plaques were also present in 72% (n = 121/169) of patients with a high calcium score and 67% (n = 203/303) patients with a moderate calcium score (Table 2). These patterns were similar when limited to patients with low to intermediate risk (10-year cardiovascular risk score 1–20%), without a history of previous coronary artery disease (Supplementary data online, Table S2).
Quantitative assessment of coronary plaque characteristics
Among patients with a zero-calcium score, 16% (n = 105/642) had non-calcified and low-attenuation plaque quantified on CCTA. Calcified plaque was quantified on CCTA in 6% (n = 35/642) of patients with a calcium score of zero.
Quantitatively assessed calcified plaque burden increased across all the coronary artery calcium score groups (P < 0.001 for all comparisons). Non-calcified plaque burden increased between patients with a zero, minimal, and low calcium score [median 0 vs. 0 (0–44.3), P < 0.001 vs. 41.8 (34.6–50.4), P < 0.001], but there was no statistically significant difference in non-calcified plaque burden between patients with medium, high and very high calcium score (P > 0.05 for all comparisons). A similar pattern was observed for low-attenuation plaque burden (Figure 1). A high low-attenuation plaque burden (>4%) was present in 13% (n = 85/642) of patients with a zero-calcium score. The prevalence of a high low-attenuation plaque burden increased across the calcium score groups, with patients with a very high calcium score being six times more likely to have a low-attenuation plaque burden >4% compared to patients with a zero-calcium score (Figure 2).
Figure 1.

Quantitative assessment of atherosclerotic plaque burden on CCTA in patients stratified into coronary artery calcium risk groups. Median total plaque burden (top left), calcified plaque burden (top right), non-calcified plaque burden (bottom left), and low-attenuation plaque burden (bottom right) in different coronary artery calcium score groups. CACS, coronary artery calcium score.
Figure 2.
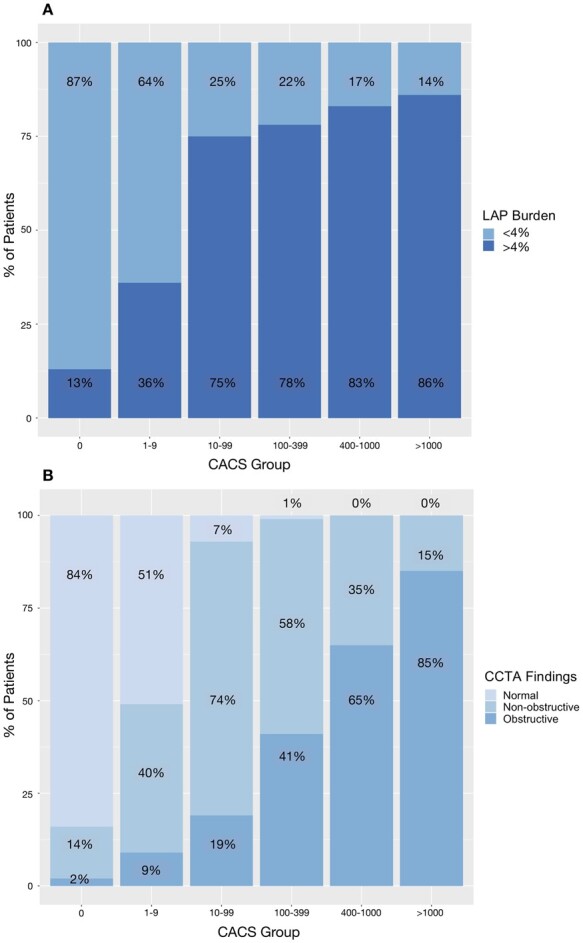
Proportion of patients in different coronary artery calcium score groups with (A) low-attenuation plaque burden >4% and (B) with normal, non-obstructive or obstructive disease on CCTA. CACS, coronary artery calcium score.
Clinical outcomes
Among patients with zero-calcium score, 5% (n = 30/642) underwent invasive coronary angiography, 1% (n = 7/642) underwent coronary revascularization, and 0.2% (n = 1/642) underwent late revascularization. Of the patients with a minimal calcium score, 13% (n = 21/163) underwent angiography, 4% (7/163) were revascularized, and none underwent late revascularization. Increasing calcium score was associated with an increased frequency of invasive coronary angiography, revascularization, and late revascularization (Figure 3), with patients with a very high calcium score being most likely to undergo invasive coronary angiography.
Figure 3.

Proportion of patients with events by coronary artery calcium groups including angiography, all revascularization, all late revascularization, late MACE, fatal or non-fatal myocardial infarction, and all-cause mortality. CACS, coronary artery calcium score; CHD, coronary heart disease; MACE, major adverse cardiovascular events; MI, myocardial infarction. P < 0.001 for all.
Over a median follow-up of 4.8 (IQI 4.1–5.7) years, fatal or non-fatal myocardial infarction occurred in 41 patients (2.3%). Of these 41 patients, the calcium score was zero for 10% (n = 4), minimal for 7% (n = 3), low for 17% (n = 7), moderate for 17% (n = 7), high for 20% (n = 8), and very high for 29% (n = 12; Figure 3; Supplementary data online, Table S3). Patients with a very high calcium score were much more likely to suffer a fatal or non-fatal myocardial infarction compared to those with a zero-calcium score (HR 13.4, 95% CI 4.3 to 41.5; P < 0.001; n = 12/146 vs. n = 4/642, Figure 4). In multivariable analysis, only very high calcium score was an independent predictor of outcomes when low-attenuation plaque burden was included in the analysis (Table 3, Supplementary data online, Table S4).
Figure 4.
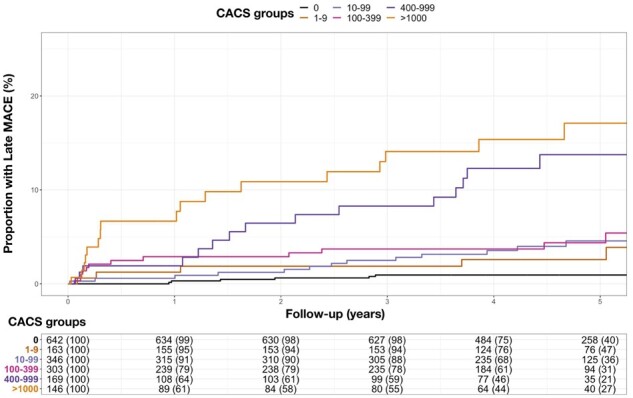
Cumulative incidence plot for late MACE (after the first year) and calcium score groups. MACE, major adverse cardiovascular event.
Table 3.
Univariable and multivariable analysis for coronary artery calcification and quantitatively assessed low-attenuation plaque burden and the endpoint of fatal or non-fatal myocardial infarction
| Univariable analysis | HR [95% CI] | P value | Multivariable analysis | HR [95% CI] | P value | |
|---|---|---|---|---|---|---|
| Fatal or non-fatal MI | CACS 1–9 | 2.92 [0.65–13.1] | 0.160 | CACS 1–9 | 1.85 [0.40–8.43] | 0.428 |
| CACS 10–99 | 3.27 [0.96–11.2] | 0.059 | CACS 10–99 | 1.24 [0.33–4.59] | 0.752 | |
| CACS 100–399 | 3.69 [1.08–12.6] | 0.037 | CACS 100–399 | 1.29 [0.34–4.92] | 0.709 | |
| CACS 400–999 | 7.67 [2.31–25.5] | <0.001 | CACS 400–999 | 2.63 [0.68–10.1] | 0.161 | |
| CACS >1000 | 13.4 [4.31–41.5] | <0.001 | CACS >1000 | 4.55 [1.20–17.3] | 0.026 | |
| LAP burden | 1.74 [1.19–2.54] | 0.004 | ||||
| Obstructive disease | 1.03 [0.48–2.22] | 0.943 | ||||
| Cardiovascular risk scorea | 1.00 [0.98–1.03] | 0.805 | ||||
| Late MACE | CACS 1–9 | 2.99 [1.04–8.63] | 0.042 | CACS 1–9 | 1.93 [0.65–5.69] | 0.235 |
| CACS 10–99 | 3.24 [1.34–7.83] | 0.008 | CACS 10–99 | 1.28 [0.48–3.93] | 0.620 | |
| CACS 100–399 | 4.16 [1.73–10.0] | 0.002 | CACS 100–399 | 1.30 [0.48–3.51] | 0.612 | |
| CACS 400–999 | 10.8 [4.58–25.5] | <0.001 | CACS 400–999 | 2.70 [0.99–7.45] | 0.052 | |
| CACS >1000 | 15.8 [6.93–36.2] | <0.001 | CACS >1000 | 3.37 [1.22–9.29] | 0.019 | |
| LAP burden | 1.44 [1.09–1.89] | 0.009 | ||||
| Obstructive disease | 2.09 [1.17–3.74] | 0.013 | ||||
| Cardiovascular risk scorea | 1.02 [1.00–1.04] | 0.049 |
Calcium score groups were compared to those with zero coronary artery calcification. Low-attenuation plaque burden was log transformed for analysis (log2). Bold indicates statistical significance.
Estimated 10-year risk of cardiovascular disease calculated using the ASSIGN score.
CACS, coronary artery calcium score; CI, confidence interval; HR, hazard ratio; LAP, low-attenuation plaque; MACE, major adverse cardiovascular event; MI, myocardial infarction.
Late MACE occurred in 74 patients (4.2%), including 1% (n = 8/642) of patients with a zero-calcium score, 4% (n = 6/163) with minimal calcium score, 4% (n = 13/346) with low calcium score, 4% (n = 13/303) with moderate calcium score, 9% (n = 15/169) with high calcium score, and 13% (n = 19/146) with very high calcium score (Supplementary data online, Table S5). Details of the late MACE characteristics in patients with zero or minimal calcium score are provided in Supplementary data online, Table S6. Compared to patients with late MACE, those with early MACE were of similar age and sex and had similar estimated 10-year risk of cardiovascular disease and coronary artery calcium score but were less likely to have a calcium score of zero (Table 4). However, patients with early MACE were more likely to have obstructive disease (87% vs. 55%, P < 0.001), adverse plaques (77% vs. 53%, P = 0.002), had a higher non-calcified plaque burden [46% (40–51) vs. 42% (35–49), P = 0.016] and were more likely to have a low-attenuation plaque burden above 4% (90% vs. 77%, P = 0.039). In univariable analysis, all calcium score groups were at increased risk of late MACE compared to patients with a zero-calcium score (Table 3), with patients with a very high calcium score at the highest risk (HR 15.9, 95% CI 6.93–36.2; P < 0.001). However, in multivariable analysis, only a very high calcium score was predictive of late MACE, along with low-attenuation plaque burden, the presence of obstructive disease and estimated 10-year risk of cardiovascular disease (Table 3 and Supplementary data online, Table S4).
Table 4.
Demographic and CT characteristics for patients with MACE occurring at less than 1 year or greater than 1 year
| MACE ≤1 year | MACE >1 year | P | ||
|---|---|---|---|---|
| Early MACE | Late MACE | |||
| n | 83 | 74 | ||
| Male (%) | 65 (78) | 51 (69) | 0.248 | |
| Age (years) | 59 ±7 | 60 ±8 | 0.533 | |
| BMI (kg/m2) | 30 ±5 | 30 ±5 | 0.443 | |
| Atrial fibrillation | 3 (3.6) | 1 (1.4) | 0.696 | |
| Prior history of CHD | 19 (23) | 17 (23) | 1 | |
| Prior history of CVD | 5 (6.0) | 6 (8.2) | 0.825 | |
| Prior history of PVD | 1 (1.2) | 4 (5.4) | 0.298 | |
| Smoking habit | Non-smoker | 40 (48) | 32 (43) | 0.785 |
| Ex-smoker | 26 (31) | 24 (32) | ||
| Current smoker | 17 (21) | 18 (24) | ||
| Chest pain diagnosis | Non-anginal | 11 (13) | 19 (26) | 0.14 |
| Atypical angina | 14 (17) | 10 (14) | ||
| Typical angina | 58 (70) | 45 (61) | ||
| Hypertension | 31 (38) | 34 (47) | 0.309 | |
| Diabetes mellitus | 9 (11) | 13 (18) | 0.326 | |
| Family history of CHD | 39 (47) | 36 (49) | 0.897 | |
| Estimated 10-year risk of cardiovascular disease | 20 [15–31] | 21 [14–30] | 0.825 | |
| CACS | 375 [115–921] | 292 [60–1027] | 0.358 | |
| CACS | 0 | 0 | 8 (11) | 0.02 |
| 1–9 | 3 (4) | 6 (8) | ||
| 10–99 | 16 (19) | 13 (18) | ||
| 100–399 | 25 (30) | 13 (18) | ||
| 400–999 | 20 (24) | 15 (20) | ||
| >1000 | 19 (23) | 19 (26) | ||
| CCTA | Normal | 0 | 6 (8) | <0.001 |
| Non- obstructive | 11 (13) | 27 (37) | ||
| Obstructive | 72 (87) | 41 (55) | ||
| Number of vessels with obstructive disease | One-vessel disease | 27 (33) | 11 (15) | <0.001 |
| Two-vessel disease | 22 (27) | 16 (22) | ||
| Three-vessel disease | 23 (28) | 14 (19) | ||
| Adverse plaque | 64 (77) | 39 (53) | 0.002 | |
| Positive remodelling | 64 (77) | 38 (51) | 0.001 | |
| Low-attenuation | 28 (34) | 11 (15) | 0.011 | |
| Napkin ring | 16 (19) | 6 (8) | 0.075 | |
| Spotty calcification | 32 (39) | 16 (22) | 0.034 | |
| Number of adverse plaques | 0 | 19 (23) | 35 (47) | 0.008 |
| 1 | 17 (21) | 15 (20) | ||
| 2 | 23 (28) | 11 (15) | ||
| 3+ | 24 (29) | 13 (18) | ||
| Quantitative plaque assessment | ||||
| Total plaque burden | 50.71 [46.76–54.72] | 48.98 [40.43–54.53] | 0.103 | |
| Total calcified burden | 2.99 [1.42–5.57] | 3.40 [0.95–7.87] | 0.983 | |
| Total non-calcified plaque burden | 46.26 [40.22–51.00] | 42.06 [35.61–48.67] | 0.016 | |
| Total low-attenuation burden | 7.03 [5.60–8.82] | 6.33 [4.34–9.06] | 0.091 | |
| Low-attenuation plaque burden >4% | 75 (90) | 57 (77) | 0.039 | |
Mean ±standard deviation; median [IQI]; number (%). Bold indicates statistical significance.
BMI, body mass index; CAS, coronary artery calcium score; CCTA, computed tomography coronary angiography; CHD, coronary heart disease; CVD, cerebrovascular disease; PVD, peripheral vascular disease.
Discussion
We have demonstrated that coronary artery disease, adverse plaque characteristics, and low-attenuation plaque are rare in patients with a coronary artery calcium score of zero, and frequent in those with elevated coronary artery calcium scores. At the other end of the spectrum of calcification, we have shown that adverse plaque characteristics and a high burden of low-attenuation plaque occur in over three-quarters of patients with high or very high calcium scores. This highlights the underlying reasons for the limited utility of calcium scoring in symptomatic patients, namely that it misses at-risk patients at both ends of the calcium spectrum. We have also shown that for the prediction of subsequent cardiac events, only the presence of a very high calcium score provides additive prognostic information to the quantification of low-attenuation plaque burden. Overall CCTA provides a more complete assessment of symptomatic patients presenting with suspected angina due to coronary artery disease.
In both symptomatic and asymptomatic patients,20,21 CT calcium scoring has excellent prognostic utility and can be used to stratify patients into risk groups3 and alter management.22 On CCTA, calcium scoring is a surrogate marker of plaque burden.2 In our study, a zero-calcium score was associated with good, but not perfect, long-term outcomes. The low risk associated with a zero-calcium score has been observed to persist for more than 14 years in patients over 60 years old,4 prompting previous studies to suggest that a zero-calcium score means that further investigation is not required, even in symptomatic populations.23,24 Nonetheless, in our analysis of symptomatic patients with stable chest pain symptoms, the presence of a zero-calcium score did not preclude the co-existence of obstructive disease, multivessel disease, or adverse plaque characteristics (Figure 5). Of the patients with a zero-calcium score, 2% had visually assessed adverse plaques and 13% had a quantitatively assessed low-attenuation plaque burden above the high-risk threshold of 4%. Previous studies have shown a similar frequency of adverse plaques25 and obstructive disease in patients with a zero-calcium score,26 and that a low or zero coronary calcium score does not rule out future cardiac events.27 Indeed, in our study, 10% of patients who experienced a myocardial infarction had a zero-calcium score and 7% had a normal CCTA. Therefore, in symptomatic patients, CCTA should be performed instead of coronary artery calcium scoring, because of the additional information it provides in terms of both plaque analysis and prognosis.
Figure 5.

Computed tomography coronary angiogram images from a 61-year-old man with a coronary artery calcium score of zero but a heavy burden of atherosclerotic plaque, including a high low-attenuation plaque burden of 9%. (A) A 3D reconstruction of the left anterior descending coronary artery with lumen in blue, non-calcified plaque in red, and low-attenuation plaque in orange. Curved planar reformation (B) and cross-sectional images (C, D) of the left anterior descending coronary artery show a severe stenosis with non-calcified plaque (orange arrow, C) and an adjacent plaque with a heavy burden of low-attenuation plaque (blue arrow, D).
At the other end of the scale, patients in our study with a very high calcium score had much worse outcomes, with the highest frequency of myocardial infarction, MACE, invasive coronary angiography, coronary revascularization, and all-cause mortality. Indeed, in multivariable analysis, a very high calcium score and low-attenuation plaque burden were the only independent predictors of subsequent myocardial infarction. While individual plaques with heavy calcification (>1000 AU) are relatively ‘stable’,28 the presence of a high coronary artery calcium score on a per patient level must be considered a marker of increased risk of subsequent events. These patients have more visually assessed adverse plaques, a higher low-attenuation plaque burden and, despite treatment optimized based on CCTA findings, they also had an increased risk of myocardial infarction and late MACE. This suggests a potential mechanism underlying the association between calcium score groupings and long-term outcomes, namely that high calcium scores are associated with a higher probability of the co-existence of adverse plaque features.
For patients with low or moderate calcium scores (10–400 AU), CCTA also provides additional information. A substantial proportion of patients in these groups have visual or quantitatively assessed adverse plaque phenotypes. These characteristics could be used to guide more aggressive medical therapy in these patients. This may be of particular importance in patients <40 years, who generally have low calcium scores29 but nevertheless have an increased risk of mortality with non-calcified plaque present even with a minimal calcium score.30 The assessment of non-calcified plaque burden and low-attenuation plaque may be of particular utility in such patients.
Recent research has advanced our understanding of coronary artery calcification beyond the Agatston score alone. The density, morphology, and distribution of calcified plaques have all been shown to be important in predicting the occurrence of subsequent outcomes31–33 and important sex differences in patterns of calcification have been established.34 Interestingly, heavily calcified plaques are not always an indicator of poor prognosis. Rosendael et al.28 observed that patients with an increased volume of calcified plaque with calcium score attenuation density above 1000 HU were at a lower risk of future acute coronary syndrome events. This phenotype of heavily calcified but stable plaque may account for the fact that 74% of the patients in our study who had the highest calcium score category did not suffer MACE during 5 years of follow-up. Positron emission tomography imaging with 18-F sodium fluoride has recently demonstrated promise in differentiating patients with advanced coronary atherosclerosis and high plaque burdens into those with inactive and active disease, which has important prognostic implications.35
This was a post-hoc study and there are some limitations. The number of events is low and limits analysis of further additional subgroups. The number of events in some subgroups of calcification is also small, which limits the conclusions that can be drawn from multivariable models and results in large confidence intervals. This reflects the low-to-intermediate risk population in the SCOT-HEART trial and the fact that treatment was optimized based on the CCTA results. Indeed, given that clinicians were provided with the CT findings, patients with more severe disease will have been treated more aggressively. Consequently, the event rates in patients with high CACS or plaque burden will have been attenuated by treatment interventions and the relative differences between sub-groups of disease severity are likely to be conservative. Image quality has the potential to impact both qualitative and quantitative CT plaque analysis. Moreover, in patients with a calcium score of zero, calcified plaque could be quantified on CCTA because of the technical differences in scan acquisition (3-mm compared to 0.5-mm slice thickness) and the underlying limitations of the Agatston score method. The Agatston coronary artery calcium score only assesses calcification above a size and density threshold, and does not include low density, small, or micro-calcification. Furthermore, we have only assessed Agatston coronary artery calcium score and not any of the new methods emerging in this area.26 Finally, our findings reflect a symptomatic population of patients presenting with stable chest pain. Our findings may therefore not be applicable to asymptomatic populations of individuals.
In conclusion, this study has shown that adverse plaque characteristics and low-attenuation plaque occur frequently in patients with a zero or low coronary artery calcium score, and these high-risk plaque features increase in frequency as calcium score increases. Patients with zero or minimal calcium score have a good, but not perfect, prognosis. Only a very high calcium score provided additive prognostic information to the low-attenuation plaque burden. We therefore contend that CCTA provides a more complete assessment of coronary artery disease than the calcium score alone, and provides better stratification of the risk of subsequent events in patients with stable chest pain.
Supplementary data
Supplementary data are available at European Heart Journal - Cardiovascular Imaging online.
Funding
This trial was funded by The Chief Scientist Office of the Scottish Government Health and Social Care Directorates (CZH/4/588), with supplementary awards from Edinburgh and Lothian’s Health Foundation Trust and the Heart Diseases Research Fund. M.O.G. was supported by a Carnegie Trust Vacation Scholarship (VAC009640). M.C.W., N.L.M., D.E.N., A.J.M and M.R.D. are supported by the British Heart Foundation (FS/ICRF/20/26002, CH/09/002, FS/11/014, FS/16/14/32023, RG/20/10/34966, RE/18/5/34216, RG/16/10/32375, FS/14/78/31020, AA/18/3/34220). N.L.M. was supported by the Butler Senior Clinical Research Fellowship (FS/16/14/32023) and a Research Excellence Award (RE/18/5/34216) from the British Heart Foundation. M.C.W. was supported by The Chief Scientist Office of the Scottish Government Health (PCL/17/04). D.E.N. is the recipient of a Wellcome Trust Senior Investigator Award (WT103782AIA). E.v.B. was supported by Scottish Imaging Network: A Platform of Scientific Excellence (SINAPSE). P.D.A. was supported by a National Heart Foundation of New Zealand Senior Fellowship (1844). M.R.D. was supported by the Sir Jules Thorn Biomedical Research Award 2015 (15/JTA). The Royal Bank of Scotland supported the provision of 320-multidetector CT for NHS Lothian and the University of Edinburgh. The Edinburgh Imaging facility QMRI (Edinburgh) was supported by the National Health Service Research Scotland (NRS) through National Health Service Lothian Health Board. The Clinical Research Facility Glasgow and Clinical Research Facility Tayside are supported by National Health Service Research Scotland (NRS). P.M. and D.D. are supported by National Institute of Health/National Heart, Lung, and Blood Institute grants (1R01HL148787-01A1 and 1R01HL151266). S.C. was supported by the Miriam and Sheldon G. Adelson Medical Research Foundation.
Supplementary Material
Contributor Information
Maia Osborne-Grinter, BHF Centre for Cardiovascular Science, University of Edinburgh, Chancellor’s Building, 49 Little France Crescent, Edinburgh, EH164SB, UK.
Jacek Kwiecinski, BHF Centre for Cardiovascular Science, University of Edinburgh, Chancellor’s Building, 49 Little France Crescent, Edinburgh, EH164SB, UK; Department of Interventional Cardiology and Angiology, Institute of Cardiology, Warsaw, Poland.
Mhairi Doris, BHF Centre for Cardiovascular Science, University of Edinburgh, Chancellor’s Building, 49 Little France Crescent, Edinburgh, EH164SB, UK.
Priscilla McElhinney, Biomedical Imaging Research Institute, Cedars-Sinai Medical Centre, Los Angeles, CA, USA.
Sebastien Cadet, Biomedical Imaging Research Institute, Cedars-Sinai Medical Centre, Los Angeles, CA, USA.
Philip D Adamson, BHF Centre for Cardiovascular Science, University of Edinburgh, Chancellor’s Building, 49 Little France Crescent, Edinburgh, EH164SB, UK; Christchurch Heart Institute, University of Otago, Christchurch, New Zealand.
Alastair J Moss, NIHR Leicester Biomedical Research Centre and Department of Cardiovascular Sciences, University of Leicester, Leicester, UK.
Shirjel Alam, BHF Centre for Cardiovascular Science, University of Edinburgh, Chancellor’s Building, 49 Little France Crescent, Edinburgh, EH164SB, UK.
Amanda Hunter, BHF Centre for Cardiovascular Science, University of Edinburgh, Chancellor’s Building, 49 Little France Crescent, Edinburgh, EH164SB, UK.
Anoop S V Shah, Department of non-communicable disease epidemiology, London School of Hygiene and Tropical Medicine, London, UK.
Nicholas L Mills, BHF Centre for Cardiovascular Science, University of Edinburgh, Chancellor’s Building, 49 Little France Crescent, Edinburgh, EH164SB, UK; Usher Institute, University of Edinburgh, Edinburgh, UK.
Tania Pawade, BHF Centre for Cardiovascular Science, University of Edinburgh, Chancellor’s Building, 49 Little France Crescent, Edinburgh, EH164SB, UK.
Chengjia Wang, BHF Centre for Cardiovascular Science, University of Edinburgh, Chancellor’s Building, 49 Little France Crescent, Edinburgh, EH164SB, UK.
Jonathan R Weir-McCall, Department of Radiology, University of Cambridge, Cambridge, UK.
Giles Roditi, Institute of Cardiovascular & Medical Sciences, Glasgow University, Glasgow, UK.
Edwin J R van Beek, BHF Centre for Cardiovascular Science, University of Edinburgh, Chancellor’s Building, 49 Little France Crescent, Edinburgh, EH164SB, UK; Edinburgh Imaging Facility QMRI, University of Edinburgh, Edinburgh, UK.
Leslee J Shaw, Weill Cornell Medical College, New York, NY, USA.
Edward D Nicol, Department of Cardiology, Royal Brompton and Harefield NHS Foundation Trust, London, UK; Faculty of Medicine, National Heart and Lung Institute, Imperial College, London, UK.
Daniel Berman, Biomedical Imaging Research Institute, Cedars-Sinai Medical Centre, Los Angeles, CA, USA.
Piotr J Slomka, Biomedical Imaging Research Institute, Cedars-Sinai Medical Centre, Los Angeles, CA, USA.
David E Newby, BHF Centre for Cardiovascular Science, University of Edinburgh, Chancellor’s Building, 49 Little France Crescent, Edinburgh, EH164SB, UK; Edinburgh Imaging Facility QMRI, University of Edinburgh, Edinburgh, UK.
Marc R Dweck, BHF Centre for Cardiovascular Science, University of Edinburgh, Chancellor’s Building, 49 Little France Crescent, Edinburgh, EH164SB, UK; Edinburgh Imaging Facility QMRI, University of Edinburgh, Edinburgh, UK.
Damini Dey, Biomedical Imaging Research Institute, Cedars-Sinai Medical Centre, Los Angeles, CA, USA.
Michelle C Williams, BHF Centre for Cardiovascular Science, University of Edinburgh, Chancellor’s Building, 49 Little France Crescent, Edinburgh, EH164SB, UK; Edinburgh Imaging Facility QMRI, University of Edinburgh, Edinburgh, UK.
References
- 1. Sarwar A, Shaw LJ, Shapiro MD, Blankstein R, Hoffmann U, Cury RCet al. Diagnostic and prognostic value of absence of coronary artery calcification. JACC Cardiovasc Imaging 2009;2:675–88. [DOI] [PubMed] [Google Scholar]
- 2. Takamura K, Fujimoto S, Kondo T, Hiki M, Kawaguchi Y, Kato Eet al. Incremental prognostic value of coronary computed tomography angiography: high-risk plaque characteristics in asymptomatic patients. J Atheroscler Thromb 2017;24:1174–85. [DOI] [PMC free article] [PubMed] [Google Scholar]
- 3. Williams MC, Moss AJ, Dweck M, Adamson PD, Alam S, Hunter Aet al. Coronary artery plaque characteristics associated with adverse outcomes in the SCOT-HEART study. J Am Coll Cardiol 2019;73:291–301. [DOI] [PMC free article] [PubMed] [Google Scholar]
- 4. Valenti VBO, Heo R, Cho I, Schulman-Marcus J, Gransar H, Truong QAet al. A 15-year warranty period for asymptomatic individuals without coronary artery calcium: a prospective follow-up of 9,715 individuals. JACC Cardiovasc Imaging 2015;8:900–9. [DOI] [PMC free article] [PubMed] [Google Scholar]
- 5. Hecht HS, Blaha MJ, Kazerooni EA, Cury RC, Budoff M, Leipsic Jet al. CAC-DRS: coronary artery calcium data and reporting system. An expert consensus document of the Society of Cardiovascular Computed Tomography (SCCT). J Cardiovasc Comput Tomogr 2018;12:185–91. [DOI] [PubMed] [Google Scholar]
- 6. Williams MC, Kwiecinski J, Doris M, McElhinney P, D’Souza MS, Cadet Set al. Low-attenuation noncalcified plaque on coronary computed tomography angiography predicts myocardial infarction: results from the multicenter SCOT-HEART Trial (Scottish Computed Tomography of the HEART). Circulation 2020;141:1452–62. [DOI] [PMC free article] [PubMed] [Google Scholar]
- 7. SCOT-HEART Investigators . CT coronary angiography in patients with suspected angina due to coronary heart disease (SCOT-HEART): an open-label, parallel-group, multicentre trial. Lancet 2015;385:2383–91. [DOI] [PubMed] [Google Scholar]
- 8. Newby DE, Adamson PD, Berry C, Boon NA, Dweck MR, Flather Met al. ; SCOT-HEART Investigators . Coronary CT angiography and 5-year risk of myocardial infarction. N Engl J Med 2018;379:924–33. [DOI] [PubMed] [Google Scholar]
- 9. Williams MC, Hunter A, Shah ASV, Assi V, Lewis S, Smith Jet al. Use of coronary computed tomographic angiography to guide management of patients with coronary disease. J Am Coll Cardiol 2016;67:1759–68. [DOI] [PMC free article] [PubMed] [Google Scholar]
- 10. Newby DE, Williams MC, Flapan AD, Forbes JF, Hargreaves AD, Leslie SJet al. Role of multidetector computed tomography in the diagnosis and management of patients attending the rapid access chest pain clinic, The Scottish computed tomography of the heart (SCOT-HEART) trial: study protocol for randomized controlled trial. Trials 2012;13:184. [DOI] [PMC free article] [PubMed] [Google Scholar]
- 11. Woodward M, Brindle P, Tunstall-Pedoe H, Estimation S, SIGN group on risk estimation . Adding social deprivation and family history to cardiovascular risk assessment: the ASSIGN score from the Scottish Heart Health Extended Cohort (SHHEC). Heart 2007;93:172–6. [DOI] [PMC free article] [PubMed] [Google Scholar]
- 12. Agatston AS, Janowitz WR, Hildner FJ, Zusmer NR, Viamonte M Jr, Detrano R.. Quantification of coronary artery calcium using ultrafast computed tomography. J Am Coll Cardiol 1990;15:827–32. [DOI] [PubMed] [Google Scholar]
- 13. Williams MC, Golay SK, Hunter A, Weir-McCall JR, Mlynska L, Dweck MRet al. Observer variability in the assessment of CT coronary angiography and coronary artery calcium score: substudy of the Scottish COmputed Tomography of the HEART (SCOT-HEART) trial. Open Heart 2015;2:e000234. [DOI] [PMC free article] [PubMed] [Google Scholar]
- 14. Motoyama S, Sarai M, Harigaya H, Anno H, Inoue K, Hara Tet al. Computed tomographic angiography characteristics of atherosclerotic plaques subsequently resulting in acute coronary syndrome. J Am Coll Cardiol 2009;54:49–57. [DOI] [PubMed] [Google Scholar]
- 15. Dey D, Diaz Zamudio M, Schuhbaeck A, Juarez Orozco LE, Otaki Y, Gransar Het al. Relationship between quantitative adverse plaque features from coronary computed tomography angiography and downstream impaired myocardial flow reserve by 13N-ammonia positron emission tomography: a pilot study. Circ Cardiovasc Imaging 2015;8:e003255. [DOI] [PMC free article] [PubMed] [Google Scholar]
- 16. Maurovich-Horvat P, Schlett CL, Alkadhi H, Nakano M, Otsuka F, Stolzmann Pet al. The napkin-ring sign indicates advanced atherosclerotic lesions in coronary CT angiography. JACC Cardiovasc Imaging 2012;5:1243–52. [DOI] [PubMed] [Google Scholar]
- 17. Ovrehus KA, Schuhbaeck A, Marwan M, Achenbach S, Norgaard BL, Botker HEet al. Reproducibility of semi-automatic coronary plaque quantification in coronary CT angiography with sub-mSv radiation dose. J Cardiovasc Comput Tomogr 2016;10:114–20. [DOI] [PubMed] [Google Scholar]
- 18. Dey D, Cheng VY, Slomka PJ, Nakazato R, Ramesh A, Gurudevan Set al. Automated 3-dimensional quantification of noncalcified and calcified coronary plaque from coronary CT angiography. J Cardiovasc Comput Tomogr 2009;3:372–82. [DOI] [PubMed] [Google Scholar]
- 19. Matsumoto H, Watanabe S, Kyo E, Tsuji T, Ando Y, Otaki Yet al. volumetric plaque quantification and characterization from coronary CT angiography: a head-to-head comparison with invasive intravascular ultrasound. Eur Radiol 2019;29:6129–39. [DOI] [PMC free article] [PubMed] [Google Scholar]
- 20. McClelland RL, Chung H, Detrano R, Post W, Kronmal RA.. Distribution of coronary artery calcium by race, gender, and age: results from the Multi-Ethnic Study of Atherosclerosis (MESA). Circulation 2006;113:30–7. [DOI] [PubMed] [Google Scholar]
- 21. Shah S, Bellam N, Leipsic J, Berman DS, Quyyumi A, Hausleiter Jet al. ; for the CONFIRM (COronary CT Angiography EvaluatioN For Clinical Outcomes: An InteRnational Multicenter Registry) Investigators . Prognostic significance of calcified plaque among symptomatic patients with nonobstructive coronary artery disease. J Nucl Cardiol 2014;21:453–66. [DOI] [PMC free article] [PubMed] [Google Scholar]
- 22. van der Aalst CM, Denissen S, Vonder M, Gratama JWC, Adriaansen HJ, Kuijpers Det al. Screening for cardiovascular disease risk using traditional risk factor assessment or coronary artery calcium scoring: the ROBINSCA trial. Eur Heart J Cardiovasc Imaging 2020;21:1216–24. [DOI] [PubMed] [Google Scholar]
- 23. Mittal TK, Pottle A, Nicol E, Barbir M, Ariff B, Mirsadraee Set al. Prevalence of obstructive coronary artery disease and prognosis in patients with stable symptoms and a zero-coronary calcium score. Eur Heart J Cardiovasc Imaging 2017;18:922–9. [DOI] [PMC free article] [PubMed] [Google Scholar]
- 24. Chaikriangkrai K, Velankar P, Schutt R, Alchalabi S, Nabi F, Mahmarian Jet al. Additive prognostic value of coronary artery calcium score over coronary computed tomographic angiography stenosis assessment in symptomatic patients without known coronary artery disease. Am J Cardiol 2015;115:738–44. [DOI] [PubMed] [Google Scholar]
- 25. Senoner T, Plank F, Beyer C, Langer C, Birkl K, Steinkohl Fet al. Does coronary calcium score zero reliably rule out coronary artery disease in low-to-intermediate risk patients? A coronary CTA study. J Cardiovasc Comput Tomogr 2020;14:155–61. [DOI] [PubMed] [Google Scholar]
- 26. Rubinshtein R, Gaspar T, Halon DA, Goldstein J, Peled N, Lewis BS.. Prevalence and extent of obstructive coronary artery disease in patients with zero or low calcium score undergoing 64-slice cardiac multidetector computed tomography for evaluation of a chest pain syndrome. Am J Cardiol 2007;99:472–5. [DOI] [PubMed] [Google Scholar]
- 27. Peng AW, Mirbolouk M, Orimoloye OA, Osei AD, Dardari Z, Dzaye Oet al. Long-term all-cause and cause-specific mortality in asymptomatic patients with CAC >/=1,000: results from the CAC Consortium. JACC Cardiovasc Imaging 2020;13:83–93. [DOI] [PMC free article] [PubMed] [Google Scholar]
- 28. van Rosendael AR, Narula J, Lin FY, van den Hoogen IJ, Gianni U, Al Hussein Alawamlh Oet al. Association of high-density calcified 1K plaque with risk of acute coronary syndrome. JAMA Cardiol 2020;5:282–90. [DOI] [PMC free article] [PubMed] [Google Scholar]
- 29. de Ronde MWJ, Khoshiwal A, Planken RN, Boekholdt SM, Biemond M, Budoff MJet al. A pooled-analysis of age and sex based coronary artery calcium scores percentiles. J Cardiovasc Comput Tomogr 2020;14:414–20. [DOI] [PubMed] [Google Scholar]
- 30. Blaha MJ, Cainzos-Achirica M, Dardari Z, Blankstein R, Shaw LJ, Rozanski A, Rumberger JA, Dzaye Oet al. All-cause and cause-specific mortality in individuals with zero and minimal coronary artery calcium: a long-term, competing risk analysis in the Coronary Artery Calcium Consortium. Atherosclerosis 2020;294:72–9. [DOI] [PMC free article] [PubMed] [Google Scholar]
- 31. Nakanishi R, Delaney JA, Post WS, Dailing C, Blaha MJ, Palella Fet al. novel density-volume calcium score by non-contrast CT predicts coronary plaque burden on coronary CT angiography: results from the MACS (Multicenter AIDS cohort study). J Cardiovasc Comput Tomogr 2020;14:266–71. [DOI] [PMC free article] [PubMed] [Google Scholar]
- 32. Foldyna B, Eslami P, Scholtz JE, Baltrusaitis K, Lu MT, Massaro JMet al. Density and morphology of coronary artery calcium for the prediction of cardiovascular events: insights from the Framingham Heart Study. Eur Radiol 2019;29:6140–8. [DOI] [PMC free article] [PubMed] [Google Scholar]
- 33. Criqui MH, Denenberg JO, Ix JH, McClelland RL, Wassel CL, Rifkin DEet al. Calcium density of coronary artery plaque and risk of incident cardiovascular events. JAMA 2014;311:271–8. [DOI] [PMC free article] [PubMed] [Google Scholar]
- 34. Shaw LJ, Min JK, Nasir K, Xie JX, Berman DS, Miedema MDet al. Sex differences in calcified plaque and long-term cardiovascular mortality: observations from the CAC Consortium. Eur Heart J 2018;39:3727–35. [DOI] [PMC free article] [PubMed] [Google Scholar]
- 35. Kwiecinski J, Tzolos E, Adamson PD, Cadet S, Moss AJ, Joshi Net al. Coronary (18)F-sodium fluoride uptake predicts outcomes in patients with coronary artery disease. J Am Coll Cardiol 2020;75:3061–74. [DOI] [PMC free article] [PubMed] [Google Scholar]
Associated Data
This section collects any data citations, data availability statements, or supplementary materials included in this article.