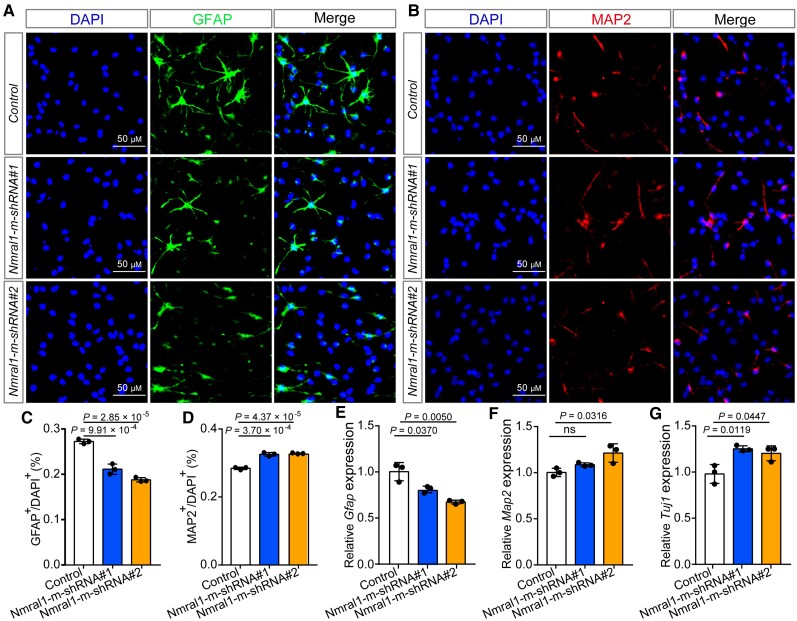
Figure 5.
Nmral1 knockdown affects differentiation of mNSCs. (A and B) Representative immunofluorescence staining images for glia cells and neurons differentiated from mNSCs. GFAP-positive cells were marked with green, MAP2-positive cells with red and the nuclei were stained with DAPI. (C) Quantification for the proportion of GFAP-positive glia cells. (D) Quantification for the proportion of MAP2-positive neurons. (E–G) qPCR showed the relative expression level of Gfap, Map2 and Tuj1 in control and Nmral1 knocked-down mNSCs. Unpaired two-tailed Student’s t-test was used to compare if the difference was significant. n = 3, data are presented as mean ± SD. ns = not significant.

