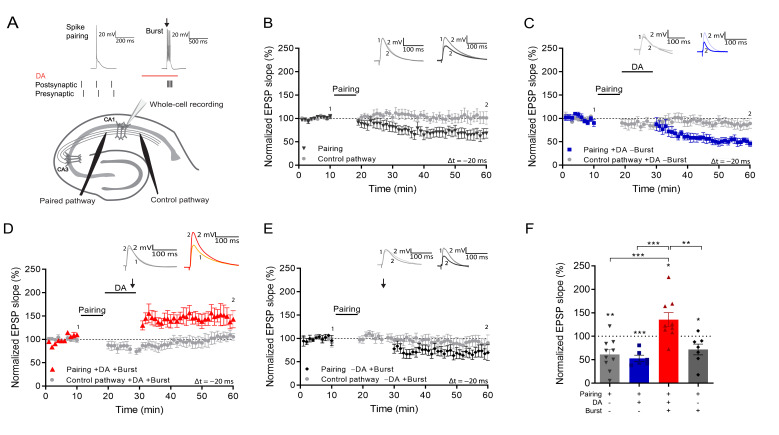
Figure 1. Postsynaptic burst reactivation induces LTP in the presence of dopamine (DA).
(A), Schematic of the experimental paradigm (top) and setup (bottom).↓=6 action potential bursts; Whole-cell recording in CA1 stratum pyramidale; electrical stimulation electrodes in stratum radiatum. Plasticity was induced in one pathway (Paired pathway), and a second pathway was used for stability control and for confirmation of input specificity (Control pathway). Normalized EPSP slopes were averaged and plotted as a function of time. (B), Post-before pre-pairing protocol leads to input-specific synaptic depression. Pairing protocol (Δt = –20 ms) induces t-LTD (black trace) and does not affect synaptic weights in control pathway (gray trace). (C), DA application after a post-before-pre pairing protocol (Δt = –20 ms) does not prevent t-LTD (+DA –Burst, blue trace) and does not affect synaptic weights in control pathway (gray trace). (D), Application of DA together with action potential bursts of the postsynaptic cell (indicated by black arrow) induces synaptic potentiation after a post-before-pre pairing protocol (Δt = –20 ms) (+DA +Burst, red trace) and does not affect synaptic weights in control pathway (gray trace). (E), The same protocol, without application of DA, leads to synaptic depression (–DA +Burst, black trace) and does not affect synaptic weights in control pathway (gray trace). (F), Summary of results. All traces show an EPSP before (1) and 40 min after pairing (2). Plots show averages of normalized EPSP slopes ± SEM.

