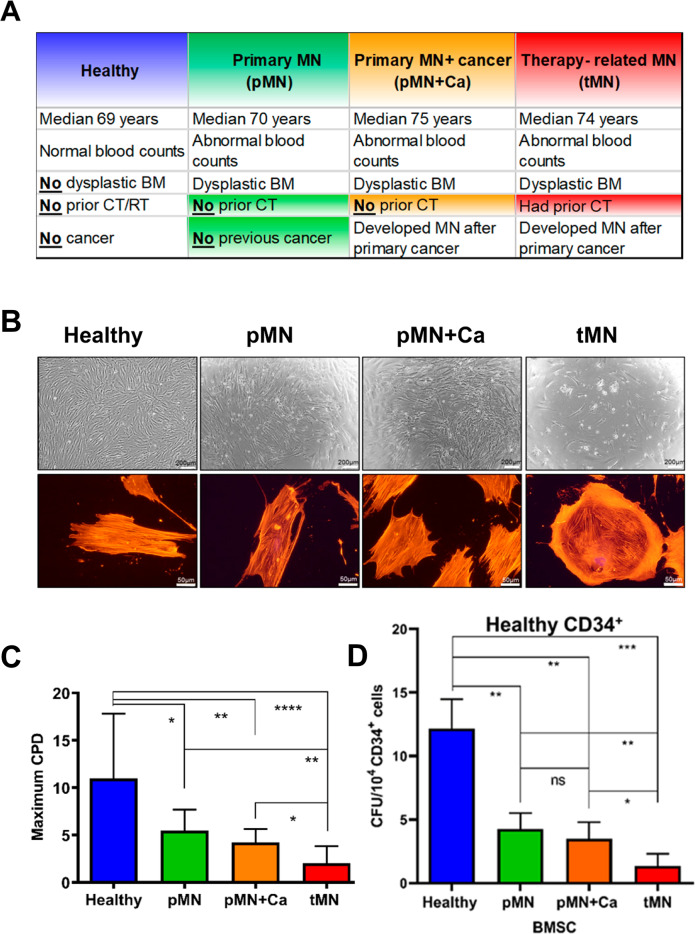
Fig. 1. Aberrant morphology and growth kinetics of bone marrow mesenchymal stromal cells (BMSC) isolated from therapy-related myeloid neoplasms (tMN) patients.
A Crucial differences between carefully selected four cohorts (Healthy n = 17; pMN n = 7; pMN+Ca; n = 10; tMN n = 18); B representative micrographs of BMSC morphology assessed by light microscopy (upper panel) and cytoskeleton by TRITC-Phalloidin stain (lower panel). Scale bars indicate 200 μm and 50 μm respectively; C maximum cumulative population doublings (CPD); D in vitro HSC supportive capacity of BMSC assessed by co-culturing Healthy (blue bar; n = 2), pMN (green bar; n = 2), pMN+Ca (orange bar; n = 2) and tMN (red bar; n = 6) BMSC with Healthy CD34+ cells for 7 weeks followed by clonogenic assays. All bars indicate mean, and all error bars indicate SD. Mann–Whitney test was used to detect statistically significant differences between cohorts. Asterisks display P values *P < 0.05, **P < 0.01, ***P < 0.001, **** P < 0.0001.

