

Abstract
Background:
The association between stroke and dementia is well established. Less is known about this association in underrepresented ethnic groups. In a large ethnically diverse cohort we examined whether history of stroke was associated with cognitive impairment, and whether this relationship differed by ethnicity (Mexican American [MA] vs non-Hispanic White [NHW]).
Methods:
This was a population-based cohort study conducted in Nueces County, Texas, USA, a bi-ethnic community with a large and primarily non-immigrant MA population. Residents age ≥65 were recruited door-to-door or by telephone between May 2018 and December 2021. The primary exposure was history of stroke, obtained by self-report. Demographic, medical, and educational histories were also obtained. The primary outcome was the Montreal Cognitive Assessment (MoCA), a scale that evaluates multiple domains of cognitive performance. Scores were divided into three ordinal categories, roughly corresponding to normal cognition (MoCA 26–30), mild cognitive impairment (MoCA 20–25), or probable dementia (MoCA 0–19).
Results:
1,801 participants completed MoCA screening (55% female; 50% MA, 44% NHW, 6% other), of whom 12.4% reported history of stroke. Stroke prevalence was similar across ethnicities (X2 2.1, p=0.34). In a multivariable cumulative logit regression model for the ordinal cognition outcome, a stroke by ethnicity interaction was observed (p=0.01). Models stratified by ethnicity revealed that stroke was associated with cognitive impairment across ethnicities, but had greater impact on cognition in NHWs (cOR=3.81, 95% CI 2.37–6.12) than in MAs (cOR=1.58, 95% CI 1.04–2.41). Increased age and lower educational attainment were also associated with cognitive impairment, regardless of ethnicity.
Conclusions:
History of stroke was associated with increased odds of cognitive impairment after controlling for other factors in both MA and NHW participants. The magnitude of the impact of stroke on cognition was less in MA than in NHW participants.
Graphical Abstract
Introduction
Stroke is a leading cause of disability, much of which is related to cognitive impairment or dementia.1–3 Dementia is an important health problem that leads to reduced quality of life, caregiver burden, and significant economic cost.4–7 Worldwide, vascular dementia is the second leading type of dementia behind Alzheimer’s disease,8 though post-mortem studies suggest that most dementia cases are of mixed pathology, and demonstrate at least some component of cerebrovascular disease.9, 10
Onset of cognitive impairment or dementia following stroke has been well described, though many studies have involved hospital-based cohorts which may limit generalizability.11, 12 A number of population-based studies have been conducted, generally demonstrating an approximate doubling of the risk of dementia after stroke.13–24 The majority of these studies were conducted between the 1960s and early 2000s and primarily included White individuals of European descent. There is little information on the association of stroke and cognitive impairment in underrepresented ethnic groups relative to non-Hispanic Whites (NHWs).
Given demographic shifts toward an older and more diverse US population in the coming years,25 we sought to explore the association between stroke and cognitive outcomes in a contemporary cohort in Nueces County, Texas, USA, a bi-ethnic community with a large and primarily non-immigrant Mexican American (MA) population.
Methods
Reasonable requests for data sharing sent to the corresponding author will be considered by the study team based on IRB approvals, data sharing agreements and the scientific rigor of the study proposed.
Study Population
The study procedures were approved by the institutional review board of the University of Michigan. Verbal informed consent was obtained from participants. Detailed methods of the Brain Attack Surveillance in Corpus Christi (BASIC) - Cognitive Study have been published previously.26 Briefly, BASIC-Cognitive is an ongoing study conducted in Nueces County, which is located on the Texas Gulf Coast, has a large and mostly non-immigrant MA population, and is mostly urban with a majority of the population residing within the city of Corpus Christi.27 Participants were eligible if they were residents of Nueces County for at least 6 months of the year, were 65 years or older, spoke English or Spanish, and were community-dwelling or residents of a nursing-care facility. Of note, the BASIC-Cognitive Study is separate from BASIC, an ongoing stroke surveillance study in the same community. BASIC-Cognitive participants reflected a random sample from the community, independent of participation in the BASIC stroke surveillance study.
The exposure of interest was a binary measure of a self-reported history of stroke (1=yes, 0=no), which has been demonstrated to be a valid indicator of clinical stroke history.28 The primary outcome was cognitive status as measured by the Montreal Cognitive Assessment (MoCA), a cognitive screening scale that scores multiple domains of cognitive function with aggregate scores ranging from 0 to 30, and lower scores indicating worse performance.29 The MoCA was administered in either English or Spanish based on each participant’s preference. Our sample had a high frequency of balanced bilingualism, and there were infrequent cases where a participant requested instructions in the other language and/or requested to switch the language of the assessment. These were coded as being administered in “both” languages.
Covariates included demographic factors, medical history, and educational attainment, all obtained by self-report. Demographic factors included age (categorized as 65–69, 70–74, 75–79, 80–84, and 85+), sex, assessment language (English, Spanish, both), residence (community dwelling or nursing home resident), self-reported race (Black, White, Asian or Pacific Islander, American Indian or Alaskan Indian, other), and self-reported ethnicity (of Hispanic origin, not of Hispanic origin, other). Participants who reported ‘not of Hispanic origin’ and ‘White’ are classified as ‘Non-Hispanic White’ in the analysis. Participants who reported ‘of Hispanic origin’ for the ethnicity question are classified as ‘MA’ in the analysis, as nearly all those of Hispanic ethnicity in this community are of Mexican ancestry.27 Subsequent analyses were restricted to MA and NHW participants due to low numbers of those in the community of other racial/ethnic categories. Medical history included self-reported history of hypertension, diabetes, heart disease, dementia, smoking (current smoker, yes or no), and alcohol use (drinks per week). We also obtained level of educational attainment (less than high school, high school diploma, college degree).
Sample Data
Eligible study participants were identified from two-stage equal probability samples of Nueces County housing units and living spaces in nursing home facilities. Due to restrictions imposed by the March 2020 onset of the COVID 19 pandemic, data collection for the study was conducted in two phases. In the first phase (May 2018-March 2020), field personnel contacted each sampled address or nursing facility room in person and conducted a “door step” screening interview to determine if any of the occupants were 65+. Age-eligible occupants were then asked to complete a MoCA cognitive screen. Individuals who agreed to participate in the MoCA screen also provided basic information on their demographic characteristics, education level, and medical history.
Beginning April 2020, COVID-19 restrictions on population research protocols prohibited direct contact with potential participants. Since baseline study accrual was only 2/3rds complete at this point, recruitment shifted to a telephone screening protocol. A second equal-probability sample of Nueces County household addresses was selected and a commercial supplier matched this sample of addresses to a second data base of telephone numbers. The field team then attempted to contact each sampled household using the telephone number information that had been matched to the sample address. Contacted households were screened by phone for age-eligible occupants 65+. Age-eligible occupants were asked to complete a reduced telephone version of the full MoCA (T-MoCA) with a score range of 0–22 that excludes test items that require a visual presentation.30 The full MoCA and T-MoCA have both been validated as screening tools for cognitive dysfunction in stroke patients,31, 32 and among diverse community samples.30
Scores for participants who completed the T-MoCA screen were converted to the full MoCA scale (0–30) using the equi-percentile “mapping” of scores provided by Katz, et al.30 Based on the harmonized MoCA and T-MOCA scores, each participant was assigned to one of three ordinal categories of cognitive status, roughly corresponding to normal cognition (MoCA 26–30), mild cognitive impairment (MoCA 20–25), or probable dementia (MoCA 0–19).29, 33, 34 All but 24 subjects who were so cognitively impaired that they could not provide or refuse assent (IRB approved waive assent group) had complete data needed to compute MoCA or t-MoCA scores. Since the assent waiver applied to participants with serious cognitive deficits, the 24 subjects who waived assent were assigned to the lowest cognitive category (MoCA 0–19).
Statistical Analysis
To address potential selection bias in the probability samples of age-eligible persons who agreed to complete the MoCA screening, inverse propensity weighting (IPW) methodology35 was employed to calibrate the study sample to Nueces County population estimates by age, sex, race, ethnicity and education level derived from the U.S. Bureau of Census 2015–2019 American Community Survey (ACS) data. These case-specific IPW population weights were employed in all descriptive and multivariate analyses reported in the text and tables of this paper.
All study subjects had non-missing responses to the medical history variables. Small amounts of item missing data for demographic variables (<1%) were singly imputed using SAS Proc MI prior to analysis.
Univariate descriptive analyses were conducted to estimate weighted means and percentages for the sampled population. Cross tabulations and Pearson Chi-square tests were conducted to test for simple association between the ordinal categories of cognitive status and self-reported history of stroke. Multivariable (cumulative logit) logistic regression models36 were fitted to the three-category, ordinal measure of cognitive status to assess the relationship to self-reported stroke history. In a sequence of model building steps, the effects of controlling for demographic variables (age, sex, ethnicity, education) and participants’ medical history (diabetes, cardiovascular disease, hypertension) were evaluated. Ethnicity by stroke interaction terms were then added. Similar steps were taken in generating multivariable logistic regression models stratified by ethnicity for MAs and NHWs. All analyses were conducted using the Survey procedures in SAS V9.4 to account for the influence of the population weights on the standard errors and confidence intervals for estimates and model parameters.
This manuscript adheres to the AHA Journals Racial and Ethnic Disparities Reporting Guidelines and the Strengthening the Reporting of Observational Studies in Epidemiology guidelines (see Supplemental Materials).37
Results
Baseline characteristics of the study population overall and stratified by ethnicity are presented in Table 1 and a participant flow diagram is available in Supplemental Materials. There was a total of 1,801 participants, of whom 1,261 (70%) completed an in person screening, and 540 (30%) completed a telephone screening. The median (IQR) age was 72 (68–78). There were 987 (50%) MA participants, 728 (44%) NHW participants, and 86 (6%) participants of other ethnicities. Overall, 225 (12.4%) reported history of stroke. Crude prevalence of stroke history was 12.3% for NHW, 12.0% for MA, and 17.2% for participants of other ethnicities (X2 2.1, p=0.34). A wide range of MoCA scores was observed, with 492 (30%) scoring 26–30, 688 (39%) scoring 20–25, and 621 (32%) scoring 0–19. The median (IQR) MoCA score for those with no history of stroke was 23 (18–26), compared to 19 (14–23) for those with history of stroke.
Table 1.
Baseline characteristics of participants with and without history of stroke*
| All (n=1,801) | MA (n=987) | NHW (n=728) | ||||
|---|---|---|---|---|---|---|
| No history of stroke (n=1,576) | History of stroke (n=225) | No history of stroke (n=868) | History of stroke (n=119) | No history of stroke (n=637) | History of stroke (n=91) | |
| Age, median (IQR) | 72 (68, 78) | 73 (68, 80) | 71 (67, 77) | 72 (67, 79) | 73 (68, 79) | 75 (70, 81) |
| Female (%) | 966 (57) | 114 (45) | 569 (62) | 60 (44) | 361 (52) | 47 (47) |
| Race (%) | ||||||
| White | 1,457 (95) | 198 (92) | - | - | - | - |
| Black | 67 (4) | 14 (6) | - | - | - | - |
| Asian/AIAN/NHPI | 52 (1) | 13 (2) | - | - | - | - |
| Ethnicity (%) | ||||||
| NHW | 637 (44) | 91 (44) | - | - | - | - |
| Hispanic | 868 (50) | 119 (48) | - | - | - | - |
| Other | 71 (6) | 15 (8) | - | - | - | - |
| Language (%) | ||||||
| English | 1,350 (87) | 202 (90) | 652 (75) | 96 (79) | 637 (100) | 91 (100) |
| Spanish | 200 (12) | 19 (9) | 192 (22) | 19 (18) | 0 (0) | 0 (0) |
| Both | 26 (2) | 4 (2) | 24 (3) | 4 (4) | 0 (0) | 0 (0) |
| Educational attainment (%) | ||||||
| Less than HS | 434 (26) | 65 (29) | 390 (45) | 57 (50) | 26 (4) | 4 (4) |
| HS diploma | 744 (46) | 109 (46) | 357 (39) | 49 (37) | 349 (52) | 52 (55) |
| College degree | 398 (29) | 51 (25) | 121 (16) | 13 (12) | 262 (44) | 53 (40) |
| Hypertension (%) | 1,060 (67) | 176 (79) | 621 (72) | 98 (84) | 377 (59) | 63 (69) |
| Diabetes (%) | 519 (32) | 101 (46) | 364 (42) | 61 (53) | 126 (20) | 32 (36) |
| Heart disease (%) | 321 (20) | 109 (49) | 159 (18) | 56 (47) | 143 (22) | 47 (52) |
| MoCA score, median (IQR) | 23 (18, 26) | 19 (14, 23) | 21 (16–24) | 18 (13–22) | 25 (22–27) | 21 (17–24) |
Abbreviations: IQR, interquartile range; AIAN, American Indian and Alaska Natives; NHPI, Native Hawaiian and other Pacific Islander; MA, Mexican American; NHW, non-Hispanic White; HS, high school. Unweighted counts are reported for categorical variables. Median, IQR, and percentages are estimated with the population weights developed using an inverse propensity weighting methodology.
The ordinal logistic regression model parameters expressed as cumulative odds ratios and the corresponding 95% confidence intervals are presented in Table 2. In comparison to the reference category for a model predictor, the cumulative odds ratios are estimates of the odds that individuals in a given predictor category had a MoCA score in a lower functioning category. For example, the estimated cumulative odds ratio for NHW participants who reported a history of stroke was cOR=3.81—over three times the odds of having a MoCA score in the 20–25 range versus the 26–30 range and also over three times the odds of a MoCA score<20 versus a score of 20–25.36
Table 2.
Predictors of cognitive impairment in multivariable ordinal logistic regression models stratified by ethnicity*
| MA | NHW | |||
|---|---|---|---|---|
| Minimally adjusted model | Fully adjusted model | Minimally adjusted model | Fully adjusted model | |
| cOR (95% CI) | cOR (95% CI) | cOR (95% CI) | cOR (95% CI) | |
| History of stroke | 1.74 (1.15–2.63) | 1.58 (1.04–2.41) | 4.09 (2.57–6.52) | 3.81 (2.37–6.12) |
| Age (reference = 65–69) | ||||
| 70–74 | 1.01 (0.73–1.41) | 0.98 (0.70–1.36) | 1.09 (0.71–1.67) | 1.04 (0.68–1.60) |
| 75–79 | 2.27 (1.55–3.34) | 2.25 (1.53–3.31) | 1.57 (1.02–2.41) | 1.49 (0.97–2.30) |
| 80–84 | 3.24 (2.04–5.15) | 3.19 (2.00–5.07) | 3.67 (2.28–5.91) | 3.59 (2.23–5.78) |
| 85+ | 11.50 (6.50–20.36) | 11.76 (6.64–20.85) | 9.81 (5.33–14.89) | 8.70 (5.18–14.62) |
| Female sex | 0.78 (0.60–1.03) | 0.83 (0.63–1.09) | 0.84 (0.62–1.14) | 0.89 (0.65–1.19) |
| Education (reference = college degree) | ||||
| Less than high school | 11.08 (7.26–16.91) | 10.69 (7.00–16.35) | 7.05 (3.45–14.40) | 7.10 (3.44–14.67) |
| High school diploma | 2.60 (1.79–3.76) | 2.55 (1.75–3.70) | 3.21 (2.33–4.41) | 3.12 (2.26–4.29) |
| History of diabetes | - | 1.31 (0.99–1.72) | - | 1.35 (0.94–1.96) |
| History of heart disease | - | 1.38 (0.99–1.92) | - | 1.12 (0.79–1.60) |
Abbreviations: MA, Mexican American; NHW, non-Hispanic White; cOR, cumulative odds ratio; CI, confidence interval. The minimally adjusted models included the following variables: stroke history, age, sex, and education. The fully adjusted models included the following variables: stroke history, age, sex, education, diabetes, and heart disease.
The following variables were retained in the final model: history of stroke, age, sex, ethnicity, educational attainment, history of diabetes, and history of heart disease. While there was a bivariate relationship between hypertension and cognitive status, this relationship was not significant in a model including sociodemographic and other medical history variables (p=0.66), and thus history of hypertension was not retained. When stroke history by ethnicity interaction terms were added to the multivariable model, an interaction between MA ethnicity and stroke history was observed (p=0.01), while no interaction between the “other ethnicity” category and stroke history was observed (p=0.19).
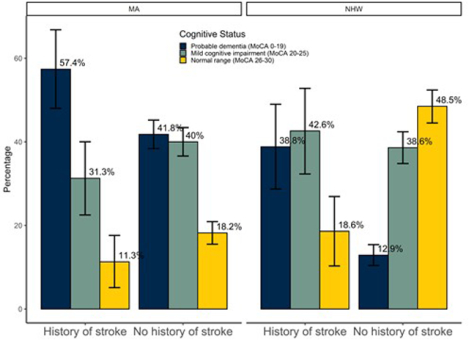
To account for the ethnicity by stroke history interaction, separate multivariable ordinal logistic regression models were generated for MA and NHW participants. Table 2 shows the results of minimally adjusted and fully adjusted models stratified by ethnicity. Stroke was associated with cognitive impairment among both MA and NHW participants, though the effect of stroke on cognition was less in MA participants (cOR 1.58, 95% CI 1.04–2.41) compared to NHW participants (cOR 3.81, 95% CI 2.37–6.12). Increased age and decreased educational attainment were also associated with cognitive impairment in both ethnic groups (see Table 2). Figure 1 shows the distribution of cognitive status stratified by ethnicity for those with history of stroke compared to those without history of stroke.
Figure 1.

Cognitive status by stroke history and ethnicity. MA=Mexican American; NHW=Non Hispanic white; MoCA=Montreal Cognitive Assessment. Bars represent weighted percentages. Vertical lines indicate 95% confidence intervals.
To determine if the data differed by in-person and phone participation, we re-estimated the final cumulative logit models, adding a main effect for mode (in-person, telephone) of MoCA administration and the first order interaction between administration mode and history of stroke. For the MA model, results for the main effect of mode (p=0.95) and the interaction term of mode with stroke report (p=0.34) suggested that mode of administration does not significantly impact the reported relationship between cognitive status and a history of stroke. The same is true for the final NHW model: main effect (p=0.31); interaction of mode with stroke history (p=0.58).
Discussion
Among 1,801 contemporary participants from a bi-ethnic community in the southern United States, history of stroke was associated with increased odds of cognitive impairment after controlling for other factors among both MA and NHW participants. This finding is similar to other population-based studies that have found an increase in dementia risk following stroke.38 However, we also found that the impact of stroke on cognition varied by ethnicity. Specifically, we observed an interaction whereby the magnitude of the association between stroke and cognitive impairment was less for MA participants compared to NHW participants.
Despite this, MA participants had a higher prevalence of cognitive impairment compared to NHW participants, similar to other studies demonstrating a higher prevalence of cognitive impairment among other underrepresented ethnic groups.39, 40 In our cohort, these disparities cannot be accounted for by a differential impact of stroke on cognition. Instead, they may be due to ethnic disparities in other dementia risk factors such as educational attainment, socioeconomic status, comorbidities, and access to healthcare.41–43 We are currently conducting additional studies of ethnic differences in dementia with more detailed cognitive assessments in this community.
Older age and lower educational attainment were also associated with higher risk of cognitive impairment. In contrast, history of hypertension was not associated with dementia risk in our study, despite previous evidence that elevated blood pressure, particularly in midlife, is associated with worse cognitive outcomes.44, 45 There are several possible explanations for this discordant finding. We did not measure age at onset of hypertension, actual blood pressure levels, or antihypertensive treatment. There was a bivariate relationship between hypertension and cognitive status, which was attenuated and no longer statistically significant after inclusion of other predictors that were strongly associated with hypertension including ethnicity, education level, and diabetes.
Strengths of the study include the large population-based, ethnically diverse sample and use of objective cognitive measures. Limitations include use of the MoCA rather than clinical and neuropsychological evaluations to measure cognitive status. Interpretation of MoCA scores and cognitive impairment cut points for underrepresented and non-English speaking populations is not well established.33, 46, 47 This is an area of ongoing research within the BASIC-Cognitive project.48, 49 Additionally, we relied on self-report for ascertainment of medical history variables and stroke history which may have been impacted by recall bias, though self-reported stroke has been determined to be a valid measure of clinical stroke history.28 As we did not have clinical records, we were unable to assess stroke severity, stroke recurrence, or stroke mechanism, which have been shown to predict post-stroke cognitive outcomes.50, 51 Similarly, time from stroke to appearance of cognitive impairment or dementia could not be ascertained.
Overall, our findings underscore the importance of aggressive stroke prevention measures not only to minimize the morbidity of post-stroke cognitive impairment for patients and caregivers, but also to reduce the burden of dementia at a population level.
Supplementary Material
Figure S1: Flow diagram illustrating assembly of study data
Funding Sources
This research is supported by National Institute of Neurological Disorders and Stroke, National Institutes of Health (grant R01NS100687).
Disclosures
Drs. Briceño, Levine, Langa, Springer, Zahuranec, and Morgenstern report significant funding from the National Institutes of Health. Dr. Levine reports consulting fees from Northwestern University. Dr. Langa reports grants from The Alzheimer’s Association.
Nonstandard Abbreviations and Acronyms
- MA
Mexican American
- NHW
Non-Hispanic White
- BASIC
Brain Attack Surveillance in Corpus Christi
- MoCA
Montreal Cognitive Assessment
- T-MoCA
Telephone Montreal Cognitive Assessment
- IPW
Inverse propensity weighting
- ACS
American Community Survey
- cOR
Cumulative odds ratio
- MCI
Mild cognitive impairment
Footnotes
Supplemental Materials
STROBE checklist
Racial and Ethnic Disparities Reporting Guidelines
References
- 1.Levine DA, Galecki AT, Langa KM, Unverzagt FW, Kabeto MU, Giordani B, Wadley VG. Trajectory of cognitive decline after incident stroke. JAMA. 2015;314:41–51 [DOI] [PMC free article] [PubMed] [Google Scholar]
- 2.Tatemichi TK, Desmond DW, Stern Y, Paik M, Sano M, Bagiella E. Cognitive impairment after stroke: Frequency, patterns, and relationship to functional abilities. J Neurol Neurosurg Psychiatry. 1994;57:202–207 [DOI] [PMC free article] [PubMed] [Google Scholar]
- 3.Patel MD, Coshall C, Rudd AG, Wolfe CD. Cognitive impairment after stroke: Clinical determinants and its associations with long-term stroke outcomes. J Am Geriatr Soc. 2002;50:700–706 [DOI] [PubMed] [Google Scholar]
- 4.Hale JM, Schneider DC, Mehta NK, Myrskyla M. Cognitive impairment in the U.S.: Lifetime risk, age at onset, and years impaired. SSM Popul Health. 2020;11:100577. [DOI] [PMC free article] [PubMed] [Google Scholar]
- 5.Pinquart M, Sorensen S. Differences between caregivers and noncaregivers in psychological health and physical health: A meta-analysis. Psychol Aging. 2003;18:250–267 [DOI] [PubMed] [Google Scholar]
- 6.Cantarero-Prieto D, Leon PL, Blazquez-Fernandez C, Juan PS, Cobo CS. The economic cost of dementia: A systematic review. Dementia (London). 2020;19:2637–2657 [DOI] [PubMed] [Google Scholar]
- 7.Aranda MP, Kremer IN, Hinton L, Zissimopoulos J, Whitmer RA, Hummel CH, Trejo L, Fabius C. Impact of dementia: Health disparities, population trends, care interventions, and economic costs. J Am Geriatr Soc. 2021;69:1774–1783 [DOI] [PMC free article] [PubMed] [Google Scholar]
- 8.Rizzi L, Rosset I, Roriz-Cruz M. Global epidemiology of dementia: Alzheimer’s and vascular types. Biomed Res Int. 2014;2014:908915. [DOI] [PMC free article] [PubMed] [Google Scholar]
- 9.Schneider JA, Arvanitakis Z, Bang W, Bennett DA. Mixed brain pathologies account for most dementia cases in community-dwelling older persons. Neurology. 2007;69:2197–2204 [DOI] [PubMed] [Google Scholar]
- 10.Boyle PA, Yu L, Wilson RS, Leurgans SE, Schneider JA, Bennett DA. Person-specific contribution of neuropathologies to cognitive loss in old age. Ann Neurol. 2018;83:74–83 [DOI] [PMC free article] [PubMed] [Google Scholar]
- 11.Sexton E, McLoughlin A, Williams DJ, Merriman NA, Donnelly N, Rohde D, Hickey A, Wren MA, Bennett K. Systematic review and meta-analysis of the prevalence of cognitive impairment no dementia in the first year post-stroke. Eur Stroke J. 2019;4:160–171 [DOI] [PMC free article] [PubMed] [Google Scholar]
- 12.Pendlebury ST, Rothwell PM. Prevalence, incidence, and factors associated with pre-stroke and post-stroke dementia: A systematic review and meta-analysis. The Lancet Neurology. 2009;8:1006–1018 [DOI] [PubMed] [Google Scholar]
- 13.Ivan CS, Seshadri S, Beiser A, Au R, Kase CS, Kelly-Hayes M, Wolf PA. Dementia after stroke: The Framingham Study. Stroke. 2004;35:1264–1268 [DOI] [PubMed] [Google Scholar]
- 14.Kokmen E, Whisnant JP, O’Fallon WM, Chu CP, Beard CM. Dementia after ischemic stroke: A population-based study in Rochester, Minnesota (1960–1984). Neurology. 1996;46:154–159 [DOI] [PubMed] [Google Scholar]
- 15.Reitz C, Bos MJ, Hofman A, Koudstaal PJ, Breteler MM. Prestroke cognitive performance, incident stroke, and risk of dementia: The Rotterdam Study. Stroke. 2008;39:36–41 [DOI] [PubMed] [Google Scholar]
- 16.Srikanth VK, Quinn SJ, Donnan GA, Saling MM, Thrift AG. Long-term cognitive transitions, rates of cognitive change, and predictors of incident dementia in a population-based first-ever stroke cohort. Stroke. 2006;37:2479–2483 [DOI] [PubMed] [Google Scholar]
- 17.Jin YP, Di Legge S, Ostbye T, Feightner JW, Hachinski V. The reciprocal risks of stroke and cognitive impairment in an elderly population. Alzheimers Dement. 2006;2:171–178 [DOI] [PubMed] [Google Scholar]
- 18.Zhu L, Fratiglioni L, Guo Z, Basun H, Corder EH, Winblad B, Viitanen M. Incidence of dementia in relation to stroke and the apolipoprotein e epsilon4 allele in the very old. Findings from a population-based longitudinal study. Stroke. 2000;31:53–60 [DOI] [PubMed] [Google Scholar]
- 19.Hayden KM, Zandi PP, Lyketsos CG, Khachaturian AS, Bastian LA, Charoonruk G, Tschanz JT, Norton MC, Pieper CF, Munger RG, et al. Vascular risk factors for incident alzheimer disease and vascular dementia: The Cache County Study. Alzheimer Dis Assoc Disord. 2006;20:93–100 [DOI] [PubMed] [Google Scholar]
- 20.Brayne C, Gill C, Huppert FA, Barkley C, Gehlhaar E, Girling DM, O’Connor DW, Paykel ES. Vascular risks and incident dementia: Results from a cohort study of the very old. Dement Geriatr Cogn Disord. 1998;9:175–180 [DOI] [PubMed] [Google Scholar]
- 21.Yip AG, Brayne C, Matthews FE, Function MRCC, Ageing S. Risk factors for incident dementia in England and Wales: The medical research council cognitive function and ageing study. A population-based nested case-control study. Age Ageing. 2006;35:154–160 [DOI] [PubMed] [Google Scholar]
- 22.Kuller LH, Lopez OL, Newman A, Beauchamp NJ, Burke G, Dulberg C, Fitzpatrick A, Fried L, Haan MN. Risk factors for dementia in the cardiovascular health cognition study. Neuroepidemiology. 2003;22:13–22 [DOI] [PubMed] [Google Scholar]
- 23.Gamaldo A, Moghekar A, Kilada S, Resnick SM, Zonderman AB, O’Brien R. Effect of a clinical stroke on the risk of dementia in a prospective cohort. Neurology. 2006;67:1363–1369 [DOI] [PubMed] [Google Scholar]
- 24.Guo X, Ostling S, Kern S, Johansson L, Skoog I. Increased risk for dementia both before and after stroke: A population-based study in women followed over 44 years. Alzheimers Dement. 2018;14:1253–1260 [DOI] [PubMed] [Google Scholar]
- 25.Vincent GK, Velkoff VA. The older population in the United States: 2010–2050, population estimates and projections. In: Current population reports: Population estimates and projections. Washington, DC. U.S. Department of Commerce, Economics and Statistics Administration, U.S. Census Bureau. 2010; Report number P25–1138: 1–16 [Google Scholar]
- 26.Briceno EM, Mehdipanah R, Gonzales X, Heeringa S, Levine DA, Langa KM, Garcia N, Longoria R, Morgenstern LB. Methods and early recruitment of a community-based study of cognitive impairment among Mexican Americans and non-Hispanic Whites: The basic-cognitive study. J Alzheimers Dis. 2020;73:185–196 [DOI] [PMC free article] [PubMed] [Google Scholar]
- 27.U.S. Census Bureau QuickFacts: Nueces County, Texas. URL: https://www.census.gov/quickfacts/nuecescountytexas. Accessed on May 27, 2022.
- 28.Engstad T, Bonaa KH, Viitanen M. Validity of self-reported stroke : The Tromso Study. Stroke. 2000;31:1602–1607 [DOI] [PubMed] [Google Scholar]
- 29.Nasreddine ZS, Phillips NA, Bedirian V, Charbonneau S, Whitehead V, Collin I, Cummings JL, Chertkow H. The Montreal Cognitive Assessment, MoCA: A brief screening tool for mild cognitive impairment. J Am Geriatr Soc. 2005;53:695–699 [DOI] [PubMed] [Google Scholar]
- 30.Katz MJ, Wang C, Nester CO, Derby CA, Zimmerman ME, Lipton RB, Sliwinski MJ, Rabin LA. T-MoCA: A valid phone screen for cognitive impairment in diverse community samples. Alzheimers Dement (Amst). 2021;13:e12144. [DOI] [PMC free article] [PubMed] [Google Scholar]
- 31.Burton L, Tyson SF. Screening for cognitive impairment after stroke: A systematic review of psychometric properties and clinical utility. J Rehabil Med. 2015;47:193–203 [DOI] [PubMed] [Google Scholar]
- 32.Pendlebury ST, Welch SJ, Cuthbertson FC, Mariz J, Mehta Z, Rothwell PM. Telephone assessment of cognition after transient ischemic attack and stroke: Modified telephone interview of cognitive status and telephone montreal cognitive assessment versus face-to-face montreal cognitive assessment and neuropsychological battery. Stroke. 2013;44:227–229 [DOI] [PMC free article] [PubMed] [Google Scholar]
- 33.Milani SA, Marsiske M, Cottler LB, Chen X, Striley CW. Optimal cutoffs for the Montreal Cognitive Assessment vary by race and ethnicity. Alzheimers Dement (Amst). 2018;10:773–781 [DOI] [PMC free article] [PubMed] [Google Scholar]
- 34.Trzepacz PT, Hochstetler H, Wang S, Walker B, Saykin AJ, Alzheimer’s Disease Neuroimaging Initiative. Relationship between the Montreal Cognitive Assessment and Mini-mental State Examination for assessment of mild cognitive impairment in older adults. BMC Geriatr. 2015;15:107. [DOI] [PMC free article] [PubMed] [Google Scholar]
- 35.Elliott MR, Valliant R. Inference for nonprobability samples. Statistical Science. 2017;32 [Google Scholar]
- 36.Heeringa SG, West BT, Berglund PA. Applied survey data analysis, 2nd edition. Boca Raton, FL: Chapman and Hall; 2017. [Google Scholar]
- 37.Vandenbroucke JP, von Elm E, Altman DG, Gotzsche PC, Mulrow CD, Pocock SJ, Poole C, Schlesselman JJ, Egger M, Initiative S. Strengthening the reporting of observational studies in epidemiology (STROBE): Explanation and elaboration. PLoS Med. 2007;4:e297. [DOI] [PMC free article] [PubMed] [Google Scholar]
- 38.Savva GM, Stephan BC, Alzheimer’s Society Vascular Dementia Systematic Review Group. Epidemiological studies of the effect of stroke on incident dementia: A systematic review. Stroke. 2010;41:e41–46 [DOI] [PubMed] [Google Scholar]
- 39.Wright CB, DeRosa JT, Moon MP, Strobino K, DeCarli C, Cheung YK, Assuras S, Levin B, Stern Y, Sun X, et al. Race/ethnic disparities in mild cognitive impairment and dementia: The Northern Manhattan Study. J Alzheimers Dis. 2021;80:1129–1138 [DOI] [PMC free article] [PubMed] [Google Scholar]
- 40.Mayeda ER, Glymour MM, Quesenberry CP, Whitmer RA. Inequalities in dementia incidence between six racial and ethnic groups over 14 years. Alzheimers Dement. 2016;12:216–224 [DOI] [PMC free article] [PubMed] [Google Scholar]
- 41.Chen C, Zissimopoulos JM. Racial and ethnic differences in trends in dementia prevalence and risk factors in the United States. Alzheimers Dement (N Y). 2018;4:510–520 [DOI] [PMC free article] [PubMed] [Google Scholar]
- 42.Lines L, Sherif N, Wiener J. Racial and ethnic disparities among individuals with Alzheimer’s disease in the United States: A literature review. RTI Press. RTI Press Research; Report No. RR-0024–1412. 10.3768/rtipress.2014.RR.0024.1412 [DOI] [Google Scholar]
- 43.Plassman BL, Langa KM, Fisher GG, Heeringa SG, Weir DR, Ofstedal MB, Burke JR, Hurd MD, Potter GG, Rodgers WL, et al. Prevalence of dementia in the United States: The aging, demographics, and memory study. Neuroepidemiology. 2007;29:125–132 [DOI] [PMC free article] [PubMed] [Google Scholar]
- 44.Gottesman RF, Schneider AL, Albert M, Alonso A, Bandeen-Roche K, Coker L, Coresh J, Knopman D, Power MC, Rawlings A, et al. Midlife hypertension and 20-year cognitive change: The Atherosclerosis Risk in Communities Neurocognitive Study. JAMA Neurol. 2014;71:1218–1227 [DOI] [PMC free article] [PubMed] [Google Scholar]
- 45.Launer LJ. The association between midlife blood pressure levels and late-life cognitive function. JAMA. 1995;274. [PubMed] [Google Scholar]
- 46.Milani SA, Marsiske M, Striley CW. Discriminative ability of Montreal Cognitive Assessment subtests and items in racial and ethnic minority groups. Alzheimer Dis Assoc Disord. 2019;33:226–232 [DOI] [PMC free article] [PubMed] [Google Scholar]
- 47.Carson N, Leach L, Murphy KJ. A re-examination of Montreal Cognitive Assessment (MoCA) cutoff scores. Int J Geriatr Psychiatry. 2018;33:379–388 [DOI] [PubMed] [Google Scholar]
- 48.Briceno EM, Mehdipanah R, Gonzales XF, Heeringa SG, Levine DA, Langa KM, Zahs D, Garcia N, Longoria R, Vargas A, et al. Differential relationships between the Montreal Cognitive Assessment and informant-rated cognitive decline among Mexican Americans and non-Hispanic Whites. J Geriatr Psychiatry Neurol. 2022;35:555–564. [DOI] [PMC free article] [PubMed] [Google Scholar]
- 49.Briceno EM, Mehdipanah R, Gonzales XF, Heeringa SG, Levine DA, Langa KM, Zahs D, Garcia N, Longoria R, Morgenstern LB. Bilingualism, assessment language, and the Montreal Cognitive Assessment in Mexican Americans. J Am Geriatr Soc. 2021;69:1971–1981 [DOI] [PMC free article] [PubMed] [Google Scholar]
- 50.Pendlebury ST, Rothwell PM. Incidence and prevalence of dementia associated with transient ischaemic attack and stroke: Analysis of the population-based Oxford Vascular Study. The Lancet Neurology. 2019;18:248–258 [DOI] [PMC free article] [PubMed] [Google Scholar]
- 51.Koton S, Pike JR, Johansen M, Knopman DS, Lakshminarayan K, Mosley T, Patole S, Rosamond WD, Schneider ALC, Sharrett AR, et al. Association of ischemic stroke incidence, severity, and recurrence with dementia in the Atherosclerosis Risk in Communities Cohort Study. JAMA Neurol. 2022;79:271–280 [DOI] [PMC free article] [PubMed] [Google Scholar]
Associated Data
This section collects any data citations, data availability statements, or supplementary materials included in this article.
Supplementary Materials
Figure S1: Flow diagram illustrating assembly of study data