
Figure 1:
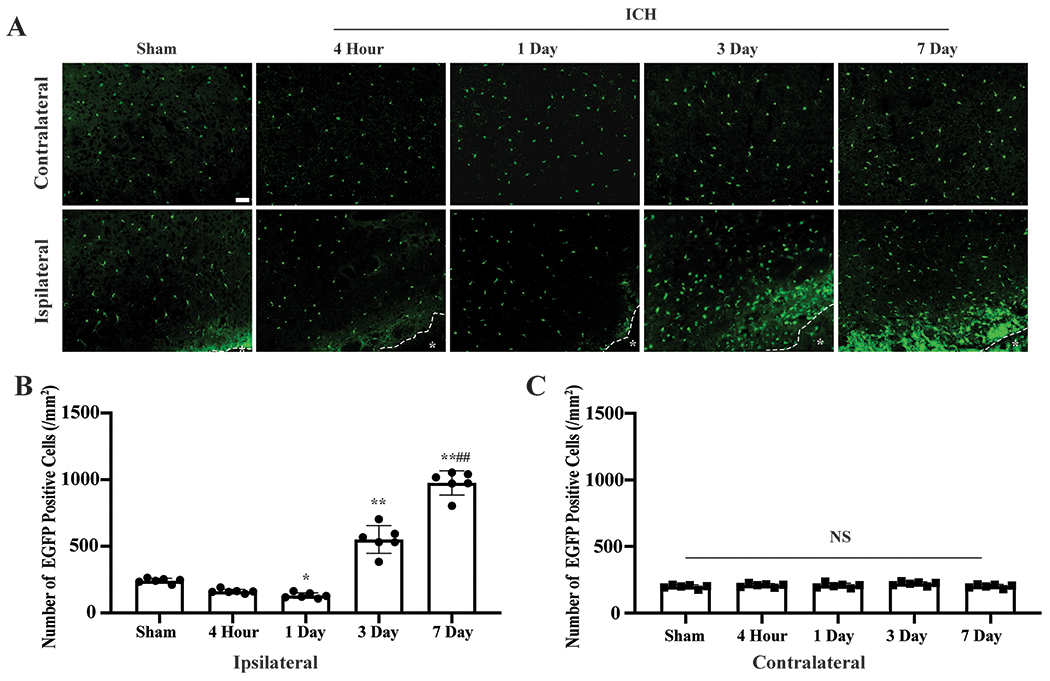
ICH induced microglia death and proliferation. (A) Representative EGFP (green) fluorescence images of Tmem119-EGFP after ICH. *indicates hematoma or needle track. (B) Quantification data on perihematomal (ipsilateral) microglia, and (C) contralateral. Sham mice received a needle insertion. *P<0.05, **P<0.001 vs. the sham group, ##P<0.001 vs. 3 days. Values are means±SD; n=6 per group. Scale bar is 50μm.