Abstract
Background:
Non-alcoholic fatty liver disease (NAFLD) is common in primary care. Liver fibrosis stage 2 or higher (≥F2) increases future risk of morbidity and mortality. We developed and validated a score to aid in the initial assessment of liver fibrosis for NAFLD in primary care.
Methods:
Biopsy-proven NAFLD patients’ data were extracted from the ‘NASH CRN’ observational study (n=676). Using logistic regression and machine-learning methods, we constructed prediction models to distinguish ≥F2 from F0/1. The models were tested in participants in a trial (‘FLINT’, n=280) and local NAFLD patients with magnetic resonance elastography data (n=130). The final model was applied to examinees in the National Health and Nutrition Examination Survey III (NHANES, n=11,953) to correlate with longterm mortality.
Results:
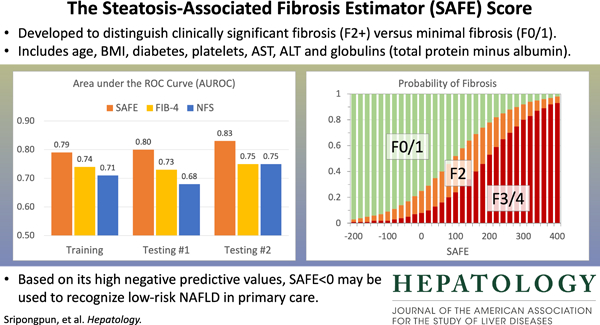
A multivariable logistic regression model was selected as the Steatosis-Associated Fibrosis Estimator (SAFE) score, which consists of age, body mass index, diabetes, platelets, aspartate and alanine aminotransferases and globulins (total serum protein minus albumin). The model yielded areas under receiver operating characteristic curves ≥ 0.80 in distinguishing F0/1 from ≥F2 in testing datasets, consistently higher than those of FIB-4 and NAFLD Fibrosis Scores. The negative predictive values in ruling out ≥F2 at SAFE of 0 were 88% and 92% in the two testing sets. In the NHANES III set, survival up to 25 years of subjects with SAFE <0 was comparable to that of those without steatosis (p=0.34), while increasing SAFE scores correlated with shorter survival with an adjusted hazard ratio of 1.54 (p<0.01) for subjects with SAFE>100.
Conclusion:
The SAFE score, which uses widely available variables to estimate liver fibrosis in patients diagnosed with NAFLD, may be used in primary care to recognize low-risk NAFLD.
Keywords: NAFLD, NASH, Fibrosis, Survival prediction, Primary care
Graphical Abstract
Introduction
Non-alcoholic fatty liver disease (NAFLD) is a common cause of chronic liver disease with a rapidly increasing public health burden, affecting approximately one-fourth of the global population.1,2 NAFLD represents a spectrum of disorders ranging from simple steatosis to non-alcoholic steatohepatitis (NASH) progressing to hepatic fibrosis and cirrhosis.3,4 In addition to steatosis, NASH is characterized by lobular inflammation, hepatocyte ballooning degeneration, and fibrosis. However, the single most critical determinant of long-term outcomes, ranging from morbidity of end-stage liver disease to all-cause mortality, is liver fibrosis. Recent reports delineate these data further and show that risk of future complications accelerates in patients with fibrosis stage 2 or higher (≥F2), compared to lower stages of fibrosis (F0/1).5,6
The intersection between the enormously high prevalence of NAFLD and the difficulty of diagnosing patients at risk of poor health outcomes represents a difficult practical challenge faced by primary care providers, internists, and endocrinologists that frequently encounter patients with NAFLD.7,8 A recent survey of primary care physicians reported a wide variability in the care of patients with NAFLD. One third of the respondents referred all or most of their NAFLD patients to a specialist, whereas up to 10% referred none. This was in part due to lack of clinical tools for risk stratification, as less than 5% of community physicians reported using non-invasive diagnostic markers.9
In order to minimize the burden of chronic liver disease from NAFLD, multiple public health measures are needed, ranging from systematic screening for NAFLD itself to development and application of safe and effective treatment.10–13 An important gap in this cascade of care is the absence of validated, user-friendly tools to aid primary care practitioners in gauging risks of future outcomes, which may inform decisions for further diagnostic and therapeutic interventions. Simple blood tests, such as alanine aminotransferase (ALT), are poor surrogates of NASH or fibrosis.14 Liver biopsy is the gold standard for diagnosing NASH, but is both invasive and impractical to be applied to a large number of patients.15 Recently, device-assisted elastography has been introduced as a less invasive tool to assess liver fibrosis; however, the technology is not readily accessible to non-hepatologists.16 There are a number of ‘non-invasive markers’ familiar to hepatologists, which have been derived for other liver diseases (e.g., FIB-4 for hepatitis C and HIV), calibrated to detect later stages (e.g., NAFLD Fibrosis Score (NFS) for advanced fibrosis) of disease, and/or developed for propriety testing (e.g., Fibrometer, the Enhanced Liver Fibrosis (ELF) panel).17–21 These are not well-suited for primary care, where a decision rule, based on routinely available information, is needed for patient assessment.22
In this work, we develop a practical tool for non-hepatologists to apply in patients who have been diagnosed with NAFLD. It would aid the practitioner in assessing which patients may be safely monitored and managed in primary care versus others who may potentially benefit from referral to a specialist. In achieving this goal, we derive and validate a score to correlate with clinically significant fibrosis and we demonstrate that the new score performs better than existing markers.
Methods
Study Overview
Figure 1 outlines the overall study plan, consisting of secondary analysis of four data sets including subjects with NAFLD. The first is composed of patients enrolled in the observational cohort of the non-alcoholic steatohepatitis clinical research network (NASH CRN),23 which we refer to as the training set. We then validated the model in two different testing datasets. The first testing set (testing set #1, henceforth) incorporated subjects who participated in a published clinical trial, known as the Farnesoid X nuclear receptor ligand obeticholic acid for non-cirrhotic NASH (FLINT trial).24 The second testing set (testing set #2, henceforth) represented NAFLD patients who underwent magnetic resonance elastography (MRE) at Stanford University. Once the final prediction model was trained and tested, we applied it to the last dataset used in this analysis, namely the third National Health and Nutrition Examination Survey (NHANES III). Using the data, we assessed the model’s ability to predict long-term outcomes in the US general population.25
Figure 1.
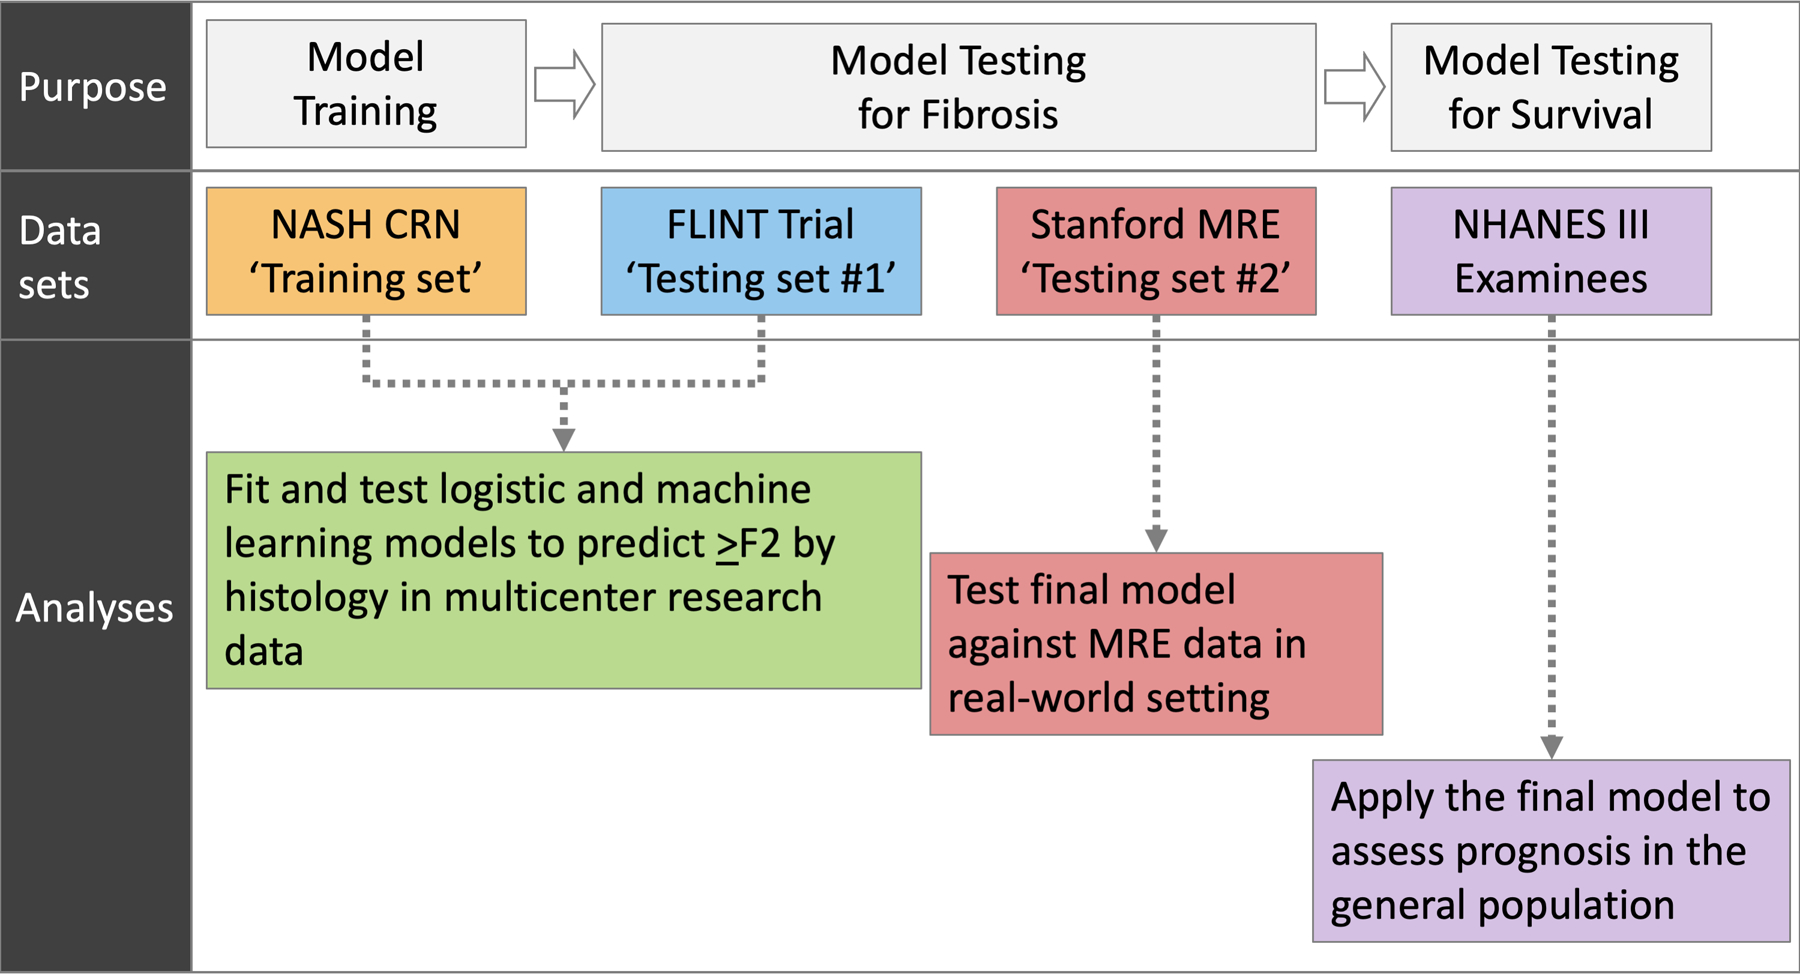
Overall study plan
In designing the study, our strategy was to develop a model based on the data set that was most representative of patients undergoing evaluation for NAFLD in a specialty setting (NASH CRN observational cohort). The model was then evaluated for spectrum validity, ranging from rigorously-selected NASH patients that participated in the randomized controlled trial (testing set #1), to real-world NAFLD patients at an academic practice (testing set #2), and to a sample from the general population (NHANES III).
Study Participants
The training dataset consisted of biopsy-proven NAFLD patients from centers participating in NASH-CRN, the details of which are published.23 Briefly, the study included the entire spectrum of NAFLD patients, ranging from simple steatosis to cirrhosis, and excluded patients with other forms of chronic liver disease, such as viral hepatitis or alcohol-associated liver disease. From the study data, we selected patients with available liver biopsy data from within six months of baseline data collection. (Supplementary Figure 1)
The details of testing set #1 (‘FLINT’) have also been described in detail.24 Briefly, the trial enrolled both diabetic and nondiabetic patients with histologically-confirmed NASH regardless of fibrosis stage, and randomized them between obeticholic acid and placebo. From these study participants, individuals without complete data necessary for the analysis (e.g., liver fibrosis stage) were excluded from our analysis. Although this trial was conducted by NASH CRN, there was no overlap between the training set and testing set #1. (Supplementary Figure 2)
Testing set #2 was obtained from a retrospective cohort, assembled of NAFLD patients who underwent liver stiffness measurement by magnetic resonance elastography (MRE) at Stanford between January 2012 and June 2017. Patients with both a diagnostic code for NAFLD and available MRE results were identified using an institutional electronic registry. From the medical records, clinical and laboratory data closest to the MRE within six months’ window were obtained. Patients with other chronic liver disease diagnoses such as viral hepatitis B or C, alcohol-associated liver disease and liver tumors were excluded, as well as patients whose essential data were missing. (Supplementary Figure 3)
NHANES III is a federal program conducted in 1988–1994 to determine the health and nutritional status of the US population. It consists of stratified samples designed to be representative of non-institutionalized civilians.26 NHANES III affords unique advantages to our study purpose, including ultrasonographic determination of hepatic steatosis and linkage with mortality data, which allows assessment of long-term mortality of survey participants. From the dataset, all adults (≥18 years) with ultrasonographic diagnosis of hepatic steatosis (graded as mild, moderate, or severe) were identified. For this analysis, NAFLD was defined by any degree of steatosis in the absence of other liver disease diagnoses. Specifically, we excluded individuals with positive hepatitis B surface antigen or positive hepatitis C antibody, as well as those reporting significant alcohol consumption (≥21 drinks/week in men and ≥14 drinks/week in women). Subjects missing necessary demographic, clinical, and laboratory data were also excluded. The vital statuses of the final NHANES III subjects were determined through December 31, 2015. (Supplementary Figure 4)
The training set and testing set #1 data were obtained from the National Institute of Diabetes and Digestive and Kidney Diseases’ Central Repository and NHANES III data from the Center for Disease Control and Prevention (CDC), after appropriate data use agreements were authorized. This study was approved by Stanford University’s Institutional Review Board.
Dependent and Independent Variables
As our goal was to develop a model that assesses clinically significant fibrosis, the dependent variable of the analysis was discrimination between stage 0/1 (no significant fibrosis) and stage 2–4 fibrosis (clinically significant fibrosis). In the model training set and testing set #1, histological assessment of liver fibrosis was staged from F0 (no fibrosis) to F4 (cirrhosis) and was centrally conducted using the system by Kleiner.4 In testing set #2, fibrosis stage was determined by MRE, using a cut-off of 3.4 kilopascals (kPa); those with liver stiffness measurements below this threshold are considered to indicate no significant fibrosis (F0/1) and those above this threshold clinically significant fibrosis (≥F2).
With regard to independent variables, we sought to create a model with generalizable and widely-available data in routine practice and not subject to short-term variability (e.g., plasma glucose concentrations). Thus, from the training and testing datasets, we extracted the following candidate variables: age, sex, BMI, diabetes, complete blood count, total bilirubin, aspartate aminotransferase (AST), alanine aminotransferase (ALT), alkaline phosphatase (ALP), gamma-glutamyl transpeptidase (GGT), albumin, globulin, and lipid panel values. Diabetes status was based on coding for type 2 diabetes.23,24 For testing set #1, only data at baseline (i.e., data from before any therapeutic intervention) were used for analysis.
Model Training and Testing
In building the model, we strategized to incorporate both pathobiological rationale and statistical significance whenever possible. We also sought to create a model that is at least as accurate as existing ones, such as FIB-4 and NFS, which have been proposed to determine advanced fibrosis (F3/4 versus F0–2) in NAFLD patients.20 However, their diagnostic characteristics in differentiating F0/1 versus ≥F2 have not been fully evaluated.
In the training set, four different methods were applied to diagnose ≥F2, including the standard multivariable logistic regression analysis and three machine learning algorithms: the generalized additive model (GAM), random forest (RF), and the gradient boosting machine (GBM). For the logistic regression, multivariable analyses were conducted with stepwise variable selection, inputting variables with a univariate p-value <0.1. The latter three machine learning models were created using all of the variables shown in Table 1. Ten-fold cross validation was conducted inside the training set, with hyperparameter tuning applied for RF and GBM.
Table 1:
Characteristics of study participants.
| Characteristics | Training Set | Testing Set #1 | Testing Set #2 | |||
|---|---|---|---|---|---|---|
| F0/1 (n=370) |
F≥2 (n=306) |
F0/1 (n=112) |
F≥2 (n=168) |
F0/1 (n=84) |
F≥2 (n=46) |
|
| Age (years) | 46 (36–54) |
53 (45–60) |
51 (40–59) |
54 (46–60) |
51 (44–59) |
58 (46–68) |
| Men, n (%) | 152 (41.1) |
108 (35.3) |
47 (42.0) |
49 (29.2) |
44 (52.4) |
13 (37) |
| T2D, n (%) | 54 (14.6) |
99 (32.4) |
41 (36.6) |
107 (63.7) |
16 (19) |
28 (60.9) |
| BMI (kg/m2) | 33.2 (29.4–37.7) |
34.3 (30.3–39.0) |
32.6 (29.6–35.7) |
34.3 (30.8–39.0) |
30.2 (27–34.2) |
31.8 (28.3–36.6) |
| Waist circumference (cm) | 106.9 (97.8–115.8) |
110.5 (100.4–120.8) |
104.9 (98.1–116.5) |
111.1 (103.0–120.9) |
||
| AST (U/L) | 40 (30–58) |
55 (38–79) |
40 (31–55.5) |
58 (43–87) |
29.5 (22–49) |
46.5 (36–61) |
| ALT (U/L) | 62 (41–91) |
68 (46–103) |
57 (45–90.5) |
75 (52.5–119.5) |
46.5 (34–85.8) |
69 (43–112) |
| ALP (U/L) | 77 (62–95) |
87 (71–112) |
69 (56.5–89) |
84.5 (66.5–101.5) |
82.5 (66–95.5) |
85 (66–120) |
| GGT (U/L) | 43 (28–70) |
60 (36–100.5) |
38 (29–62.5) |
59 (37.5–118.5) |
38.5 (31–55) |
89 (49–177) |
| INR | 1.0 (0.9–1.0) |
1.0 (1.0–1.1) |
1.0 (0.9–1.0) |
1.0 (1.0–1.1) |
||
| Total bilirubin (mg/dL) | 0.7 (0.5–0.9) |
0.7 (0.5–0.9) |
0.6 (0.4–0.7) |
0.6 (0.4–0.9) |
0.5 (0.4–0.7) |
0.5 (0.4–0.9) |
| Albumin (g/dL) | 4.2 (4.0–4.5) |
4.2 (3.9–4.5) |
4.4 (4.1–4.7) |
4.3 (4.0–4.5) |
4.0 (3.8–4.2) |
3.8 (3.6–4.0) |
| Globulin (g/dL) | 2.9 (2.5–3.2) |
3.1 (2.8–3.6) |
2.9 (2.7–3.2) |
3.1 (2.7–3.4) |
3.6 (3.4–3.9) |
4.0 (3.6–4.4) |
| Hematocrit (%) | 42.9 (40.2–45.0) |
42.3 (39.6–44.4) |
42.0 (39.4–44.0) |
41.0 (38.8–43.4) |
43.2 (40.2–46.2) |
42.2 (38.5–45.0) |
| Platelet count (109/L) | 254.5 (219–290) |
228 (175–272) |
242 (204–287) |
224.5 (188–267) |
228.5 (201–272) |
187.5 (148–232) |
| Total cholesterol (mg/dL) | 197 (173–223) |
192 (166–220) |
183.5 (157–212.5) |
190.5 (158.5–226) |
||
| Triglycerides (mg/dL) | 158 (108–216) |
143.0 (106–205) |
148 (111–203) |
161.0 (118–211) |
||
| HDL (mg/dL) | 42 (36–50.5) |
42 (35–50) |
41.5 (36–49) |
42 (34–49) |
||
| LDL (mg/dL) | 120 (100–147) |
118 (90–141) |
109 (84–129) |
108 (82–142) |
||
| HbA1c (%) | 5.5 (5.3–6.0) |
5.8 (5.4–6.6) |
6.0 (5.6–6.6) |
6.4 (6.0–7.3) |
||
Data are shown as n (%) or median (IQR), unless indicated otherwise.
T2D, Type 2 Diabetes; BMI, Body Mass Index; AST, aspartate aminotransferase; ALT, alanine aminotransferase; ALP, alkaline phosphatase; GGT, gamma glutamyl transpeptidase; INR, international normalized ratio; HDL, high-density lipoprotein; LDL, low-density lipoprotein; HbA1c, Hemoglobin A1c
Goodness of fit of these models was determined by the area under the receiver operating characteristic curves (AUROC). AUROCs of the logistic regression, GAM, RF, and GBM models were compared to each other and against FIB-4 and NFS using DeLong’s test and two-sided p-values were calculated. The final model, designated as the Steatosis-Associated Fibrosis Estimator (SAFE) score, was selected based on the AUROC, biological interpretability and practical applicability. We then identified the threshold value for SAFE to rule out clinically significant fibrosis. A priori, we set out to achieve a minimum of 0.9 for sensitivity. We also considered a second threshold to diagnose significant fibrosis with 80% specificity and 80% positive predictive values (PPV), which may ‘rule in’ high-risk NAFLD. Finally, we calculated expected probabilities of ≥F2 and F3/4 for the training and testing sets.
Prediction of Long-Term Outcome
Given the existing evidence that clinically significant fibrosis is predictive of long term outcomes including survival, we explored whether the SAFE score correlated with long-term survival in the NHANES III survey participants. Based on the ultrasonographic diagnosis of steatosis and SAFE score strata, we categorized subjects into: no NAFLD, low-risk NAFLD, intermediate-risk NAFLD, and high-risk NAFLD. The Kaplan-Meier method was used to describe survival of each group. The significance of the SAFE score in evaluating long-term survival was examined by the multivariable Cox regression analysis, incorporating available covariates that influence mortality.25 FIB-4 and NFS were assessed in a similar fashion and concordance (C-statistic) of prediction compared for the three scores.
As shown in Supplemetary Figures, observations with missing data were excluded from the analyses, as they were small in proportion, particularly for the data sets used to develop the SAFE score, namely, the training set and testing set #1. All analyses were carried out using the R program, version 3.5.2. The machine learning models were implemented using the caret package.
Results
Model Development in the Training Set
In the training dataset, 676 NASH CRN observational cohort subjects were included (Supplementary Figure 1), of whom 306 (45%) had clinically significant fibrosis. Table 1 describes subjects included in the model development. The median age was 49 (interquartile range [IQR]: 39–57) years and 62% were women. The median BMI was 33.6 kg/m2 (IQR: 29.8–38.4) and 23% had type 2 diabetes. When compared to patients without fibrosis, those with clinically significant fibrosis had higher liver enzyme activities, including AST, ALT, ALP, and GGT, and higher serum globulin (total protein minus albumin) concentrations. Their hematocrit, total white blood cell count and platelet count were lower when compared to those without fibrosis.
For those variables with statistically significant and clinically meaningful differences in the univariate comparisons, we used p-splines to examine the relation between the variable and the probability of fibrosis. For the laboratory variables, model fit improved with the logarithmic transformation. Figure 2 depicts the relation for the variable selected in the multivariable stage. All variables except BMI were overall linear in relation to the probability of clinically significant fibrosis, whereas the effect of BMI reached a maximum at 40 kg/m2.
Figure 2.
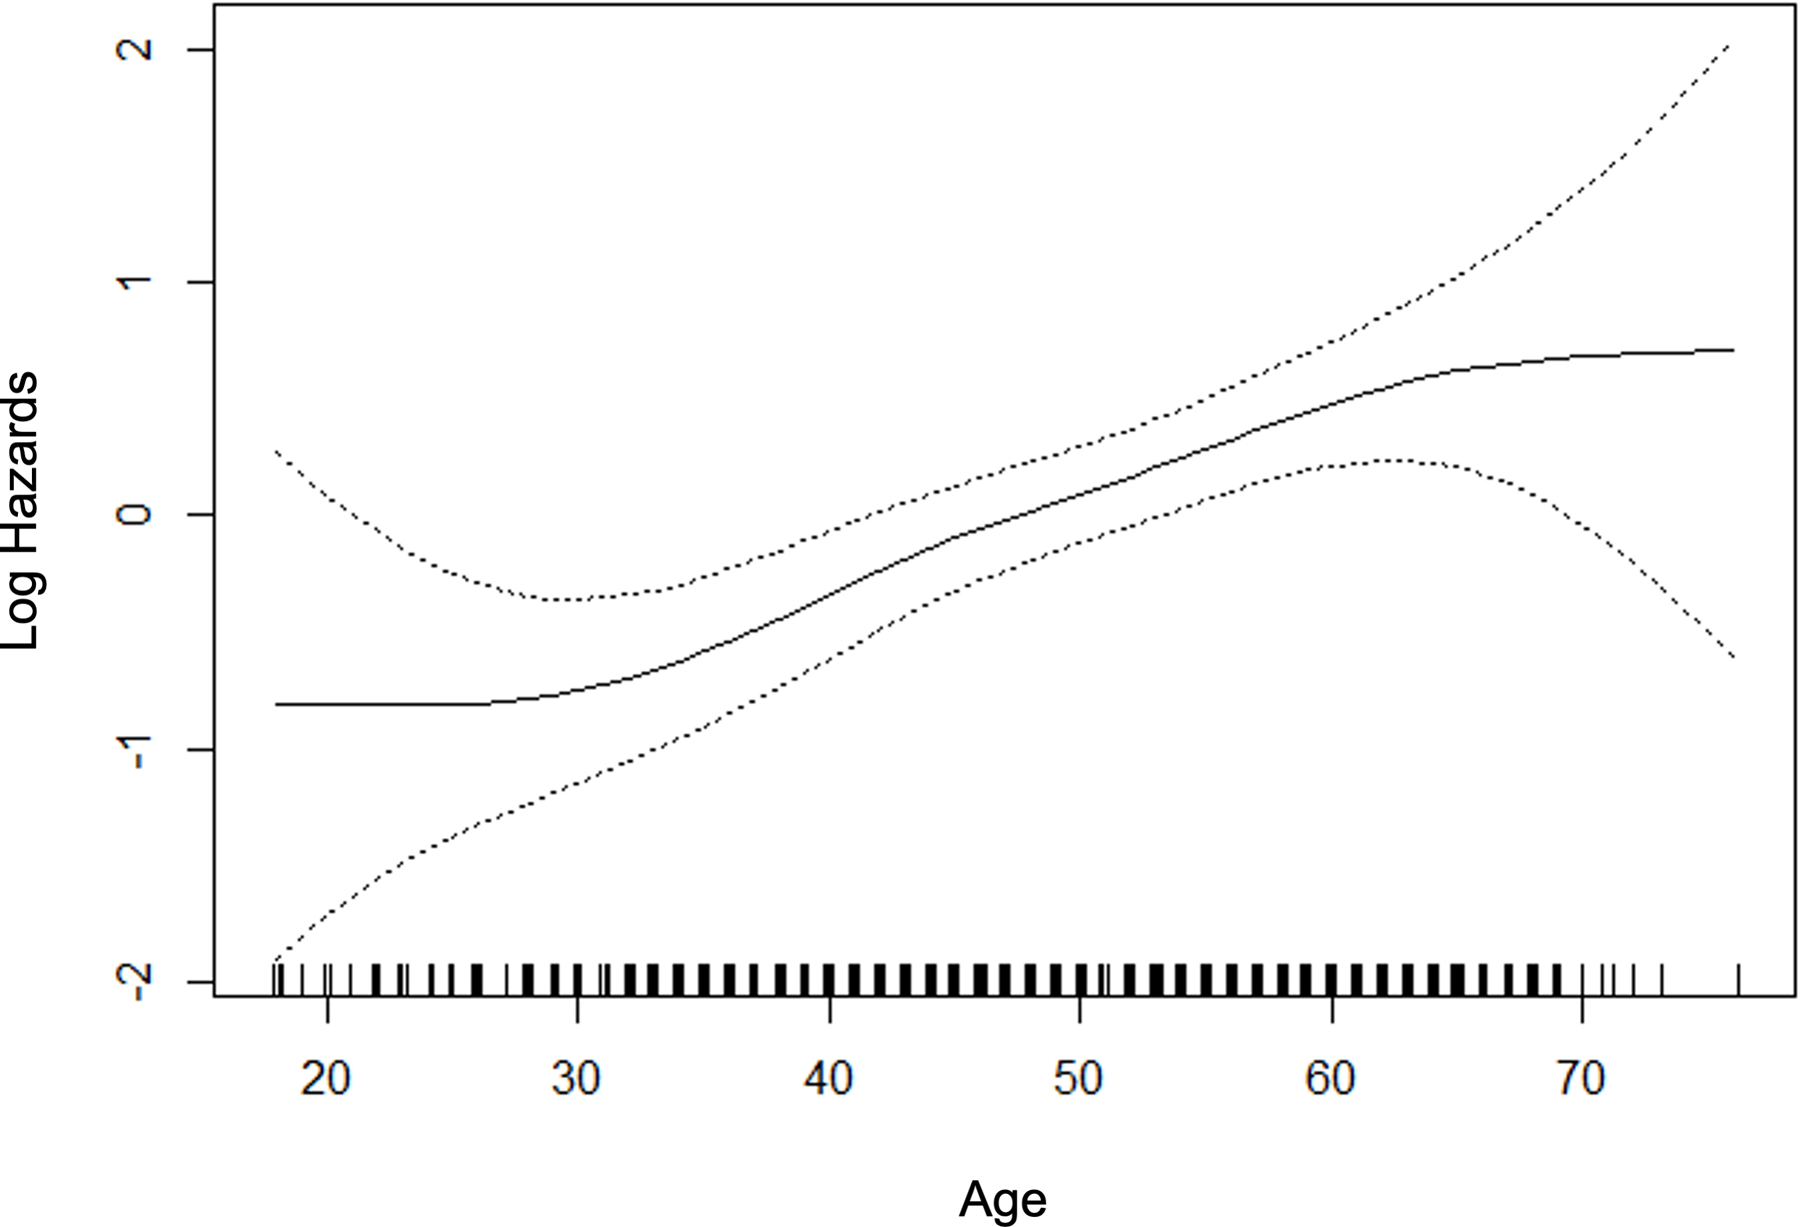
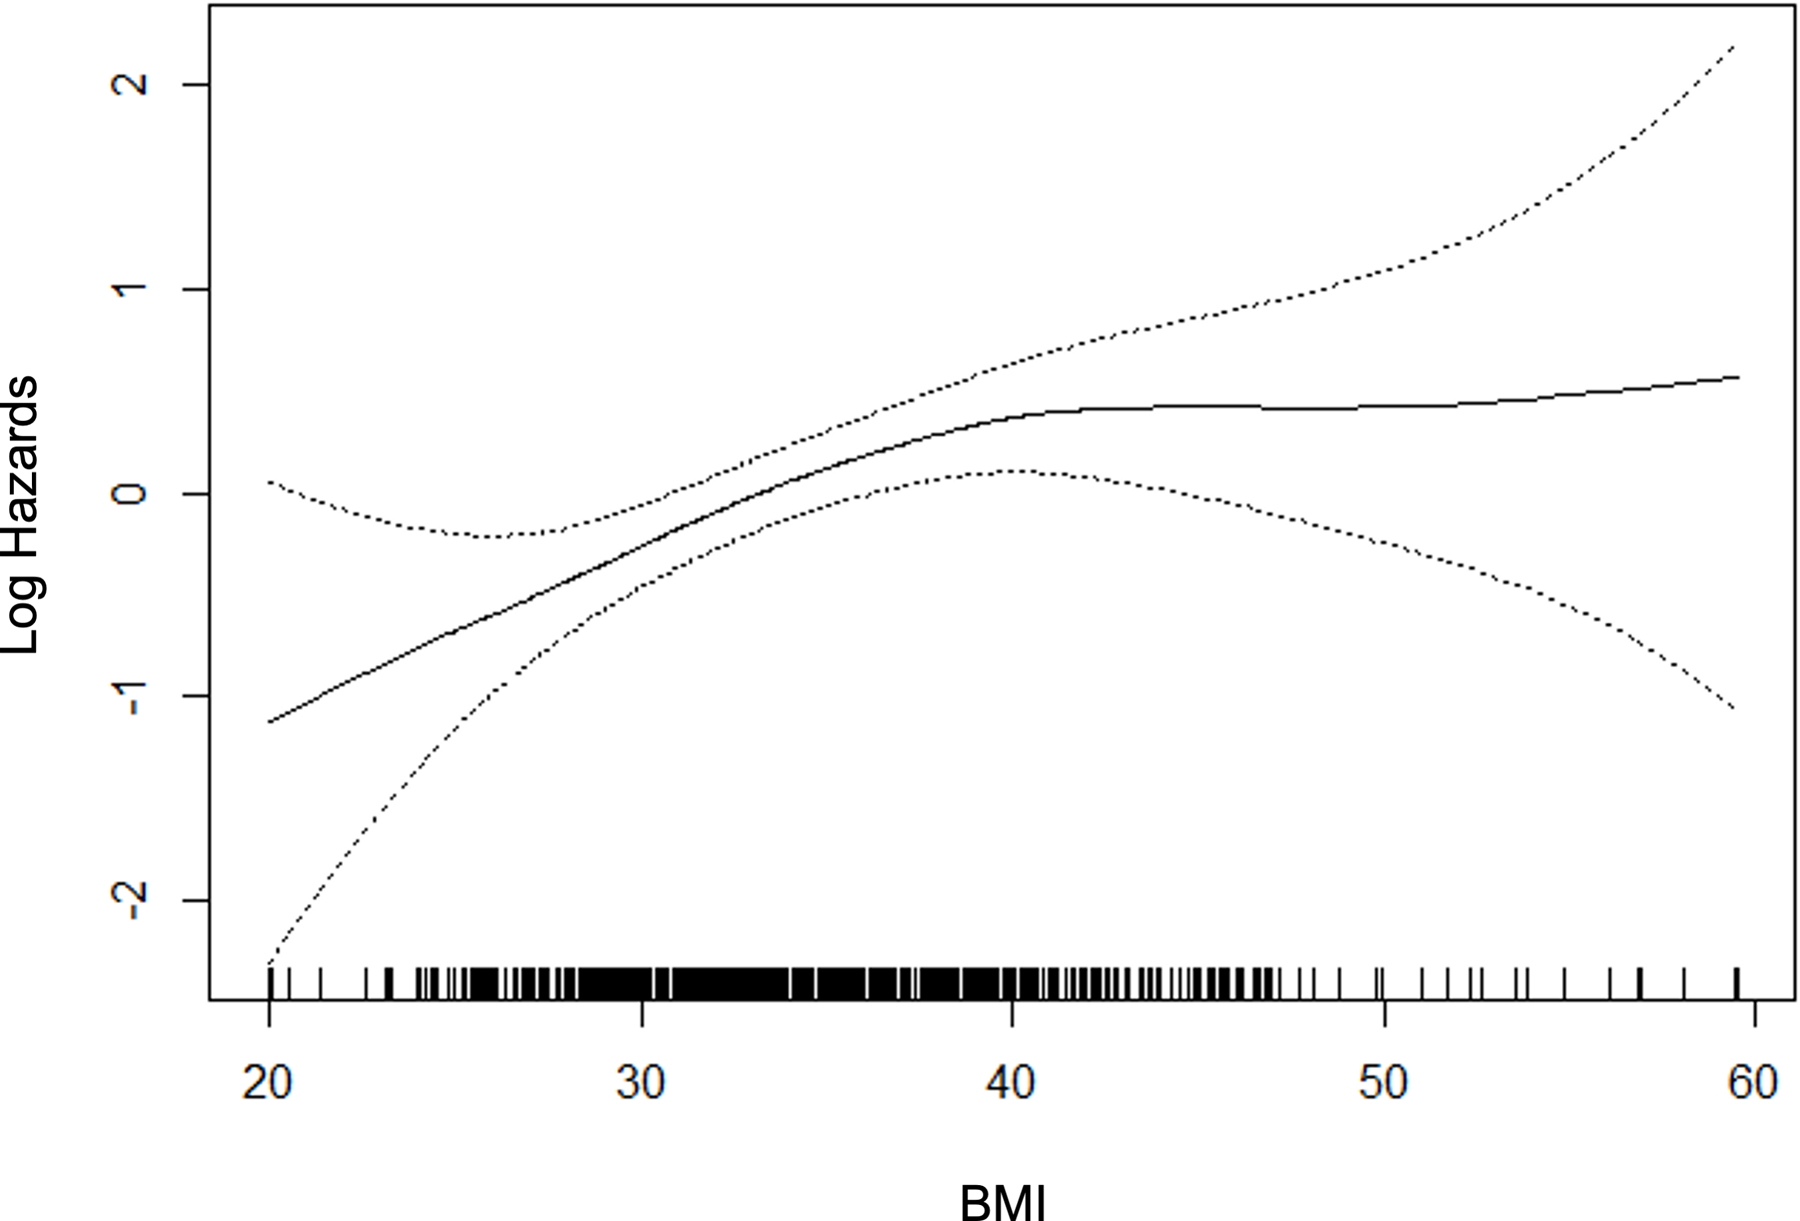
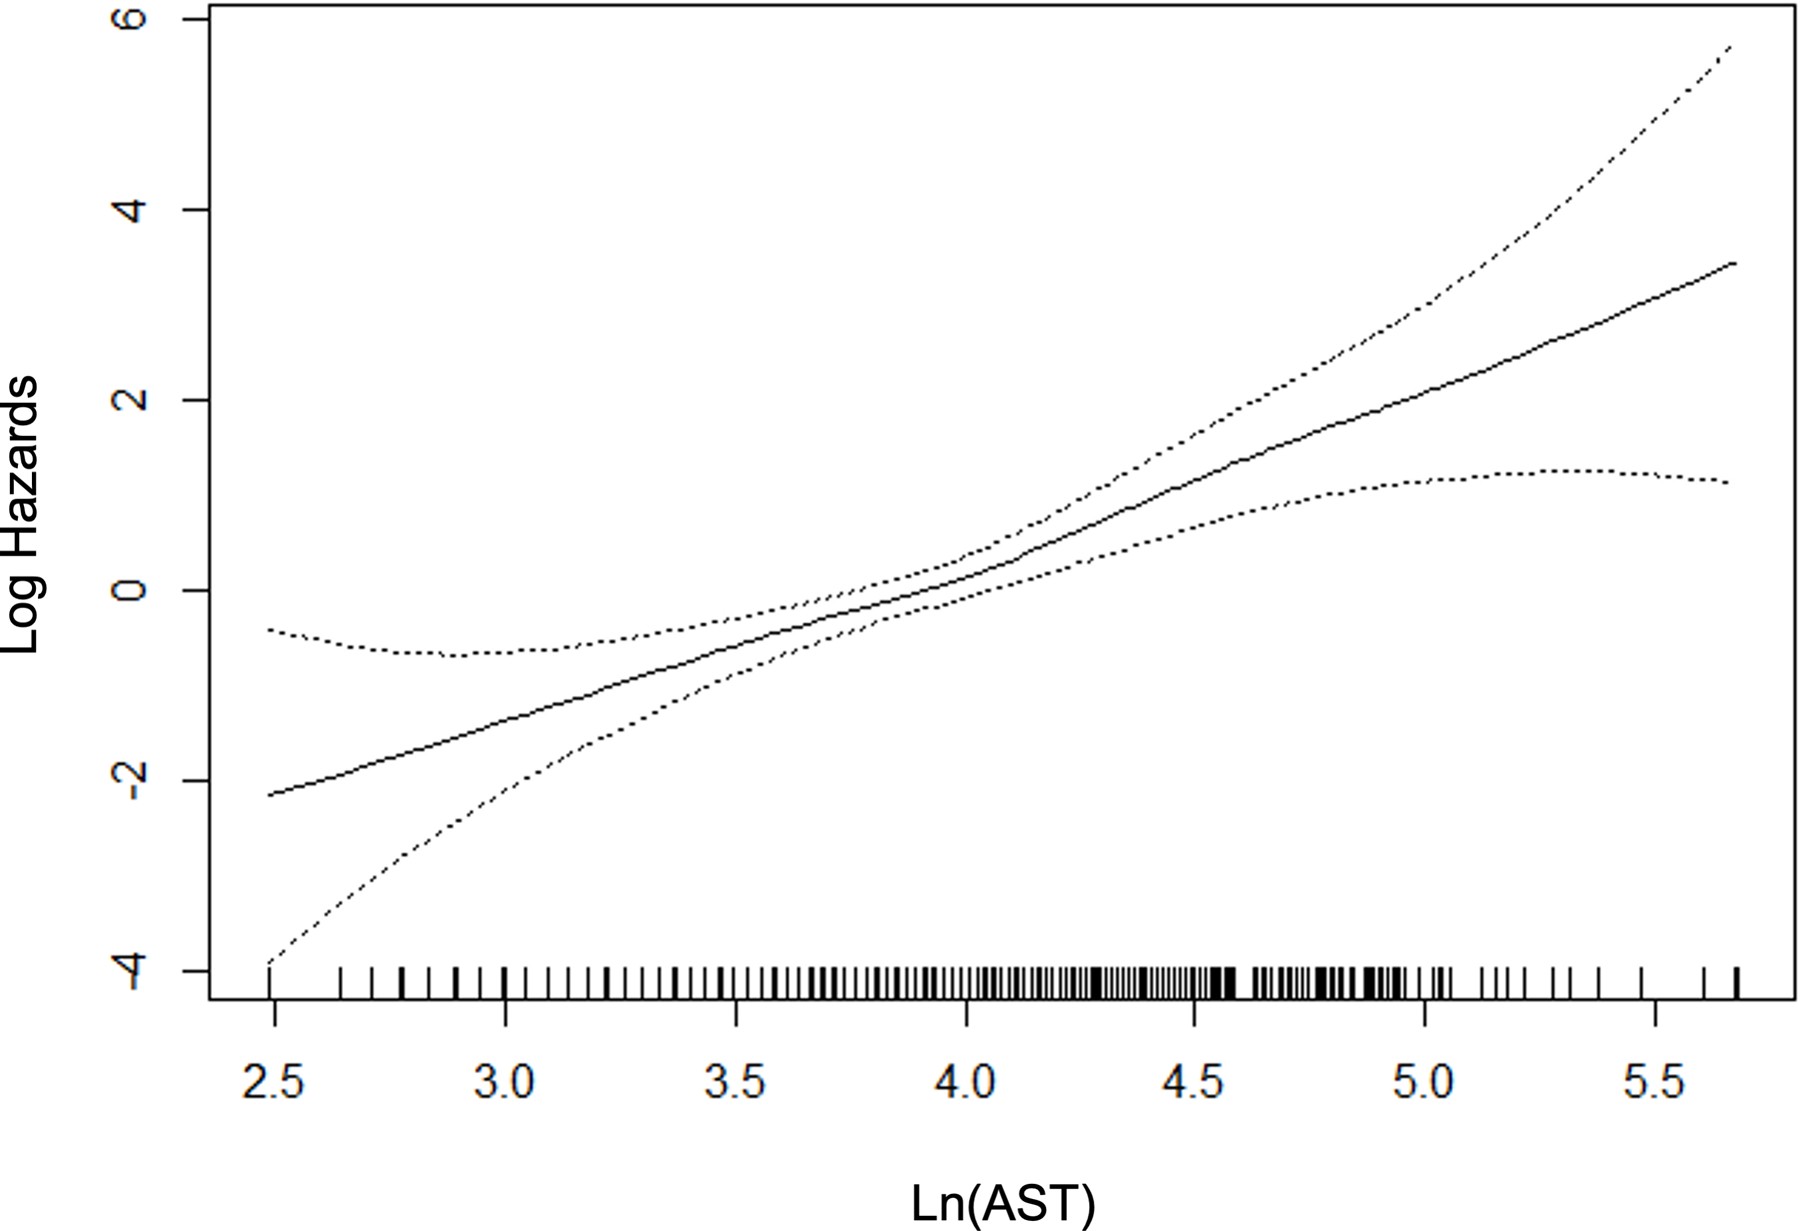
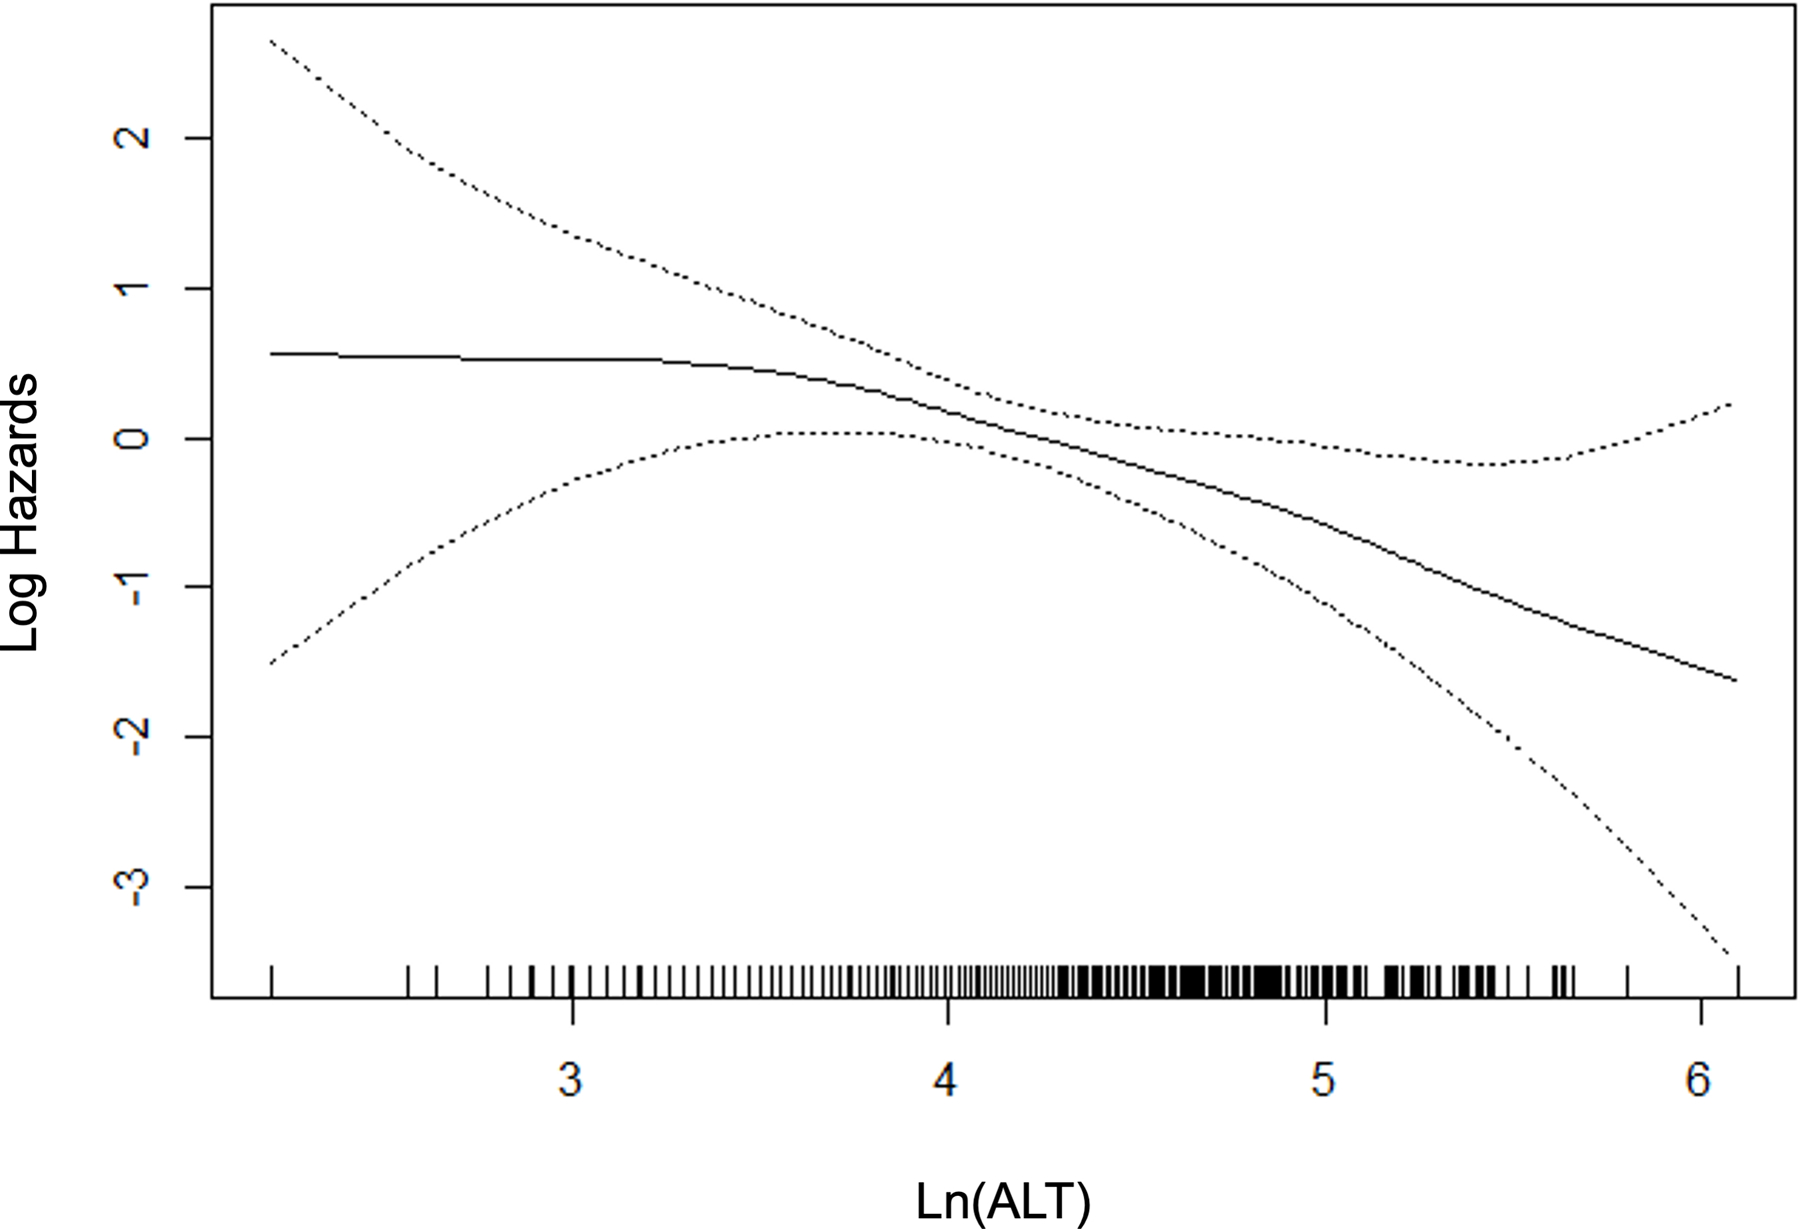
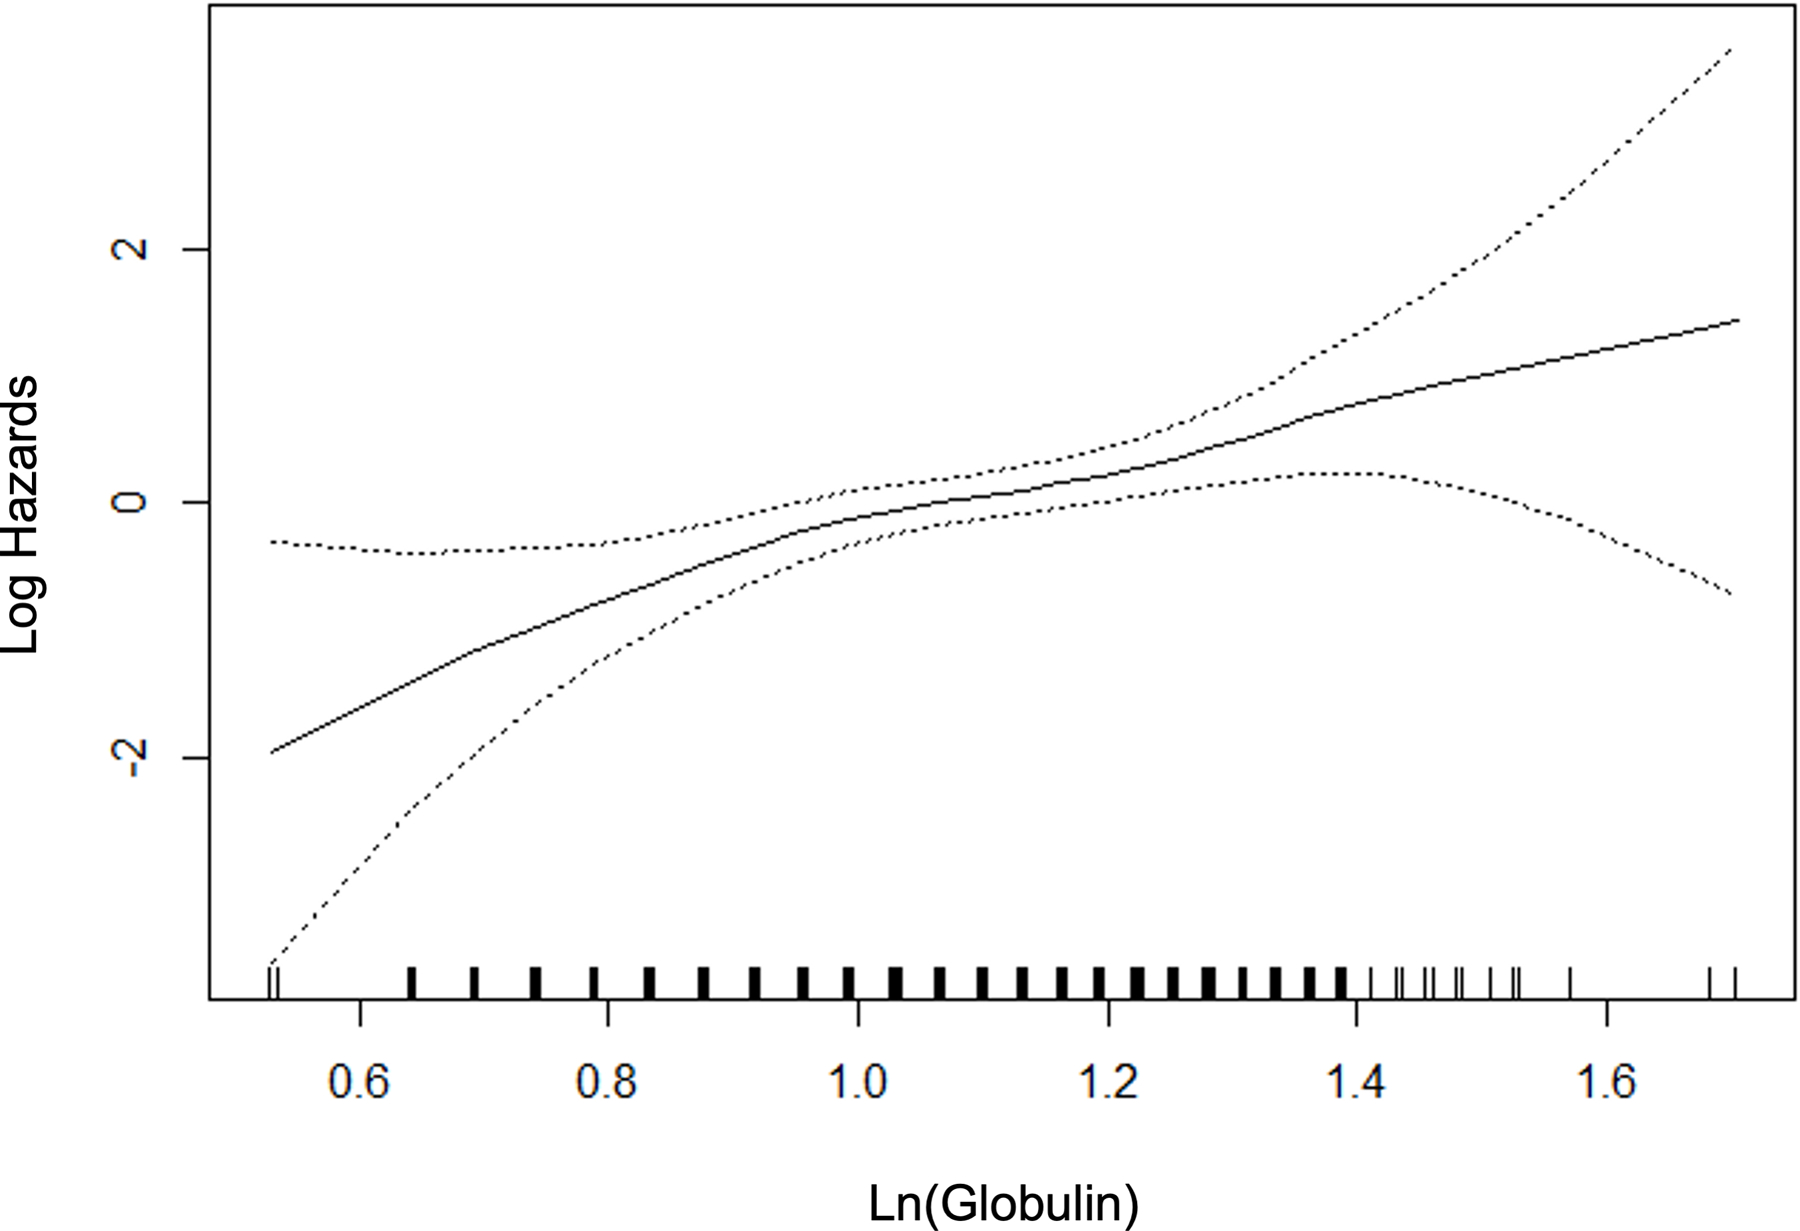
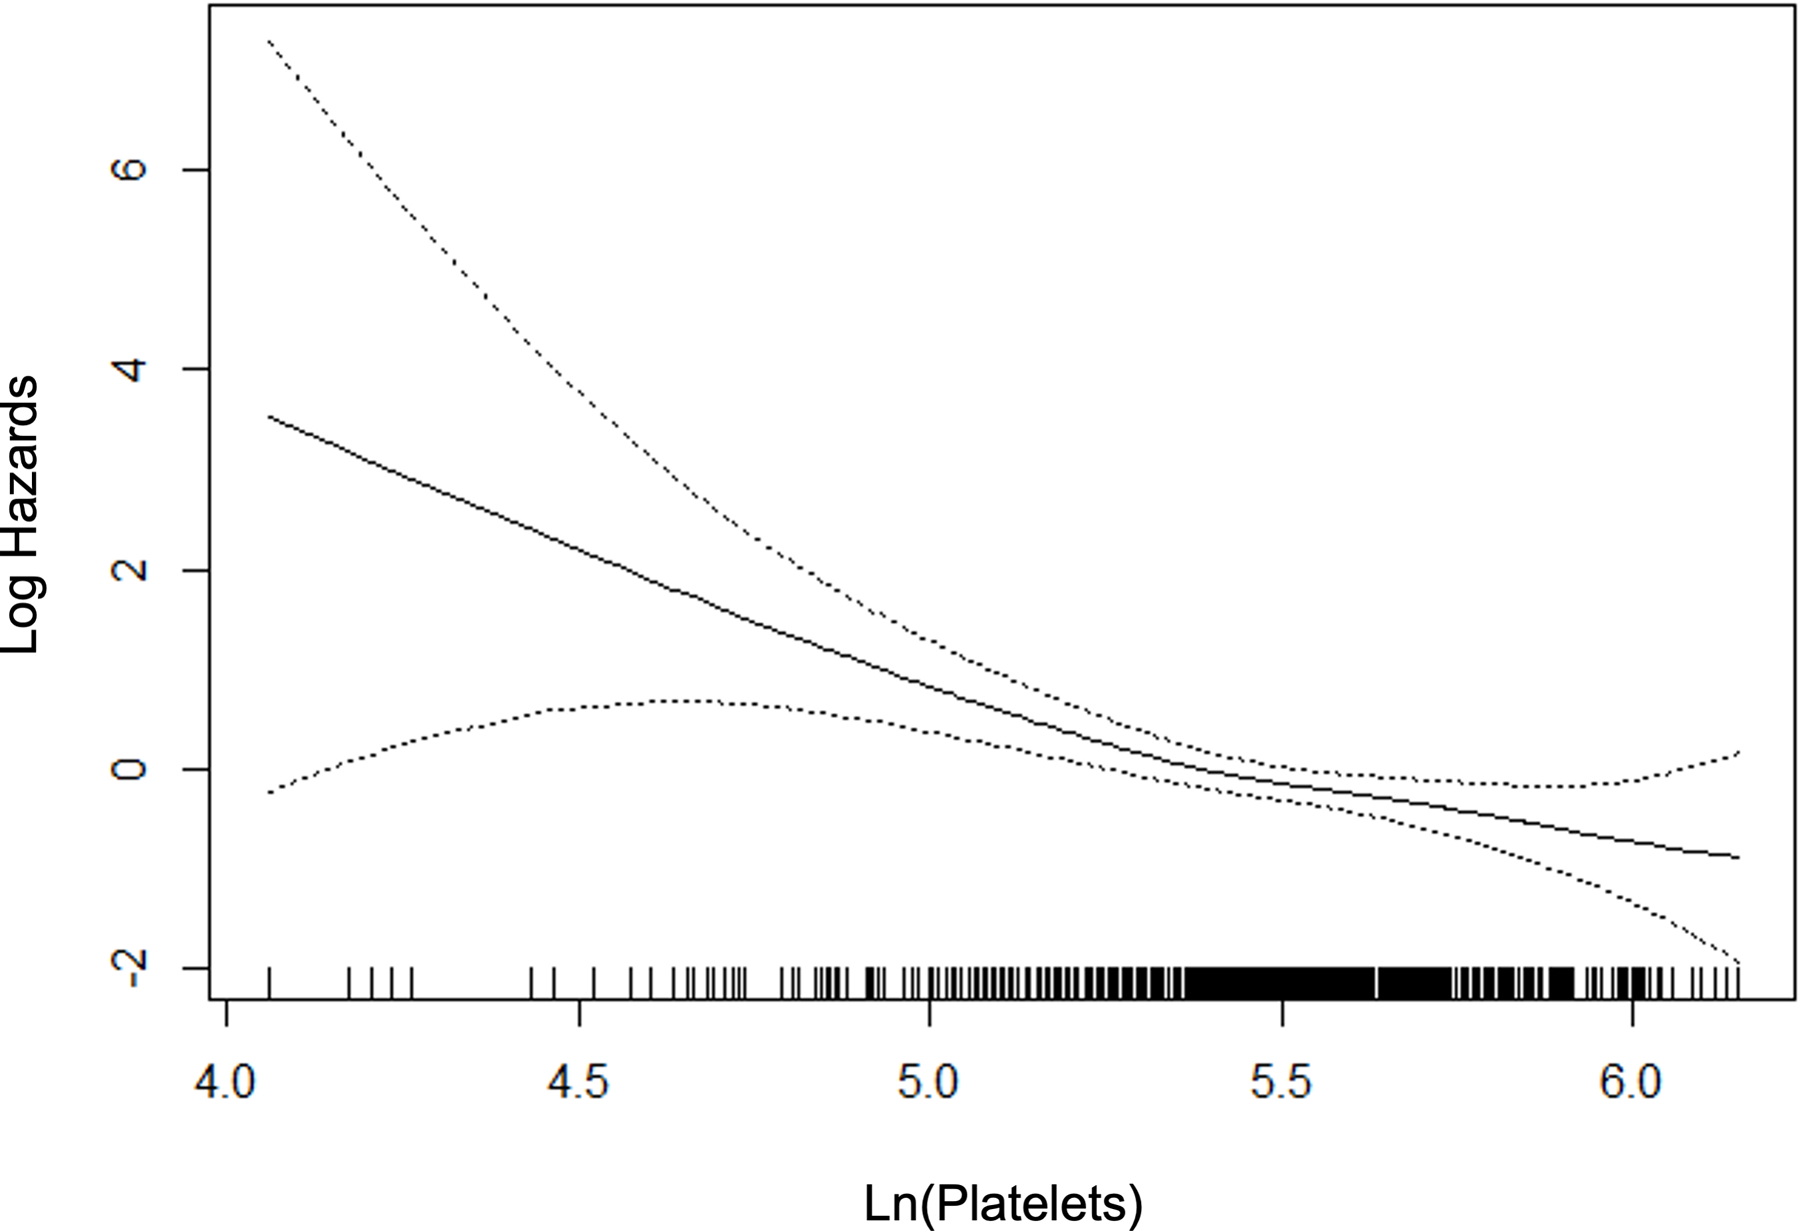
P-splines describing relationship between significant fibrosis and predictor variables.
Table 2 summarizes the final multivariable logistic regression model. There were additional variables with univariate significance (p<0.1) that were considered in the multivariable stage as planned, whereas the final model contained seven variables with multivariable p<0.05 including age, BMI, diabetes, AST, ALT, globulin, and platelets. Other variables were excluded from the final multivariable model: sex, waist circumference, HbA1c, ALP, GGT, INR, hematocrit, and white blood cells. In light of existing literature, total cholesterol, GGT and waist circumference were examined with further attention. However, none of the variables improved the model, given the other variables already present in the model. All three machine learning methods converged and produced models to predict significant fibrosis, utilizing all available variables.
Table 2.
Final Multivariable Model of the SAFE Score
| Variable | Estimate | Odds Ratio | p-value |
|---|---|---|---|
| Age (years) | 0.036 (0.009) | 1.036 (1.019 – 1.054) | <0.0001 |
| BMI* (kg/m2) | 0.072 (0.020) | 1.075 (1.033 – 1.118) | 0.0004 |
| Diabetes | 0.754 (0.227) | 2.126 (1.363 – 3.317) | 0.0009 |
| Ln(AST) (U/L) | 1.858 (0.335) | 6.412 (3.333 – 12.34) | <0.0001 |
| Ln(ALT) (U/L) | −0.699 (0.281) | 0.497 (0.287 – 0.863) | 0.0130 |
| Ln(Globulin)** (g/dL) | 2.346 (0.568) | 10.44 (3.433 – 31.75) | <0.0001 |
| Ln(Platelet Count) (109/L) | −1.699 (0.340) | 0.183 (0.094 – 0.356) | <0.0001 |
BMI > 40 kg/m2 was set to 40 kg/m2
Ln, Natural Logarithm; BMI, Body Mass Index; AST, aspartate aminotransferase; ALT, alanine aminotransferase
Globulin = Total Protein - Albumin
Model Performance in the Testing Sets
The characteristics of testing set participants are included in Table 1. Subjects in testing set #1, by and large, appeared similar to those in the model training set, with respect to the overall characteristics and the comparison between subjects with and without significant fibrosis. Subjects in testing set #2 appeared to represent a slightly different spectrum of NAFLD. For example, they had lower BMI, lower prevalence of diabetes, and lower transaminase activities. Of the 130 subjects in the dataset, 35% had clinically significant fibrosis. All in all, the comparison between patients with and without significant fibrosis mirrored those in the training set and testing set #1.
Figure 3A compares the AUROCs of the new models. In the training set, in which the newly-derived models are expected to perform well because of potential overfitting, the machine learning models, especially RF and GBM, did exceedingly well. However, when applied in testing set #1, they failed to outperform the logistic model. Given the overall diagnostic performance, interpretability and practical applicability, we chose the logistic model as the final model. Figure 3B compares the AUROCs of the new model against those of FIB-4 and NFS. In all three datasets, the new model had significantly better AUROCs than the existing scores.
Figure 3.
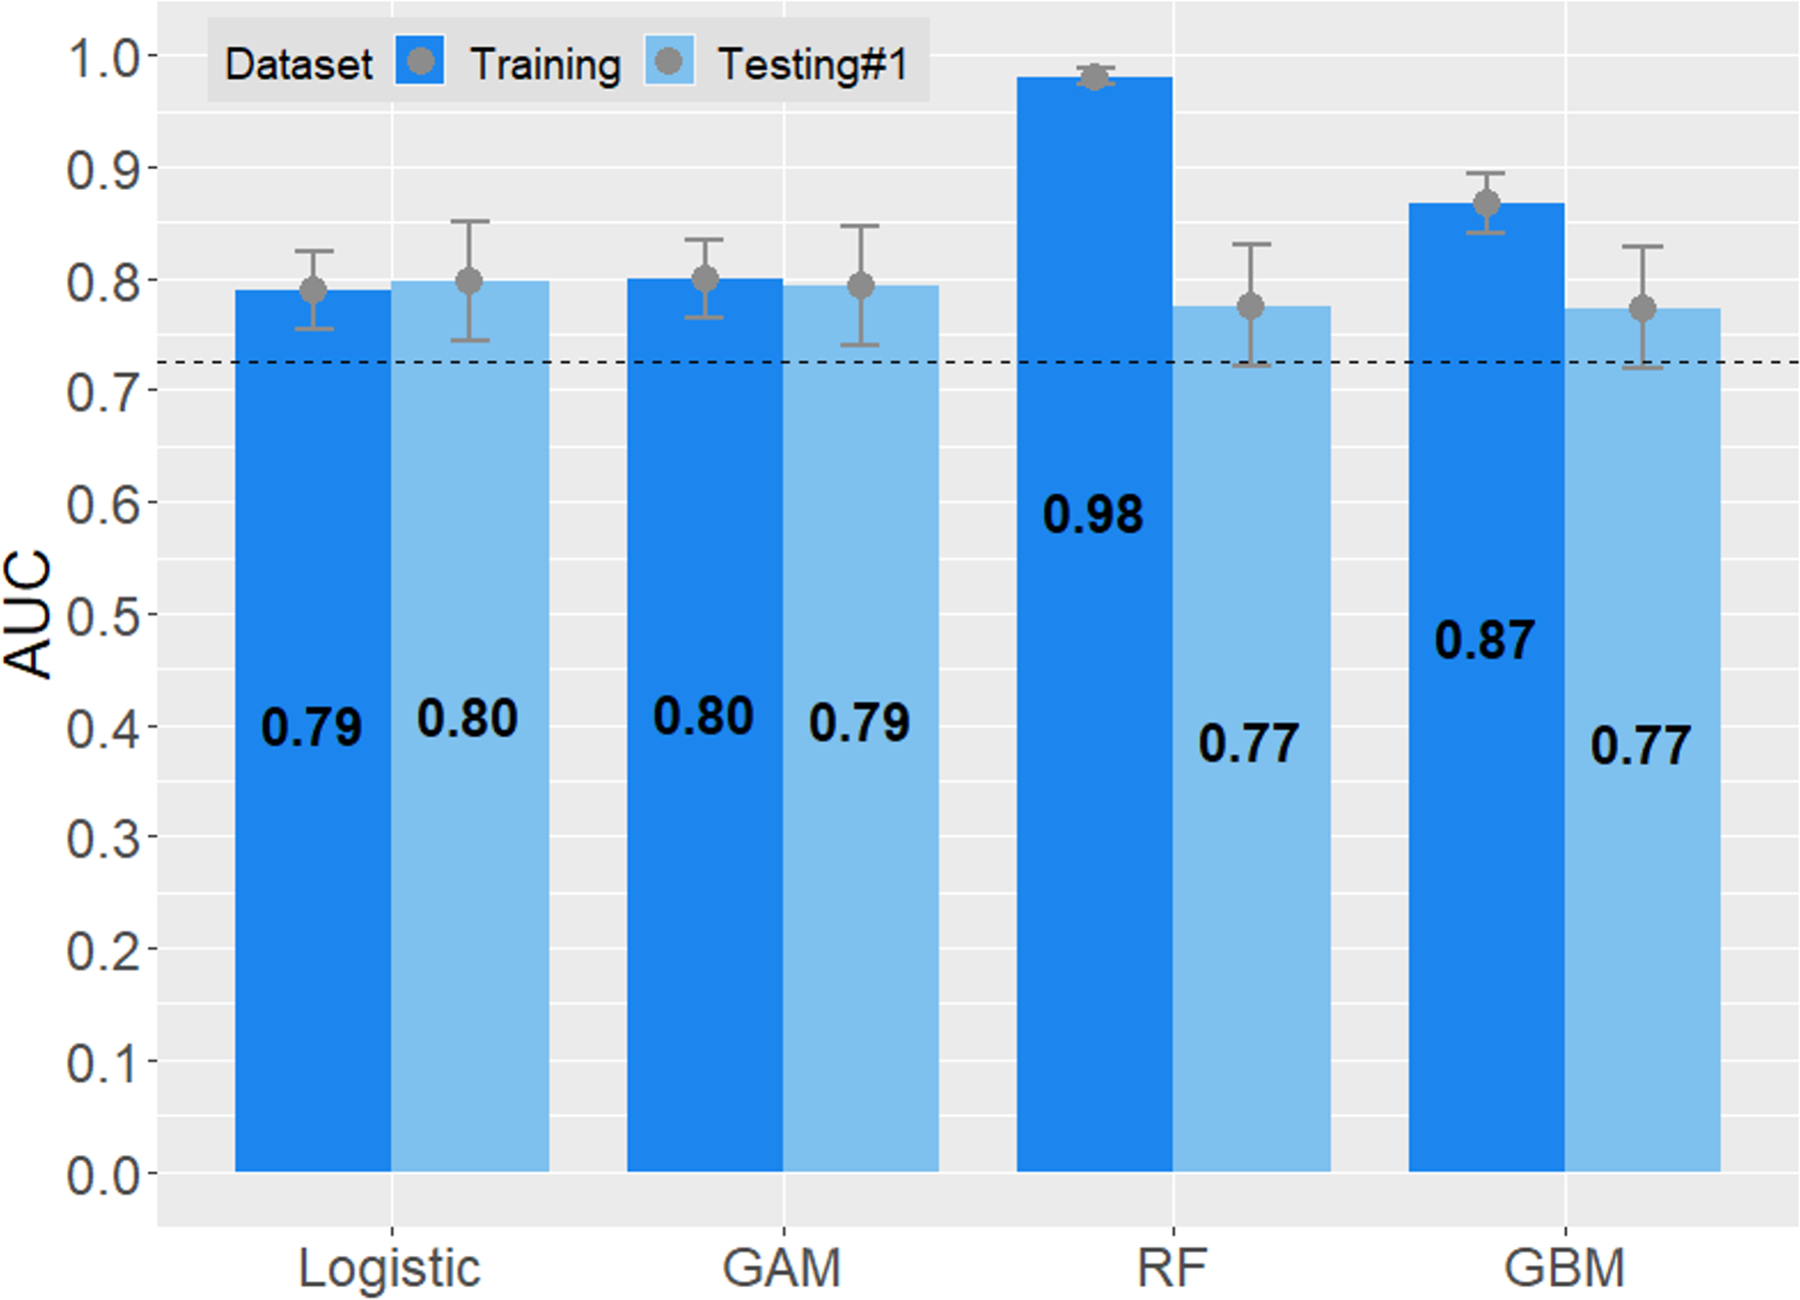
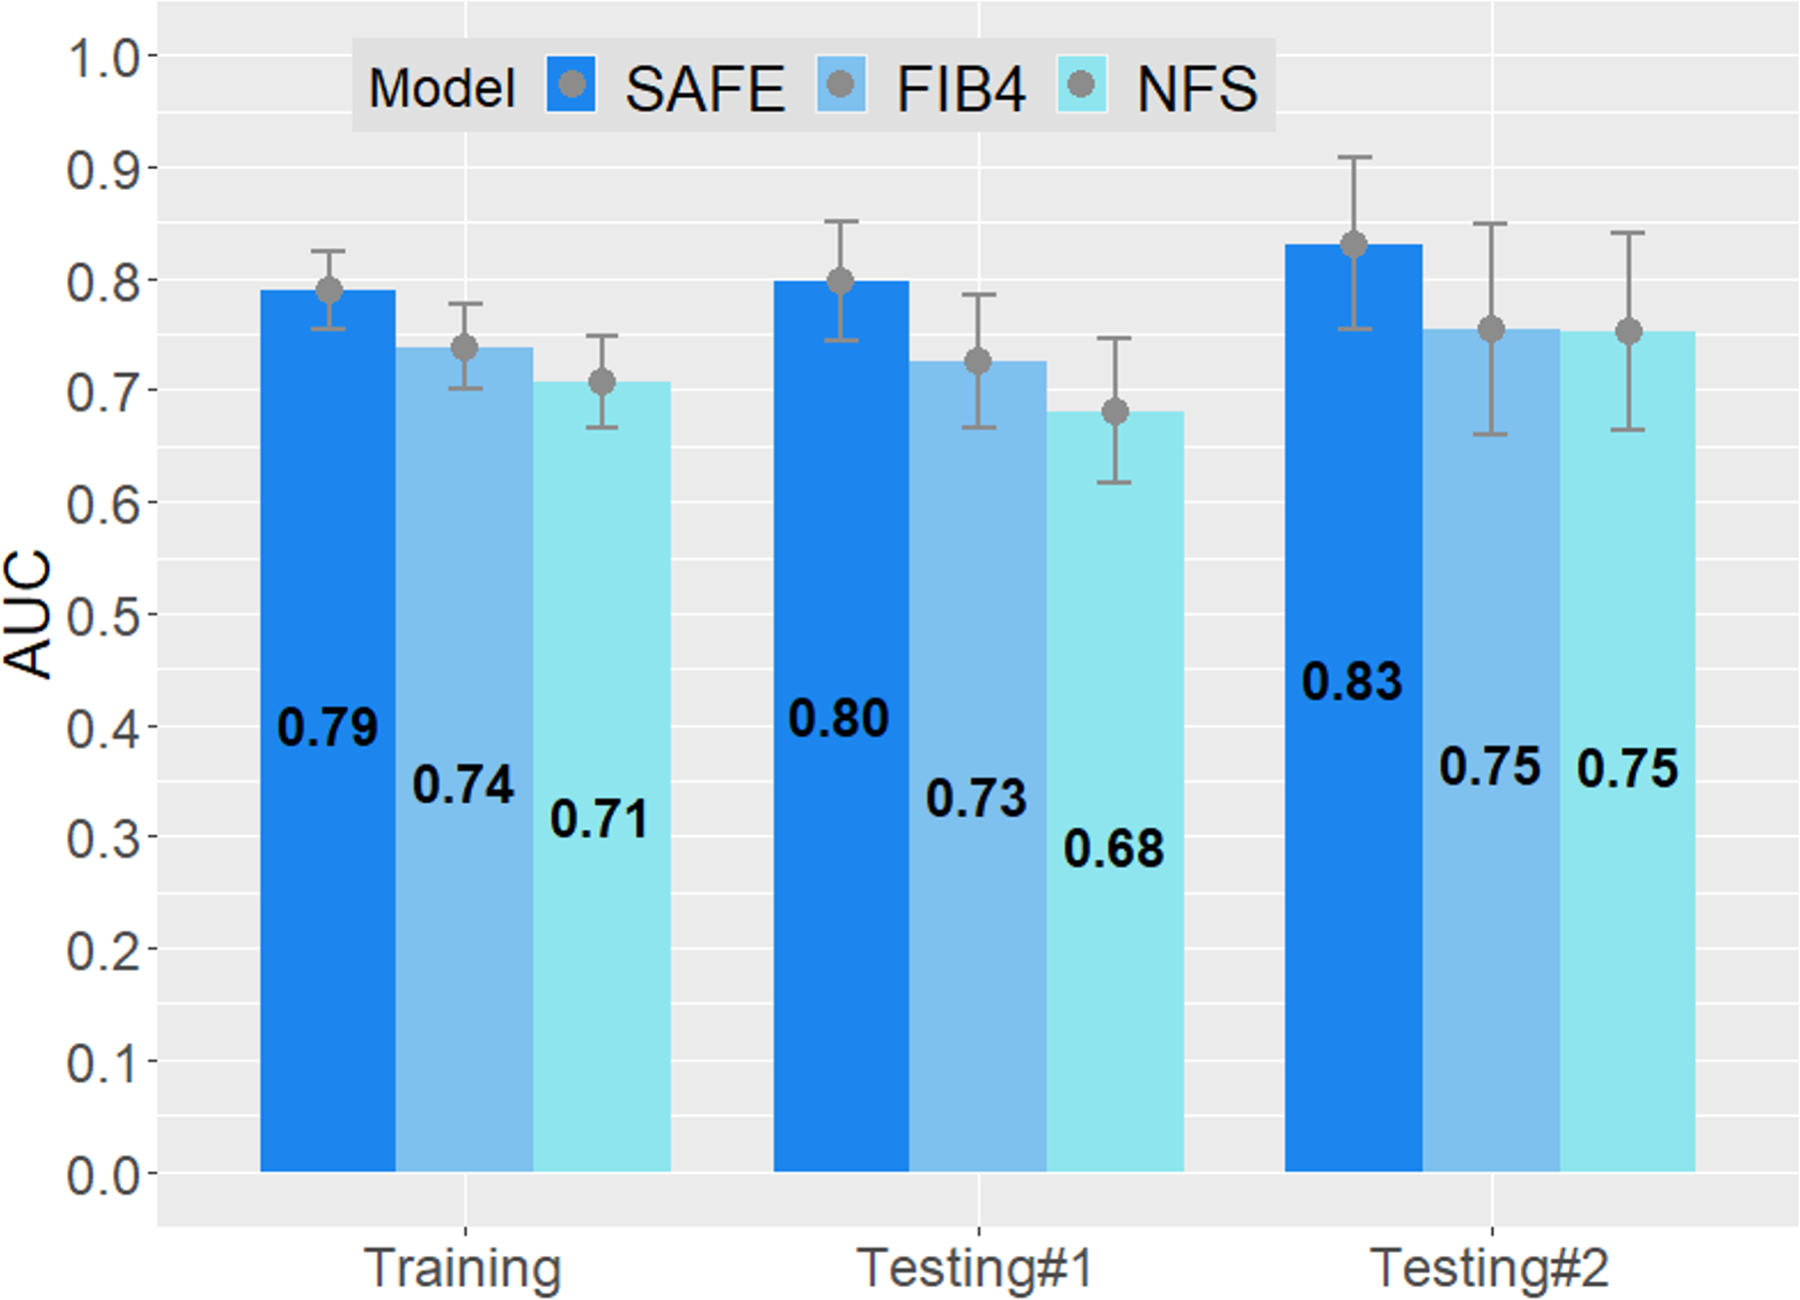
Areas under the receiver operating characteristics (AUROC) curves of prediction models. The upper and lower bar in each column represent 95% confidence interval of AUROCs.
A. New models derived in the training set, applied to testing set #1. Dashed line is the AUROC level of FIB-4.
B. Logistic model compared to FIB-4 and NFS in the training set, testing set #1, and testing set #2. P<0.01 for all comparisons between SAFE and the other two models except SAFE versus NFS in testing set #2 (p=0.03)
The Steatosis-Associated Fibrosis Estimator (SAFE) Score
Next, we determined the diagnostic characteristics of the final model; specifically, we selected two thresholds for clinical application. The lower threshold, which is more important for the primary aim of the study, was optimized to exclude significant fibrosis. The threshold that met the sensitivity threshold of >0.90 established a priori was a raw score of 90. In the training set, this lower threshold resulted in a sensitivity of 90.7% and a negative predictive value (NPV) of 83.6%. The sensitivity and NPV were 97.6% and 87.5%, respectively, in testing set #1, and 95.7% and 91.7%, respectively, in testing set #2. A higher threshold of the score may be set to rule in significant fibrosis. A raw SAFE score of 210 in the training set was associated with a specificity and a positive predictive value (PPV) of 80.5% and 72.5%, respectively. In testing set #1, specificity and PPV were 70.0% and 77.1%, respectively, and were 67.9% and 57.8%, respectively, in testing set #2.
In order to make the SAFE score easier to apply, we rescaled the score such that the lower threshold is set at 0 and the higher threshold at 100. The final formula is expressed below, and may be calculated using an online tool (https://medcalculators.stanford.edu/safe):
In Figure 4, we applied the SAFE score to the subjects in the training set and compute probabilities of F2 and F3/4 using the standard logit to probability conversion formula. At the score of 0, the probability of F0/1 was 75% and that of F3/4 8%, whereas at the score of 100, the probability of ≥F2 was 48% and that of F3/4 24%. Results of similar analyses for testing sets are shown in Supplementary Figure 5. The score achieves its goal of identifying patients with low probability of liver fibrosis in all three data sets. Supplementary Figure 6 correlates fibrosis stage and SAFE, FIB-4 and NFS models.
Figure 4.
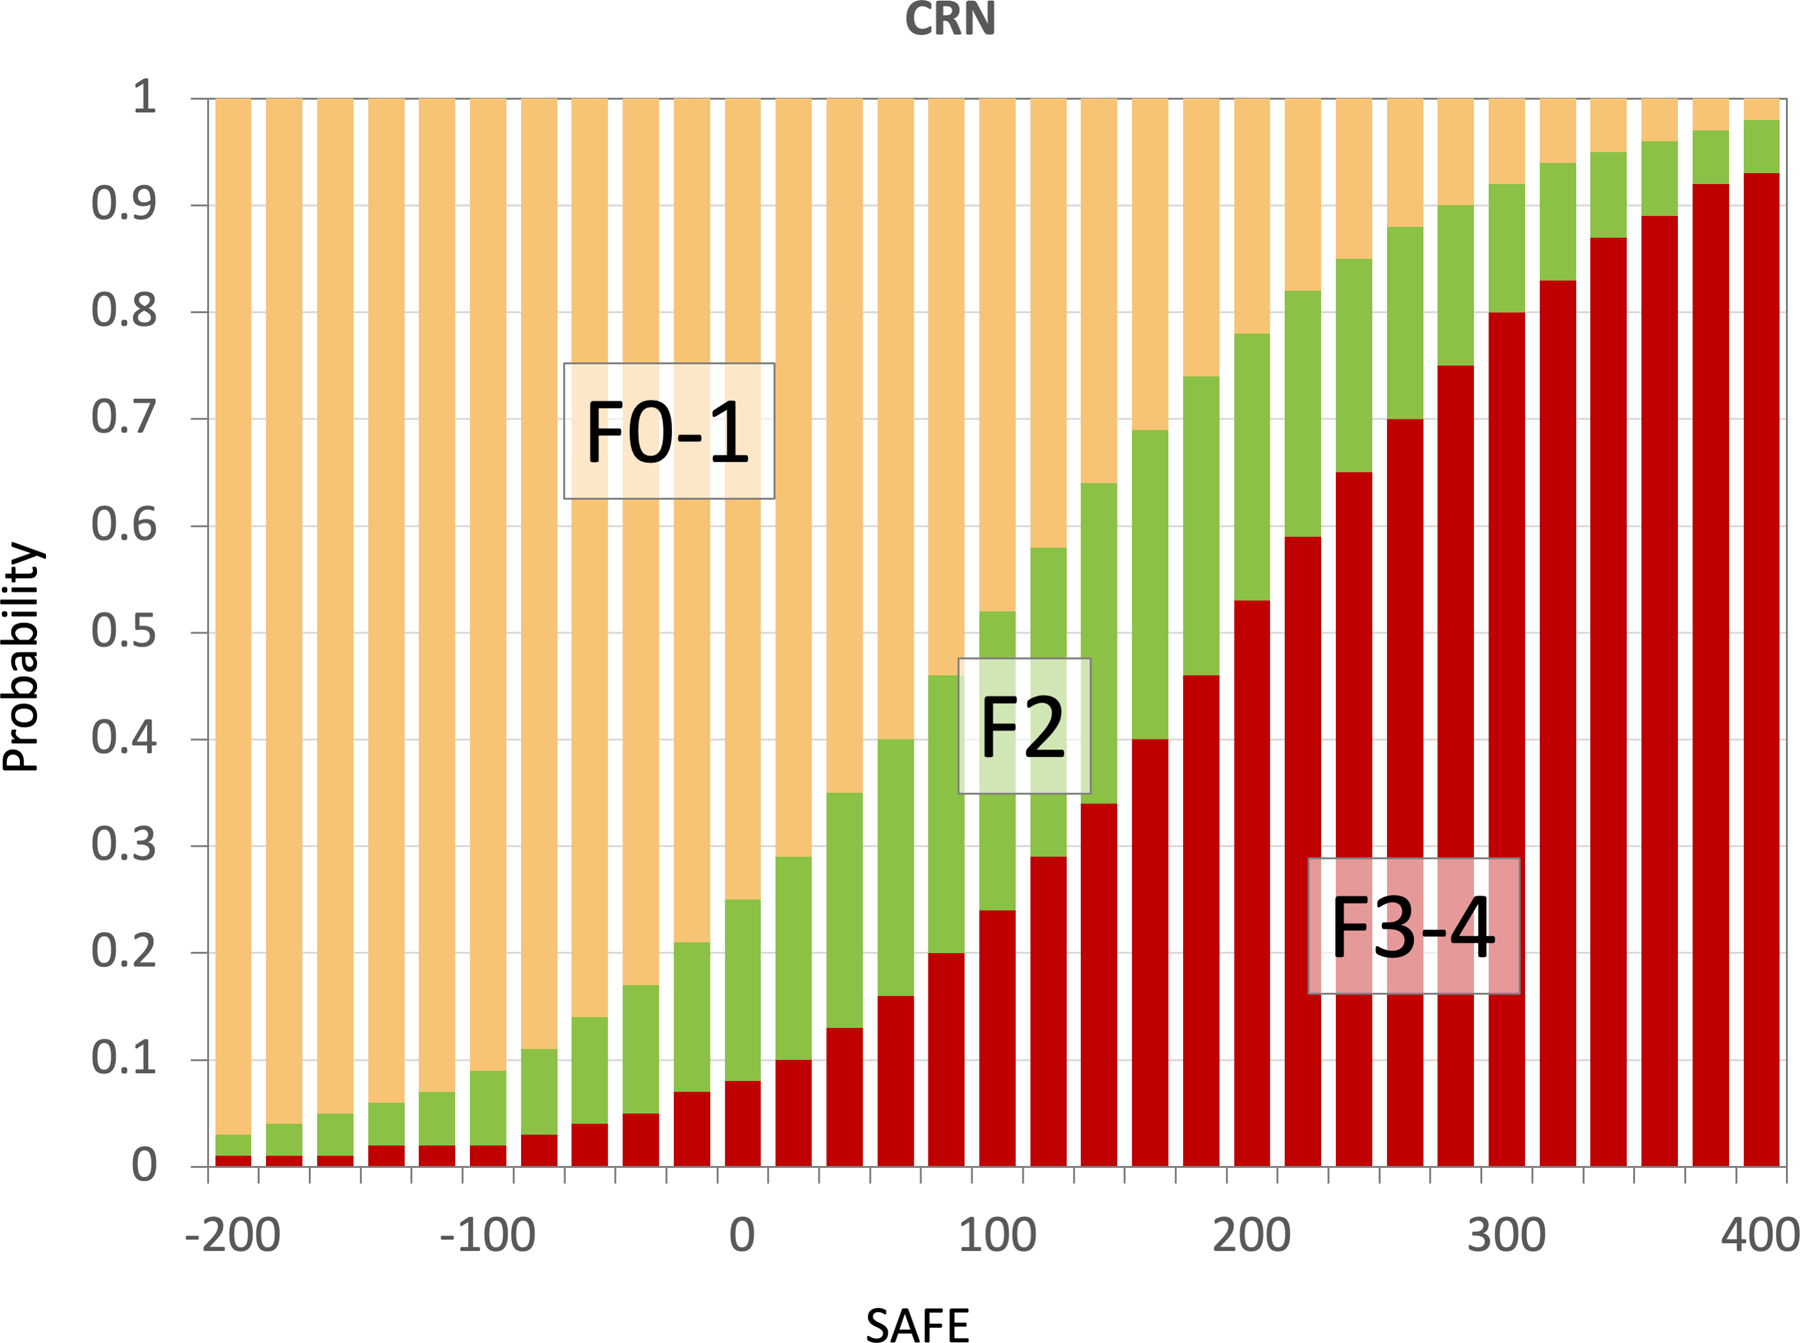
Probabilities of F0/1, F2, F3/4 at SAFE scores −200 to 400 derived from the model training data set.
Impact of the SAFE Score on Mortality Among NAFLD Subjects
Of the 11,953 NHANES III participants who met the eligibility criteria (Supplementary Figure 4), the median age of the entire eligible participants was 41 (IQR: 30–58) years and 45.1% of them were male. The prevalence of NAFLD was 36.0% (n=4,306), as shown in Table 3. As expected from NHANES subjects being representative of the general population, their data portray an earlier end of the fibrosis spectrum, with younger age, lower BMI, and laboratory data closer to normal values, as opposed to NAFLD patients in a research or clinical setting.
Table 3:
Characteristics of NHANES III participants. Data are shown in median (IQR) or N (%).
| Characteristics | Participants without NAFLD | Participants with NAFLD |
||
|---|---|---|---|---|
| SAFE<0 Low risk |
0≤SAFE<100 Indeterminate risk |
SAFE≥100 High risk |
||
|
| ||||
| N=7,647 | N=2,324 | N=1,362 | N=320 | |
| Age, years | 39 (28–55.5) | 36 (28–45) | 57 (45–66) | 64 (56.8–70) |
|
| ||||
| Men | 3372 (44.1) | 1024 (44.1) | 697 (51.2) | 292 (47.1) |
|
| ||||
| Race-ethnicity; | ||||
| Non-Hispanic white | 2919 (38.2) | 816 (35.1) | 496 (36.4) | 221 (35.6) |
| Non-Hispanic black | 2359 (30.8) | 519 (22.3) | 317 (23.3) | 186 (30) |
| Mexican American | 2039 (26.7) | 894 (38.5) | 497 (36.5) | 192 (31) |
| Other | 330 (4.3) | 95 (4.1) | 52 (3.8) | 21 (3.4) |
|
| ||||
| T2D | 511 (6.7) | 116 (5) | 330 (24.2) | 344 (55.5) |
|
| ||||
| Hypertension | 3254 (42.9) | 985 (42.36) | 991 (73.1) | 513 (82.7) |
|
| ||||
| Dyslipidemia | 1272 (16.6) | 307 (13.2) | 345 (25.3) | 164 (26.5) |
|
| ||||
| Smoking status | ||||
| Current smoker | 2143 (28) | 629 (27.1) | 255 (18.7) | 87 (14) |
| Ex-smoker | 1614 (21.1) | 463 (19.9) | 466 (34.2) | 250 (40.3) |
| Non-smoker | 3890 (50.9) | 1231 (53) | 641 (47.1) | 283 (45.6) |
|
| ||||
| BMI, kg/m2 | 25.4 (22.7–28.7) |
26.8 (23.3–30.7) |
30.2 (27.2–34.3) |
32.5 (28.7–37) |
|
| ||||
| AST, U/L | 18 (16–22) | 19 (16–23) | 21 (18–27) | 25 (19–36) |
|
| ||||
| ALT, U/L, | 13 (10–18) | 16 (12–24) | 17 (12–25) | 18 (13–29) |
|
| ||||
| ALP, U/L | 79 (65–96) | 81 (67–97) | 90 (74–109) | 96 (78–118) |
|
| ||||
| Globulin, mg% | 3.2 (2.9–3.5) | 3.2 (2.9–3.5) | 3.3 (3–3.6) | 3.6 (3.3–3.9) |
|
| ||||
| Platelets, *109/L | 268.5 (229–315) |
288.5 (248–339) |
260.5 (223–306) |
226.5 (190–266) |
N, number; T2D, Type 2 Diabetes; BMI, body mass index; AST, aspartate aminotransferase; ALT, alanine aminotransferase; GGT, gamma-glutamyl transpeptidase; A/G, albumin/globulin
When SAFE was applied to NHANES III survey participants with NAFLD, 54.0% had low-probability (n=2,324), 14.4% high-probability (n=620), and 31.6% intermediate-probability (n=1,362) of significant fibrosis. Figure 5 represents Kaplan-Meier survival estimates in the three SAFE score strata in comparison to those without steatosis. After a median follow-up of 22.4 years, the SAFE score at baseline predicted survival among NAFLD subjects. The twenty-year survival rate was 86.8% for NAFLD with a low-risk score (SAFE<0), as compared to 60.5% for those at intermediate risk (SAFE 0–100), and 37.2% for those at high risk (SAFE≥100). The observed survival of low-risk NAFLD subjects exceeded that of survey participants without NAFLD, whose twenty-year survival was 79.1%. FIB-4 and NFS were also associated with survival; however, SAFE outperformed them. The c-statistics for mortality for the first five years were 0.725, 0.711 and 0.707 for SAFE, FIB-4 and NFS, respectively and those for the entire follow up period 0.725, 0.721 and 0.716 for SAFE, FIB-4 and NFS, respectively (p<0.01 for SAFE versus FIB-4 or NFS for both time periods).
Figure 5.
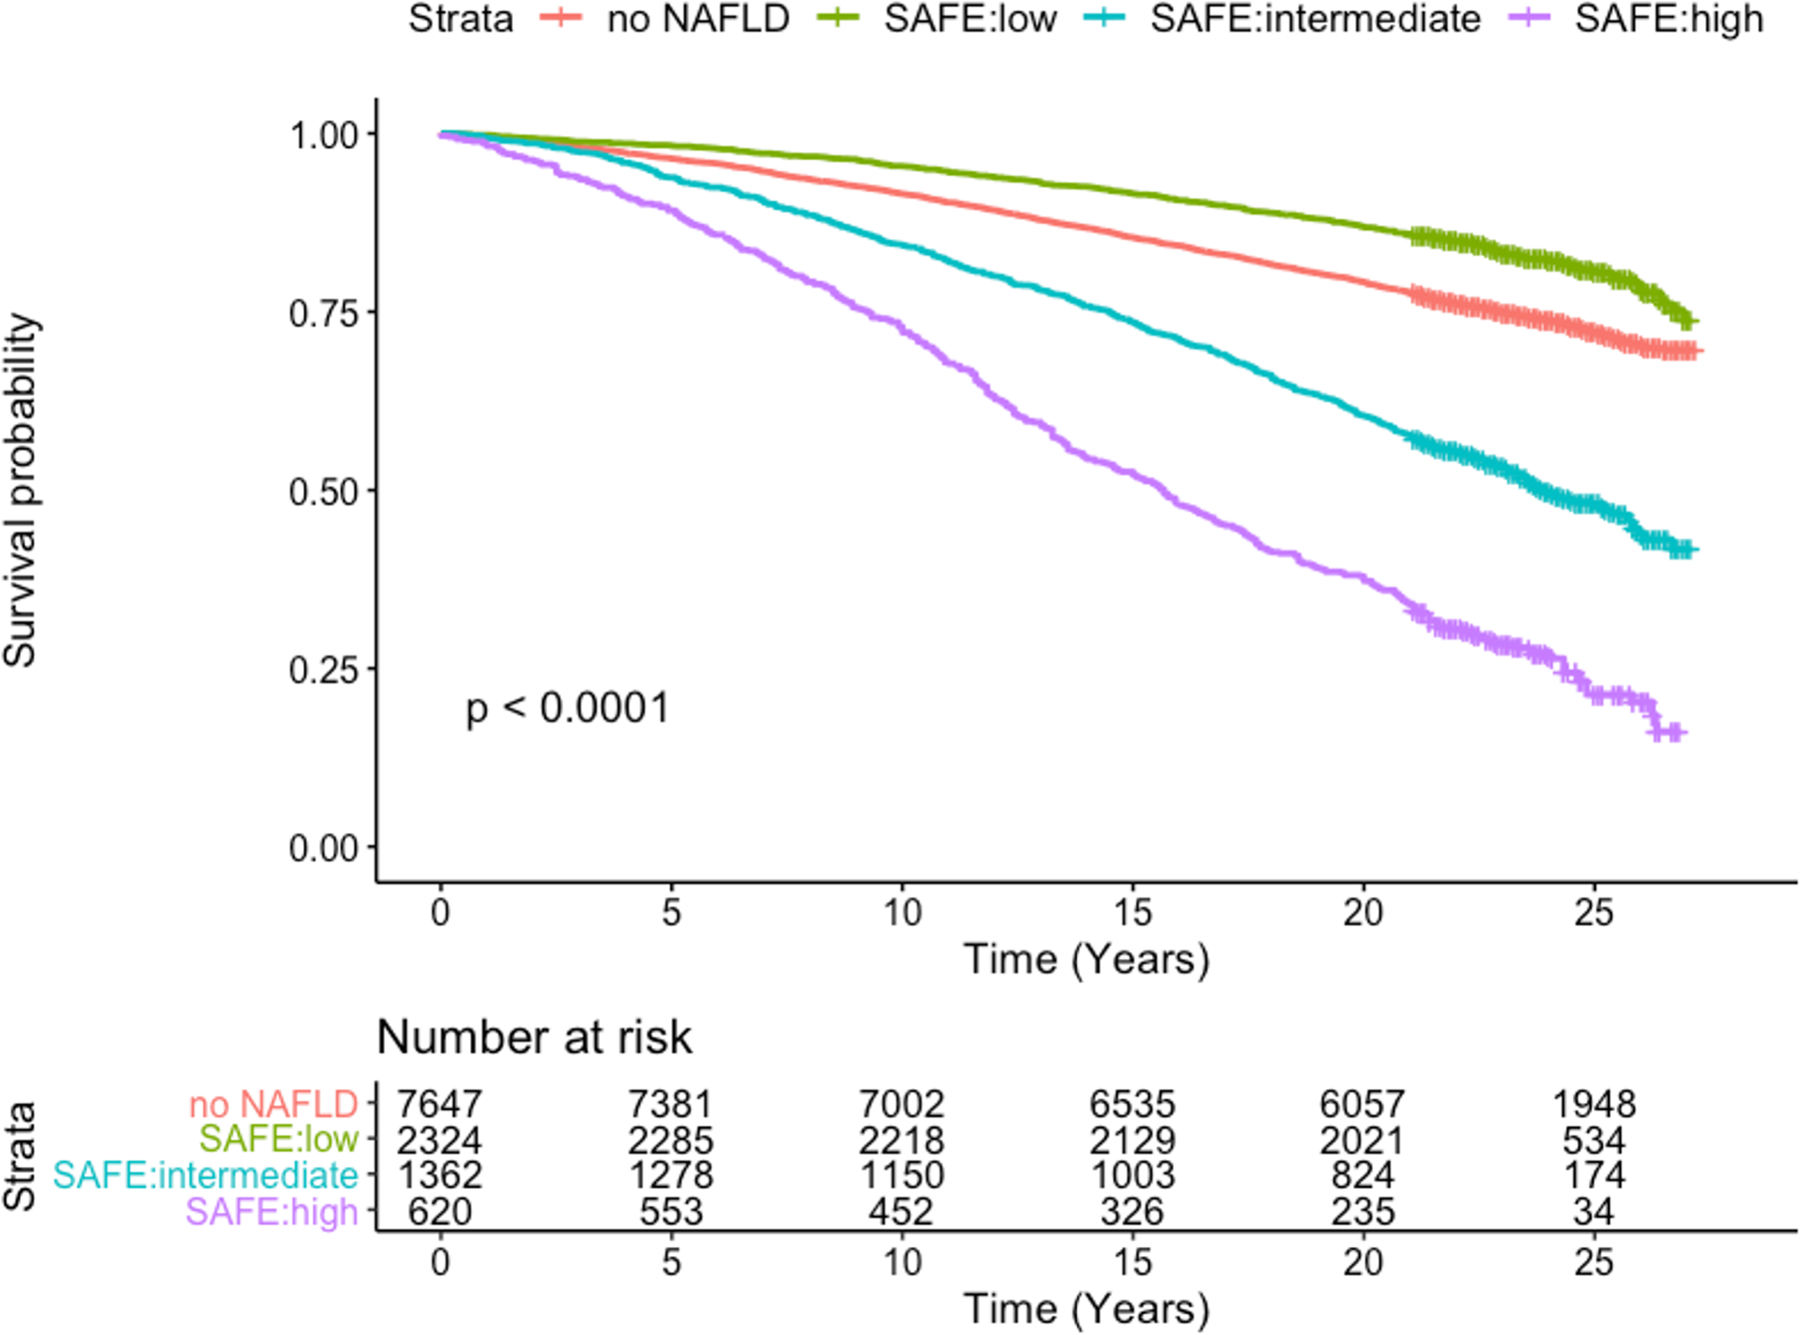
Kaplan-Meier Survival for NHANES III participants according to NAFLD and SAFE score tiers
The association between SAFE and survival was further evaluated with the multivariable Cox regression analysis (Supplementary Figure 7). Compared to those without NAFLD, low-risk NAFLD subjects had no increase in mortality (Hazard Ratio [HR] 0.95, 95% CI 0.86–1.06), whereas high-risk NAFLD subjects experienced a 53% increase in mortality (HR 1.53, 95% CI 1.38–1.71) and those with intermediate scores had a 10% increase (HR 1.10, 95% CI 1.00–1.20). We conducted a sensitivity analysis to minimize influence of age in the score by only including subjects 50 years or older (n=4,149). The results did not change materially, with hazard ratios for low-, intermediate- and high-risk SAFE strata of 0.94 (95% CI 0.80–1.09), 1.07 (95% CI 0.97–1.18) and 1.49 (95% CI 1.34–1.66), respectively.
Discussion
In this study, we develop a novel score for patients who have been diagnosed with NAFLD in primary care, which may estimate clinically significant liver fibrosis and inform future outcomes. Selected among logistic regression and machine learning models, the SAFE score consists of widely available and objective variables, which may be embedded into electronic health record systems. In our validation among a heterogenous group of NAFLD subjects, the score performed better than FIB-4 and NFS. These latter models, calibrated to detect advanced fibrosis, remain relevant for hepatologists’ assessment of NAFLD patients for further diagnostic and therapeutic interventions. For initial evaluation in primary care, however, we believe that differentiating significant (≥F2) from minimal fibrosis is more important, because while F2 fibrosis has demonstrable associations with future risks, it represents reversible degree of fibrosis and provides a safety margin for error in assessment. Although the score was optimized for its negative predictive value in primary care, it may also be useful for estimating probabilities of significant and advanced fibrosis, which may be incorporated in the decision to make referral for a specialty consultation.
The SAFE score has seven variables, including sex, BMI, diabetes status, AST, ALT, platelets and globulin. It was developed entirely new; however, after the fact, we note that this list is very similar to that of NFS, developed well more than a decade ago - the SAFE score includes serum globulin and diabetes instead of serum albumin and diabetes/impaired fasting glucose in NFS.17 Despite the similarities, the model performance was significantly and consistently better for SAFE compared to NFS. NFS was in fact inferior to FIB-4 (consisting of age, AST, ALT, and platelets), which was developed to detect advanced fibrosis in patients co-infected with human immunodeficiency virus (HIV) and hepatitis C.19 It has been shown in multiple studies that FIB-4 outperforms NFS among NAFLD patients,18,20,27 which may indicate that the coefficients of NFS are not fitted well, at least for modern NAFLD patients. By examining individual variables carefully (e.g., Figure 2), we were better able to glean diagnostic information from these variables than NFS. In addition, although this analysis was not meant to be an exhaustive comparison between standard logistic versus various machine learning models, the fact that SAFE was at least comparable to, if not slightly better than, the three commonly used machine learning models provides confidence about the robustness of the score.
We believe that an important observation in this study in support of the SAFE score is its prediction of long-term mortality in NAFLD subjects in the NHANES III dataset; survival of low-risk NAFLD subjects was comparable to that in those without NAFLD. Traditionally, the boundary between benign and serious fatty liver disease is thought to be simple steatosis versus steatohepatitis. The distinction, defined by histopathology, remains important; however, our data support the emerging body of literature that fibrosis constitutes the predominant prognostic indicator of long-term outcomes in patients with NAFLD.28 While we were not able to correlate the SAFE score with liver-specific outcomes, we believe that the association of SAFE with long term overall mortality remains highly relevant in primary care. To the degree that NAFLD constitutes a hepatic manifestation of metabolic syndrome, a systemic disease that has a pervasive impact on the health of the individual, a high SAFE score may point to the urgency with which metabolic interventions should be pursued.
We acknowledge potential limitations to this study. Although significantly better than FIB-4 or NFS, the SAFE score is far from being perfectly discriminating, indicating that a certain proportion of patients are misclassified. Some inaccuracies are an inevitable nature of all diagnostic tests, especially when the gold standard itself (e.g., histology) may be subject to variability. For example, the ELF score is a custom-created propriety test, based on molecular markers of fibrosis. In a recent meta-analysis reported that the AUROC of ELF in detecting ≥F2 was 0.81 (95% CI 0.66–0.89), whereas SAFE has an AUROC of 0.80 in testing set #1 and 0.83 in testing #2. Further, for the specific purpose of ruling out significant fibrosis, we expect that the NPV of the SAFE score will improve further when it is applied in the intended setting, namely primary care, where the low prevalence of significant fibrosis will naturally reduce false negatives. Further, if the score were to be repeated as a part of annual follow-up of known NAFLD patients, trends established from repeated measurements may improve the performance, particularly in patients with an intermediate score. Studies collecting serial data to evaluate longitudinal trends of SAFE and fibrosis over time are under way.
Similarly, a risk stratification tool would be most useful if it is also able to guide referral decisions with certainty. The utility of such a model would depend on the PPV for and prevelance of significant fibrosis. The PPV for SAFE in detecting significant fibrosis was 58% to 77% in the testing sets. This compares to that of the ELF score, whose PPV ranged from 22% to 66% for detecting ≥F2.21 From Figure 4, we believe a SAFE score of 100 is a reasonable threshold for the purpose, which is associated with ~25% probability of advanced fibrosis and ~50% probability of significant fibrosis. In the NHANES set, this group constitutes 14% of all NAFLD, which projects of tens of millions subjects, raising a question to what extent existing pool of specialists with hepatology expertise may handle such a large volume. Thus, how best our score is to be applied in this context warrants further studies.
Clearly, the SAFE score does not distinguish between patients with non-fibrotic NASH and simple steatosis, but given the relatively slow progressive nature of NASH fibrosis, there may be multiple opportunities for follow-up of SAFE scores over time to reveal disease progression.22 Lastly, most of the NAFLD subjects included in this study had abnormal (>25 kg/m2) BMI, including >90% of the trial subjects and >75% of NHANES III participants with NAFLD. Future studies may address whether SAFE may be useful for NAFLD patients who are lean. Similarly, the study sample lacked sufficient representation of Asian patients, for whom the thresholds for abnormal BMI are different than for people of other races. Whether a different BMI coefficient needs to be used for Asians was not ascertained in the current study; ongoing analyses are addressing these questions.
In conclusion, we have developed a new model, the SAFE score, to rule out clinically significant fibrosis among subjects with NAFLD. The SAFE score incorporates commonly available and well-characterized clinical and laboratory parameters, and is validated in two independent datasets. Consistent with the rationale that clinically significant fibrosis correlates with long-term prognosis, the model, trained to estimate liver fibrosis, is shown to be predictive of long-term survival. While prospective, empirical studies to implement algorithms based on the SAFE score are needed, we propose that the score may be used in the initial assessment of NAFLD patients in primary care and to improve pre-test probabilities in their diagnostic evaluation.
Supplementary Material
S. Figures 1–4. Study samples
S. Figure 5. Probabilities of F0/1, F2, F3/4 at SAFE scores −200 to 400 derived from the testing sets.
A. Data derived from Training set #1.
B. Data derived from Training set #2.
S. Figure 6. Distribution of fibrosis scores by stage of fibrosis in the CRN data set.
A. SAFE score
B. FIB-4
C. NFS
S. Figure 7. Hazard ratios for long-term mortality in NHANES III examinees
A. Unadjusted hazard ratios
B. Multivariable-adjusted hazard ratios
Funding:
This work was supported by a grant from the National Institutes of Health (DK-127224, WRK). Dr. Kwong is supported in part by the AASLD Foundation and the National Institutes of Health (K23 AA-029197). The funding organization played no role in the design and conduct of the study, in the collection, management, analysis, and interpretation of the data, or in the preparation, review, or approval of the manuscript.
References
- 1.Younossi ZM, Koenig AB, Abdelatif D, Fazel Y, Henry L, Wymer M. Global epidemiology of nonalcoholic fatty liver disease-Meta-analytic assessment of prevalence, incidence, and outcomes. Hepatology 2016;64(1):73–84. [DOI] [PubMed] [Google Scholar]
- 2.Younossi ZM, Stepanova M, Younossi Y, et al. Epidemiology of chronic liver diseases in the USA in the past three decades. Gut 2019. [DOI] [PubMed]
- 3.Angulo P. Nonalcoholic fatty liver disease. N Engl J Med 2002;346(16):1221–1231. [DOI] [PubMed] [Google Scholar]
- 4.Kleiner DE, Brunt EM, Van Natta M, et al. Design and validation of a histological scoring system for nonalcoholic fatty liver disease. Hepatology 2005;41(6):1313–1321. [DOI] [PubMed] [Google Scholar]
- 5.Dulai PS, Singh S, Patel J, et al. Increased risk of mortality by fibrosis stage in nonalcoholic fatty liver disease: Systematic review and meta-analysis. Hepatology 2017;65(5):1557–1565. [DOI] [PMC free article] [PubMed] [Google Scholar]
- 6.Hagström H, Nasr P, Ekstedt M, et al. Fibrosis stage but not NASH predicts mortality and time to development of severe liver disease in biopsy-proven NAFLD. J Hepatol 2017;67(6):1265–1273. [DOI] [PubMed] [Google Scholar]
- 7.Younossi ZM, Ong JP, Takahashi H, et al. A Global Survey of Physicians Knowledge About Nonalcoholic Fatty Liver Disease. Clin Gastroenterol Hepatol 2021. [DOI] [PubMed]
- 8.Méndez-Sánchez N, Chavez-Tapia NC, Almeda-Valdes P, Uribe M. The management of incidental fatty liver found on imaging. What do we need to do? Am J Gastroenterol 2018;113(9):1274–1276. [DOI] [PubMed] [Google Scholar]
- 9.Saeed N, Glass LM, Habbal H, et al. Primary care and referring physician perspectives on non-alcoholic fatty liver disease management: a nationwide survey. Therap Adv Gastroenterol 2021;14:17562848211042200. [DOI] [PMC free article] [PubMed] [Google Scholar]
- 10.Anonymous. EASL-EASD-EASO Clinical Practice Guidelines for the management of non-alcoholic fatty liver disease. J Hepatol 2016;64(6):1388–1402. [DOI] [PubMed] [Google Scholar]
- 11.Anonymous. American Diabetes Association. 4. Comprehensive Medical Evaluation and Assessment of Comorbidities: Standards of Medical Care in Diabetes-2021. Diabetes Care 2021;44:S40–S52. [DOI] [PubMed] [Google Scholar]
- 12.Chalasani N, Younossi Z, Lavine JE, et al. The diagnosis and management of nonalcoholic fatty liver disease: Practice guidance from the American Association for the Study of Liver Diseases. Hepatology 2018;67(1):328–357. [DOI] [PubMed] [Google Scholar]
- 13.Tsochatzis EA, Newsome PN. Non-alcoholic fatty liver disease and the interface between primary and secondary care. Lancet Gastroenterol Hepatol 2018;3(7):509–517. [DOI] [PubMed] [Google Scholar]
- 14.Mofrad P, Contos MJ, Haque M, et al. Clinical and histologic spectrum of nonalcoholic fatty liver disease associated with normal ALT values. Hepatology 2003;37(6):1286–1292. [DOI] [PubMed] [Google Scholar]
- 15.Castera L. Diagnosis of non-alcoholic fatty liver disease/non-alcoholic steatohepatitis: Non-invasive tests are enough. Liver Int 2018;38 Suppl 1:67–70. [DOI] [PubMed] [Google Scholar]
- 16.Miele L, Zocco MA, Pizzolante F, et al. Use of imaging techniques for non-invasive assessment in the diagnosis and staging of non-alcoholic fatty liver disease. Metabolism 2020;112:154355. [DOI] [PubMed] [Google Scholar]
- 17.Angulo P, Hui JM, Marchesini G, et al. The NAFLD fibrosis score: a noninvasive system that identifies liver fibrosis in patients with NAFLD. Hepatology 2007;45(4):846–854. [DOI] [PubMed] [Google Scholar]
- 18.McPherson S, Stewart SF, Henderson E, Burt AD, Day CP. Simple non-invasive fibrosis scoring systems can reliably exclude advanced fibrosis in patients with non-alcoholic fatty liver disease. Gut 2010;59(9):1265–1269. [DOI] [PubMed] [Google Scholar]
- 19.Sterling RK, Lissen E, Clumeck N, et al. Development of a simple noninvasive index to predict significant fibrosis in patients with HIV/HCV coinfection. Hepatology 2006;43(6):1317–1325. [DOI] [PubMed] [Google Scholar]
- 20.Vilar-Gomez E, Chalasani N. Non-invasive assessment of non-alcoholic fatty liver disease: Clinical prediction rules and blood-based biomarkers. J Hepatol 2018;68(2):305–315. [DOI] [PubMed] [Google Scholar]
- 21.Vali Y, Lee J, Boursier J, et al. Enhanced liver fibrosis test for the non-invasive diagnosis of fibrosis in patients with NAFLD: A systematic review and meta-analysis. J Hepatol 2020;73(2):252–262. [DOI] [PubMed] [Google Scholar]
- 22.Hagström H, Talbäck M, Andreasson A, Walldius G, Hammar N. Ability of Noninvasive Scoring Systems to Identify Individuals in the Population at Risk for Severe Liver Disease. Gastroenterology 2020;158(1):200–214. [DOI] [PubMed] [Google Scholar]
- 23.Neuschwander-Tetri BA, Clark JM, Bass NM, et al. Clinical, laboratory and histological associations in adults with nonalcoholic fatty liver disease. Hepatology 2010;52(3):913–924. [DOI] [PMC free article] [PubMed] [Google Scholar]
- 24.Neuschwander-Tetri BA, Loomba R, Sanyal AJ, et al. Farnesoid X nuclear receptor ligand obeticholic acid for non-cirrhotic, non-alcoholic steatohepatitis (FLINT): a multicentre, randomised, placebo-controlled trial. Lancet 2015;385(9972):956–965. [DOI] [PMC free article] [PubMed] [Google Scholar]
- 25.Kim D, Kim WR, Kim HJ, Therneau TM. Association between noninvasive fibrosis markers and mortality among adults with nonalcoholic fatty liver disease in the United States. Hepatology 2013;57(4):1357–1365. [DOI] [PMC free article] [PubMed] [Google Scholar]
- 26.Anonymous. About the National Health and Nutrition Examination Survey National Center for Health Statistics. https://www.cdc.gov/nchs/nhanes/about_nhanes.htm. Accessed 10/17, 2021. [Google Scholar]
- 27.Polyzos SA, Slavakis A, Koumerkeridis G, Katsinelos P, Kountouras J. Noninvasive Liver Fibrosis Tests in Patients with Nonalcoholic Fatty Liver Disease: An External Validation Cohort. Horm Metab Res 2019;51(2):134–140. [DOI] [PubMed] [Google Scholar]
- 28.Sanyal AJ, Van Natta ML, Clark J, et al. Prospective Study of Outcomes in Adults with Nonalcoholic Fatty Liver Disease. New England Journal of Medicine 2021;385(17):1559–1569. [DOI] [PMC free article] [PubMed] [Google Scholar]
Associated Data
This section collects any data citations, data availability statements, or supplementary materials included in this article.
Supplementary Materials
S. Figures 1–4. Study samples
S. Figure 5. Probabilities of F0/1, F2, F3/4 at SAFE scores −200 to 400 derived from the testing sets.
A. Data derived from Training set #1.
B. Data derived from Training set #2.
S. Figure 6. Distribution of fibrosis scores by stage of fibrosis in the CRN data set.
A. SAFE score
B. FIB-4
C. NFS
S. Figure 7. Hazard ratios for long-term mortality in NHANES III examinees
A. Unadjusted hazard ratios
B. Multivariable-adjusted hazard ratios


