

Abstract
In contrast to Aβ plaques, the spatiotemporal distribution of neurofibrillary tangles of hyperphosphorylated tau (p-tau) predicts cognitive impairment in Alzheimer’s disease (AD), underscoring the key pathological role of p-tau and the utmost need to develop AD therapeutics centering upon the control of p-tau aggregation and cytotoxicity. Our drug discovery program is focused on compounds that prevent the aggregation and cytotoxicity of p-tau moieties of the tau isoform 1N4R due to its prevalence (1 N) and long-distance trans-synaptic propagation (4R). We prepared and tested twenty-four newly synthesized small molecules representing the urea (1, 2, 3), sulfonylurea (4), and sulfonamide (5–24) series and evaluated their anti-aggregation effects with biophysical methods (thioflavin T and S fluorescence assays, transmission electron microscopy) and intracellular inclusion cell-based assays. Pre-evaluation was performed on alpha-synuclein (α-syn) to identify molecules to be challenged with p-tau. The sulfonamide derivatives 18 and 20 exhibited an anti-fribrillization activity on α-syn and p-tau. Sulfonamide compounds 18 and 20 reduced inclusion formation in M17D neuroblastoma cells that express inclusion-prone αSynuclein3K::YFP. This project advances new concepts in targeting prone-to-aggregate proteins such as α-syn and p-tau, and provides a molecular scaffold for further optimization and pre-clinical studies focused on AD drug development.
Keywords: Alzheimer’s disease, Alpha-synuclein, Fibrils, Hyperphosphorylated tau, Isoform 1N4R, Neuroblastoma cells, Sulfonamides
1. Introduction
The vast majority of Alzheimer’s disease (AD) drug development efforts have been hindered with significant failures due to a significant gap in the understanding of the pathophysiological processes and insufficient effort in identifying, optimizing, and validating small molecule inhibitors of aggregation. AD is manifested by two pathological hallmarks: extracellular amyloid-beta (Aβ) senile plaques and intraneuronal neurofibrillary tangles (NFTs). AD involves first the aggregation of secreted Aβ peptides which form Aβ plaques in the brain parenchyma and, subsequently, activates different types of microglial cells leading to a pro-inflammatory state [1]. Activated microglia have been shown to increase tau phosphorylation and drive the trans-synaptic spread of aggregated hyperphosphorylated tau (p-tau) [1]. Most importantly, the NFTs resulting from p-tau spread progressively and are correlated with increasing cognitive impairment [2]. Braak staging shows that NFTs first appear in the trans entorhinal region (Stage I), then spread through the entorhinal cortex (Stage II), hippocampus (Stage III), superior temporal neocortex (Stage IV), and then the entire neocortex (Stages V and VI) [3]. This progression of NFT accrual coincides with the development of cognitive dysfunction in AD — from short-term and working memory loss to much more severe cognitive symptoms and behavioral deficits [2].
AD drug discovery has been dominated by anti-Aβ measures, mainly Aβ-clearing monoclonal antibodies and β-site amyloid precursor protein cleaving enzyme (BACE) inhibitors [4]. With exception of one recent and highly controversial immunotherapy, all Phase III clinical trials of anti-Aβ drugs have failed to improve cognitive functions of patients at various AD stages, casting serious doubt on the Aβ-centric amyloid hypothesis for AD neurodegeneration [5]. A smaller number of efforts pursued tau-centric AD drugs. While many compounds inhibiting aggregation of non-phosphorylated tau are reported [6–9], many (e.g., dihydroxybenzene, aminothioenopyridazine, and methylene blue) control non-specifically the redox state of tau involving Cys291 and Cys322 [6,9] So far, only one tau aggregation inhibitor, TRx0237, which also targeted non-phosphorylated tau, has been tested in a Phase III trial, where it failed [10]. By contrast, it is well established that: 1) NFTs involve p-tau, which is obligatory for a tauopathy effect [11–14]; 2) p-tau may be more prone to aggregate than non-phosphorylated tau [15–19]; and 3) p-tau aggregates have distinct biophysical properties from those of the non-phosphorylated tau aggregates [20,21]. Nonetheless, no drug screening has used clinically relevant p-tau because robust methods for making sufficient quantities of p-tau for drug screening have been lacking.
Kuo and coworkers developed the protein interaction module-assisted function x (PIMAX) technology in order to produce recombinant p-tau hyperphosphorylated by GSK3β, a prime suspect kinase for tau abnormal phosphorylation in AD [15–18]. Mass spectrometry identified 16 phosphorylation sites on p-tau produced by PIMAX. Eight of these 16 sites are markers for Braak staging that correlate specific tau phosphorylation epitopes to AD progression [3]. A key feature, relevant to AD, is that p-tau produced by PIMAX is toxic to human neuroblastoma SH-SY5Y cells [17]. For instance, when SH-SY5Y cells were treated with as little as 0.5 μM of p-tau 1N4R, 50% of cells died with clear signs of apoptosis and mitochondrial superoxide accumulation [17]. Additionally, PIMAX p-tau forms fibrils independently of a common aggregation inducer, heparin [22], of which the pathophysiological significance remains to be delineated. Taken together, these data attest to the relevance of p-tau produced by PIMAX as a target for AD drug discovery [15–18] in strong contrast to non-phosphorylated tau used in several drug screening studies, which exerts minimal or no cytotoxic effect in vitro and lacks AD-relevant hyperphosphorylation [23,24]. Our drug discovery program focuses on the p-tau isoform 1N4R due to the abundance of 1 N in AD patient brain tissue [25–29] and evidence that the 4R tau isoform leads to long-distance spreading of the tau pathologic effect [25].
In the quest for developing small molecule compounds with anti-amyloidogenic activity as therapeutics for human amyloid diseases such as type 2 diabetes, Parkinson’s Disease, and AD, we have identified several compounds with potent activity in preventing the fibril formation of α-synuclein [30] and islet amyloid polypeptide [31]. These small molecules were substantially modified from a previous family of compounds named “EthylUrea” and “ChloroEthylUrea” that are cell permeable and nontoxic to human cell lines and chick embryos [32, 33]. This study focused on identifying aggregation inhibitors of alpha-synuclein (α-syn) and the p-tau isoform 1N4R that possesses disease-relevant molecular features, including hyperphosphorylation, heparin-free aggregation, and cytotoxicity. A pre-evaluation of α-syn anti-aggregation activity was executed with twenty-four newly synthesized small molecules representing the urea (1, 2, 3), sulfonylurea (4), and sulfonamide (5–24) series. Potent molecules were identified and pursued for the evaluation of their anti-aggregation effects of p-tau 1N4R, in addition to α-syn, with biophysical methods (thioflavin fluorescence assays, transmission electron microscopy). The effect of several sulfonamide representatives on the α-syn inclusion body formation was monitored in the dox-inducible neuroblastoma cells M17D-TR/ αS-3K::YFP.
2. Results and discussion
2.1. Chemistry
This study mainly focuses on the effect of the central core (linker) of our previous family of anti-aggregation small molecules to abrogate the fibril formation of α-syn and p-tau isoform 1N4R. We designed and synthesized a novel subset of compounds containing urea, sulfonylurea, and sulfonamide linker. The general synthetic route for the preparation of the urea, sulfonylurea, and sulfonamide used in this study is illustrated in Schemes 1 and 2. For the preparation of the urea derivatives, 1–4, commercially available 2-aminofluorene and substituted isocyanates were combined in anhydrous dichloromethane (DCM) at room temperature to furnish the desired products in good to high yields (Scheme 1). For the preparation of sulfonamide derivatives 5–24, commercially available anilines were treated with substituted benzene sulfonyl chlorides in the presence of triethylamine in anhydrous DCM (Scheme 2A–C and E) at room temperature or refluxed in pyridine to give the desired products (Scheme 2D). Confirmation of the molecular structure of each compound was achieved by nuclear magnetic resonance (1H NMR and 13C NMR), infrared (IR), and mass spectrometry (ESI-MS and HRMS). Previous studies have shown positive anti-fibrillary effects of electron-withdrawing groups on the phenyl ring of the R1-NCO [30, 31]. We opted for the sulfonylurea and sulfonamide representatives in an attempt to improve the solubility and explore different substitutions when compared to the urea moiety. The anti-fibrillization activity of these compounds was first examined on α-syn to select a subset of small molecules. The most potent molecules were evaluated to inhibit the p-tau isoform 1N4R fibril formation. Two leads resulted from this study and can be pursued for further optimization.
Scheme 1.

Reagents and conditions. 2-Aminofluorene (1 equiv), substituted isocyanate (1.1 equiv), anhydrous dichloromethane, room temperature, 18 h.
Scheme 2.


Reagents and conditions: (a) Amine or aniline (1 equiv), substituted aromatic sulfonyl chlorides (1 equiv), triethylamine (1 equiv), anhydrous dichloromethane, room temperature, 8–10 h. (b) Commercially available aniline derivatives (1 equiv), substituted benzene sulfonyl chloride (1.5 equiv), anhydrous pyridine, reflux, 8 h.
2.2. Structure-activity relationships (SAR)
The chemical structure and physicochemical parameters representing the urea (compounds 1, 2, 3), sulfonylurea (compound 4), and sulfonamide (5–24) series are described in Table 1. The identification of compounds that target pre-tangle p-tau inside the brain involves the consideration, for each molecule designed, of favorable physicochemical properties. To cross the blood-brain barrier (BBB), ideal molecules (based on the CNS MPO candidates set physicochemical median values) should have among other parameters, a MW ≤ 397.9, a calculated partition coefficient (clogP) ranging from 1.7 and 3 (below ~2.8), and a topological polar surface area (TPSA) below 80–90 Å [34]. Among all the synthesized compounds, compound 6, 10, 15, 16, 17, 19, 20, 22 and 24 have a clogP below 2.8. However, only the urea derivatives 1–3 and sulfonamides 5, 6, 8, 13, and 14 display a TPSA value of below 80–90 Å. The effect of the newly synthesized compounds was first evaluated on α-syn aggregation using the Thioflavin T (ThT) assay. The fluorescence intensities (FI) were measured in percentage and have been reported in Table 1. The fluorescence emission increases when ThT binds to fibrils. Based on the results obtained, compounds 18 and 20 were found to be the most potent with FI of 5.9 ± 4.1% and 11.9 ± 2.2%, respectively. In the case of 2-aminofluorene-based urea derivatives 1 to 3 exhibited poor anti-aggregation activity. Most of the compounds produced an intermediate to strong effect, but the notable compounds containing morpholino and benzothiazolyl groups on the phenyl, and benzothiazole linked directly to the sulfonamide linker (compounds 9, 18, and 20) were the most promising, with CNS MPO scores ranging from 3.5 to 4.5 (on a scale of 6, the highest score is more desirable).
Table 1.
Chemical structure, physicochemical descriptors, and the effect of compounds on α-syn aggregation measured as fluorescence intensity using thioflavin T (ThT) assay. TPSA, Log P, and Log D were obtained with SwissADME. BBB and pKa were obtained from the Blood-Brain Barrier Prediction Server (https://www.cbligand.org/BBB/) and Chemaxon, respectively. CNS MPO values were assessed as published previously [34]. The ThT (%) represent the maximum fluorescence intensity obtained at the plateau phase of the kinetics of fibrillization using 6 μM of α-syn. Compounds were tested at 100 μM (molar ratio 1:16). BBB, blood-brain barrier; ClogD, calculated distribution coefficient at 7.4; ClogP, calculated partition coefficient; CNS MPO, Central Nervous System Multiparameter Optimization; HBA, Hydrogen Bond Acceptor; HBD, Hydrogen Bond Donor; LR5, Lipinski’s rule of five; pKa, negative log of acid dissociation constant; ThT, Thioflavin T; TPSA, Topological polar surface area.
| ID# | Structure | TPSA | Clog P | ClogD | HBA | HBD | pKa | CNS MPO | BBB | LR5 | α-syn ThT(%) |
|---|---|---|---|---|---|---|---|---|---|---|---|
|
| |||||||||||
| CONTROL | 95.7 ± 11.4 | ||||||||||
| 1 |

|
41.13 | 3.10 | 2.01 | 2 | 1 | 13.53 | 4.8 | Y | Y | 78.5 ± 8.9 |
| 2 |

|
41.13 | 3.97 | 3.68 | 2 | 1 | 11.51 | 3.5 | Y | Y | 72.7 ± 8.7 |
| 3 |

|
41.13 | 3.97 | 4.28 | 1 | 2 | 11.5 | 3.0 | N | Y | 72.1 ± 5.9 |
| 4 |

|
83.65 | 3.53 | 4.35 | 3 | 2 | 2.6 | 4.0 | N | Y | 22.4 ± 12.7 |
| 5 |

|
54.55 | 4.20 | 3.98 | 2 | 1 | 7.84 | 4.2 | Y | Y | 111.5 ± 1.8 |
| 6 |

|
67.02 | 2.62 | 2.95 | 3 | 1 | 8.35 | 5.2 | Y | Y | 49.5 ± 5.7 |
| 7 |

|
83.09 | 3.22 | 3.53 | 2 | 1 | 8.35 | 4.7 | N | Y | 90.0 ± 8.5 |
| 8 |

|
57.79 | 3.49 | 3.96 | 2 | 1 | 8.36 | 4.4 | Y | Y | 74.7 ± 8.1 |
| 9 |

|
95.68 | 4.53 | 5.74 | 3 | 1 | 7.69 | 3.5 | N | Y | 39.8 ± 1.4 |
| 10 |

|
97.07 | 2.52 | 1.91 | 4 | 1 | 7.52 | 5.6 | N | Y | 85.2 ± 8.0 |
| 11 |

|
104.91 | 3.31 | 3.73 | 4 | 1 | 6.77 | 4.3 | N | Y | 72.1 ± 9.9 |
| 12 |

|
83.65 | 3.75 | 3.33 | 3 | 1 | 6.72 | 4.8 | N | Y | 103.0 ± 6.4 |
| 13 |

|
70.34 | 2.89 | 3.16 | 2 | 2 | 7.78 | 4.9 | Y | Y | 106.8 ± 2.8 |
| 14 |

|
70.34 | 2.85 | 3.16 | 3 | 1 | 7.52 | 5.3 | Y | Y | 80.0 ± 10.5 |
| 15 |

|
100.37 | 2.74 | 3.32 | 4 | 1 | 7.5 | 4.8 | N | Y | 110.3 ± 12.9 |
| 16 |

|
112.84 | 1.71 | 2.29 | 5 | 1 | 7.96 | 4.9 | N | Y | 78.2 ± 8.8 |
| 17 |

|
128.91 | 2.30 | 2.86 | 4 | 1 | 7.97 | 4.3 | N | Y | 52.5 ± 4.0 |
| 18 |
|
138.03 | 2.84 | 3.73 | 5 | 1 | 7.36 | 3.6 | N | Y | 5.9 ± 4.1 |
| 19 |

|
138.03 | 1.62 | 2.66 | 5 | 1 | 6.63 | 4.5 | N | Y | 54.42 ± 0.8 |
| 20 |

|
138.03 | 1.62 | 2.66 | 6 | 1 | 6.67 | 4.5 | N | Y | 11.9 ± 2.2 |
| 21 |

|
112.75 | 4.08 | 4.18 | 4 | 1 | 7.49 | 3.2 | N | Y | 83.1 ± 6.9 |
| 22 |

|
84.09 | 2.02 | 1.91 | 4 | 1 | 8.11 | 5.8 | N | Y | 84.3 ± 5.9 |
| 23 |

|
82.79 | 3.55 | 3.69 | 2 | 1 | 6.26 | 4.7 | N | Y | 51.2 ± 2.9 |
| 24 |

|
85.48 | 1.92 | 1.86 | 5 | 1 | 8.42 | 5.5 | N | Y | 84.3 ± 16.6 |
The urea derivative 1 flanked by 2-fluorene (N) and ethyl group (N’) displayed a FI of 78.5 ± 8.9%. Replacement of the aliphatic (i.e. ethyl) group by an aromatic (i.e. phenyl) group (2) did not result in a significant reduction in the FI (72.7 ± 8.7%). Introduction of an electron-withdrawing group chlorine at para-position of the phenyl (3) also showed no effect on the FI (72.1 ± 5.9%). Based on these results, other linkers such as sulfonylurea and sulfonamide were explored to determine the effect on FI values. The introduction of sulfonylurea (compound 4) led to a marked reduction in the FI (22.4 ± 12.7%) when compared to compound 3 containing the same substituents. We then explored the effect on sulfonamide linkers by synthesizing compounds containing different aromatic amino substituents linked with commercially available aromatic sulfonyl moieties (compounds 5–24). Replacement of sulfonylurea with a sulfonamide in compound 5 led to the loss of the anti-fibrillary activity, with a FI of 111.5 ± 1.8%. With an aim to improve the FI of sulfonamide derivatives, the 2-fluorene was replaced with a 4-morpholino phenyl group to increase the polarity due to the presence of heteroatoms. Introduction of 4-morpholino phenyl group reduced the FI of about 50% (compound 6; 49.5 ± 5.7%), but replacement of oxygen atom with a less electronegative sulfur atom i.e., thiomorpholine, resulted in a loss of activity as observed in compound 7, with a FI of 90.0 ± 8.5%. A similar trend was observed in compound 8 when an aliphatic N-piperidinyl moiety was introduced on the para-position of the phenyl group, providing an FI of 74.7 ± 8.1%. Further substituents were explored on the para-position of the phenyl group. Introduction of aromatic 6-methyl benzothiazole on the para-position on the phenyl ring (9) led to a significant reduction in the FI, which constated to 39.8 ± 1.4%. However, replacement of aromatic groups on the para-position of the phenyl ring with a sulfonyl methyl group (compound 10) did not yield any drastic reduction in FI, measuring to be 85.2 ± 8.0%. Based on the results obtained from the introduction of the benzothiazolyl moiety on the para-position of the phenyl ring in compound 9, further exploration was done to assess the effect of funtional groups on FI. Such was accomplished by removing the phenyl group and attaching the benzothiazolyl moiety directly to the sulfonamide linker, as seen in compounds 11 and 12. The FI measured for compound 11 and 12 was 72.1 ± 9.9 and 103.0 ± 6.4% respectively, indicating no significant change in FI. A similar trend was observed in other aromatic heterocyclic moieties such as 5-indolyl (13) and 5-quinolinyl (14), with FI of 106.8 ± 2.8 and 80.0 ± 10.5% respectively. We then explored the effect of changing the electron withdrawing group from para-chloro to para-nitro on the phenyl ring (compounds 15 – 20). Interestingly, compound 18, bearing a 4-(2-benzothiazolyl)phenyl group, and compound 20, containing 4-methoxy benzothiazolyl group connected to the sulfonamide, both displayed a significant reduction in FI measured at 5.9 ± 4.1 and 11.9 ± 2.2%, respectively. However, compounds 15 (FI of 110.3 ± 12.9%), 16 (FI of 78.2 ± 8.8%), 17 (FI of 52.5 ± 4.0%) and 19 (FI of 54.42 ± 0.8%), correspondingly containing 2-flourene, 4-morpholinophenyl, 4-thiomorpholinophenyl and 2-benzothiazolyl groups connected to a sulfonamide linker, failed to reduce the FI to satisfactory levels. Further analyses were performed by designing compounds inspired from the results obtained from compounds 18 and 20. The nitro group was replaced by an acetyl moiety in compounds 21 (FI of 83.1 ± 6.9%) and 22 (FI of 84.3 ± 5.9%) containing 4-(2-benzothiazolyl)phenyl and 4-morpholino phenyl substituents, respectively. Howerver, these modifications did not result in any significant FI reduction. In addition, compounds 23 and 24 containing heterocyclic moieties, namely, 2-thiophene and 2,3-dihydrobenzo[b][1,4]dioxine, were prepared with 2-fluorene and 4-morpholino phenyl substituents, respectively. However, compounds 23 and 24 did not have any major effect on the FI, with values measuring 51.2 ± 2.9 and 84.3 ± 16.6%, correspondingly.
2.3. Biophysical evaluation
2.3.1. Monitoring the kinetics of α-synuclein (α-syn) aggregation with different compounds by thioflavin-T (ThT) fluorescence assay
ThT fluorescence assay is routinely employed to study the kinetics of fibril formation of prone-to-aggregate proteins and evaluate the anti-fibrillar properties of newly synthesized compounds. The method involves firstly addition of the compound followed by ThT and finally the introduction of α-syn mixed in the buffer. The kinetics of fibril formation begins when the protein is solubilized in the buffer and introduced into the plate. In the aggregation assay, the plateau phase of the sigmoidal kinetic curves represents the formation of mature fibrils in which aggregation and disaggregation co-exists to reach an equilibrium. The anti-fibrilization property of compounds is initially examined followed by the aggregation kinetics, specifically at the plateau phase where fluorescence intensity is compared between multiple incubations with compounds. Based on fluorescence intensities obtained, the most potent anti-fibrillary compounds were compound 18 and 20. While compounds 4, 6, 9, 17, 19 and 23 exhibited intermediate anti-fibrillary activity. The kinetic curves of the compounds from the ThT fluorescence assay are shown in Fig. 1. These results show that these newly prepared small molecule inhibitors have the ability to abrogate α-syn fibril formation.
Fig. 1.

Kinetics of α-synuclein (α-syn) fibril formation obtained with different compounds monitored using the thioflavin T (ThT) fluorescence assays. The compounds were tested at a final concentration of 100 μM in presence of α-syn at 6 μM. Molar ratio of peptide: compound was ~1:16.
2.3.2. Monitoring the kinetics of p-tau isoform 1N4R fibril formation with different compounds by thioflavin-S (ThS) fluorescence assay
The formation of p-tau fibrils was monitored by measuring the fluorescence intensity of the dye thioflavin-S (ThS) [35]. Best compounds identified from α-syn ThT assays with several negative controls were challenged with the p-tau ThS assays. In all ThS experiments carried out, fibril formation was studied using 10 mM sodium phosphate buffer at pH 7.5 for 24 h. The goal of our study was to investigate the inhibitory potential of best sulfonamide representatives on p-tau aggregation and to examine which derivatives exhibit a robust anti-inclusion effect with dox-inducible neuroblastoma cells M17D-TR/ αS-3K::YFP. Various structural analogs were first tested at a final concentration of 50 μM. The kinetic of aggregation curves resulting from the ThS experiment are shown in Fig. 2 and expressed as the fluorescence intensity obtained with the urea (compounds 1 to 3 as negative controls) and sulfonamide (compounds 5 (negative control), 15 (negative control), 9, 11 (negative control), 20, 18) representatives. Compounds 18 and 20, sulfonamide representatives, were capable of inhibiting fibril formation by ~13% and ~17%, respectively. However, compounds 9 and 11 increased fibril formation by 80% and 114%, respectively.
Fig. 2.

Kinetics of p-tau isoform 1N4R fibril formation obtained with different compounds monitored using the thioflavin S (ThS) fluorescence assays. The compounds were tested at a final concentration of 50 μM in presence of α-synuclein at 6 μM. Molar ratio of peptide: compound was ~1:8.
2.3.3. TEM analysis of compound 18 and 20 anti-fibrillar activity on α-syn and p-tau isoform 1N4R
We further performed transmission electron microscopy (TEM) with compounds 9, 11, 18 and 20 to visualize directly the change in morphology of α-syn and p-tau isoform 1N4R fibrils after 24 h. Fig. 3 shows that, indeed, compound 18 and 20 exhibited clear effects on reducing α-syn fibrillization at molar ratio 1:10. Dense mats of fibrils were observed with the DMSO control. Levels of p-tau fibril were reduced with compound 18 and 20 at 50 μM (molar ratio 1:5). Hence, we identified compounds 18 and 20, sulfonamide representatives, as the best compounds to reduce p-tau isoform α-syn and 1N4R fibril formation, whereas compounds 9 and 11 seemed to promote fibril formation.
Fig. 3.

Compound 18 and 20 reduces α-synuclein (α-syn) and p-tau fibril formation as validated by transmission electron microscopy (TEM). α-Syn (60 μM) was incubated with DMSO (<0.1%) or compounds 9, 11, 18 and 20 (600 μM) for 24 hours prior TEM visualization (molar ratio 1:10). P-tau (10 μM) was incubated with DMSO (<0.1%) or compounds 9, 11, 18 and 20 (50 μM) for 24 hours prior TEM visualization (molar ratio 1:5). High (40 K) magnifications show less fibrils with compound 18 and 20 in comparison with DMSO (<0.1%). Scale bare: 200 nm (40 K).
2.4. Biological evaluation of the sulfonamide representatives, compounds 18 and 20, against α-syn inclusion in neuroblastoma cells
To evaluate the effects of compounds on inclusion formation and cell survival, we first opted for M17D neuroblastoma cells that express an α-syn-derived αS-3K::YFP fusion protein in a doxycycline-inducible fashion. It is well known that the familial-PD- linked α-syn missense mutation E46K is amplified by α-syn E35K + E46K + E61K (= αS3K), which results in round cytoplasmic α-syn-based inclusions in cultured cells. αS 3 K expression is responsible for cell stress/toxicity and delayed growth of neuroblastoma cells. In the αS 3 K system, several compounds were identified to overcome both αS inclusion formation[36] and αS-induced cytotoxicity [37], and therefore we selected this assay to evaluate the effect of the weak to non-inhibitors of aggregation (Fig. 4), and one of the two best anti-aggregation inhibitors (Fig. 5). Compounds 7, 8, 5, 21 and 15 all reduced inclusion formation in M17D αS3K neuroblastoma cells at a concentration of 40 μM. However, none of these compounds exhibited a significant reduction of inclusions at lower concentration. Only one compound, 13, exhibited a small degree of toxicity at 40 μM. One of the two best anti-fibrillary candidates was challenged with the inclusion model. Compounds 18 and 20 reduced the inclusions at lower concentration (7.5, 15, and 30 μM) and in a dose-dependent manner, i.e. (Figs. 5 and 6). Western blot analyses for total α-syn, normalized to calnexin (loading control), were performed to determine the compound effect on α-syn protein level due to degradation or non-specific effect on transgene expression. Compounds 7, 8, and 18 reduced α-syn levels, an effect that will require further analysis. This could indicate enhanced αS degradation; an alternative explanation would be a non-specific effect on transgene expression.
Fig. 4.

Compounds 7, 8, 5, 21 and 15 reduce inclusion formation in M17D neuroblastoma cells that express inclusion-prone αSynuclein3K::YFP. (A) M17D cells that express an αS3K::YFP fusion protein (dox-inducible) were treated with 0.1% DMSO (vehicle), 40 μM 7, 40 μM 8, 40 μM 5, 40 μM 21, 40 μM 15 at t = 24 hrs. Cells were induced with dox at t = 48 hours. Punctate YFP signals were measured and normalized to 0.1% DMSO at t = 96 hours. Eight independent experiments (N = 8; n = 14; except DMSO, n = 30) were performed. Data are presented as fold-change relative to 0.1% DMSO. Ordinary one-way ANOVA plus Dunnett’s multiple comparison test (***, p < 0.001, ****, p < 0.0001). (B) Same as panel A, but confluence was plotted. None of the compounds appears to be toxic at 40 μM. (C) Same experiments as panel A, but Western blot analysis for total αS, normalized to calnexin (loading control). Compounds 7 and 8 reduce αS levels. (D) Representative images (YFP and Bright-Field) for the indicated compounds and concentrations; scale bar = 50 μm.
Fig. 5.

Compound 18 reduces inclusion formation in M17D neuroblastoma cells that express inclusion-prone αSynuclein3K::YFP. (A) M17D cells that express an αS3K::YFP fusion protein (dox-inducible) were treated with 0.1% DMSO (vehicle), or compound 18 at 3.75, 7.5, 15, and 30 μM at t = 24 hrs after plating. Then cells were induced with doxycycline at t = 48 hrs. Incucyte-based analysis of punctate YFP signals, normalized to 0.1% DMSO at t = 96 hrs. 6 independent experiments (N = 6) were performed. The data are presented as average ± standard deviation. One-Way ANOVA plus Dunnett’s multiple comparisons test (*, p < 0.1, ***, p < 0.001, ****, p < 0.0001). (B) Same as panel A, but the cell confluence percentage was plotted. Compound 18 does not appear to be toxic at the concentrations tested. (C) Western blot for αS and calnexin (loading control). Total αS/calnexin ratios were plotted, normalized to 0.1% DMSO (N = 2; n = 6, except DMSO, n = 2). Compound 18 affects total αS levels only at 30 μM. D) Representative images (YFP and Bright-Field) for the indicated treatments; scale bar = 50 μm.
Fig. 6.

Compound 20 reduces inclusion formation in M17D neuroblastoma cells that express inclusion-prone αSynuclein3K::YFP. (A) M17D cells that express an αS3K::YFP fusion protein (dox-inducible) were treated with 0.1% DMSO (vehicle) or 3.75, 7.5, 15, and 30 μM of compound 20 at t = 24 hrs after plating. Then cells were induced with doxycycline at t = 48 hrs. Incucyte-based analysis of punctate YFP signals, normalized to 0.1% DMSO at t = 96 hrs. 6 independent experiments (N = 6) were performed. The data are presented as average ± standard deviation. One-Way ANOVA plus Dunnett’s multiple comparisons test (*, p < 0.1, **, p < 0.01). (B) Same as panel A, but the cell confluence percentage was plotted. Compound 20 does not appear to be toxic at the concentrations tested. (C) Western blot for αS and calnexin (loading control). Total αS/calnexin ratios were plotted, normalized to 0.1% DMSO (N = 2; n = 6, except DMSO, n = 2). (D) Representative images (YFP and Bright-Field) for the indicated treatments; scale bar = 50 μm.
2.5. Molecular docking study
The x-ray structure of tau 1N4R was used to perform a first study with molecular docking without addressing the flexibility of the protein (please see Materials and Methods section and supplemental data Tables S1–S5). As predicted, our best performing compounds 18 and 20 display higher binding scores (−9.54 and −8.09 respectively in supplemental data Table S1) and number of hydrogen bonds than negative controls (11 and 9, Tables S2 and S3), which was also further confirmed by experimental results. Compounds 18 and 20 interact with the binding pocket surrounded by Lys164 and Tyr200 in chain A (in blue) and, Gly212 and Arg263 in chain B (in red) and each formed four hydrogen bonds (Fig. 7). Overall, the binding score and the formation of hydrogen bonds with the active sites stabilizes the ligand in the binding pocket in the dynamic biological environment. This molecular docking model would be tested through further analog preparation. We would plan on changing the nitro group to obtain similar interactions. Our SAR demonstrated that among the compounds bearing a nitro group, the benzothiazole moiety increased the anti-fibrillary activity. It would be interesting to study the lipophilic interactions, which are relevant for the anti-fibrillary activity.
Fig. 7.

Binding poses (top) of ligands (a) 18 and (b) 20 with Tau (PDB ID: 1QAB) plasmid and their 2D representation (bottom) of interaction with amino acids (c and d, respectively).
3. Conclusion
In conclusion, a novel series of twenty-four urea, sulfonylurea, or sulfonamide compounds were designed and synthesized and their effects on α-syn and p-tau isoform 1N4R fibril formation were explored. It was beneficial to perform the anti-aggregation studies on α-syn first as a pretest to identify potential candidates to further evaluate with the p-tau anti-fibrillization experiments. The results obtained from the Thioflavin assays allowed us to identify compounds 18 and 20 as the best molecules for further experiments. The effect of these compounds on p-tau fibril formation was confirmed using TEM analysis. Moreover, compounds 18 and 20 reduced α-syn inclusion body formation in the dox-inducible neuroblastoma cells M17D-TR/ αS-3K::YFP. The sulfonamide scaffold is of utmost interest developing new anti-NFT therapies given their non-cytotoxic impact to various cell lines and their drug-like properties, including a high propensity to cross the blood-brain barrier. Herein, we have reported the dual inhibition of α-syn and p-tau fibril formation using novel sulfonamide compounds. These sulfonamides could represent a new class of effective inhibitors of prone-to-aggregate proteins relevant for the development of new therapies for neurodegenerative diseases.
4. Materials and methods
4.1. Chemical preparation and evaluation
Proton NMR spectra were recorded on a 500 MHz NMR (Bruker). Chemical shifts (d) are reported in parts per million. Mass spectra were performed on each compound at the Analytical Mass Spectrometry Facility within the Purdue Institute for Drug Discovery. The IR spectra was recorded with JASCO FT/IR 6600 spectrometer using neat samples at Michigan State University. Chemicals and reagents were supplied by Aldrich Chemicals (Milwaukee, WI) and Alfa Aesar (Ward Hill, MA, USA). Solvents and reagents were used without purification unless specified otherwise. The progress of all reactions was monitored using TLC on precoated silica gel plates (Merck Silica Gel 60 F254). The chromatograms were viewed under UV light at 254 nm. The physical chemical properties of newly synthesized molecules were obtained from SwissADME (TPSA, Log P, Log D), Blood-Brain Barrier Prediction Server (https://www.cbligand.org/BBB/), and Chemaxon (pKa) (Table 1).
4.2. Synthesis of ureas
4.2.1. Preparation of compound 1 (3-ethyl-1-(9H-fluoren-2-yl)urea)
Ethylisocyanate (1.8 mmol) was added dropwise to a stirred solution of 2-aminofluorene (1.5 mmol; 0.2733 g) in dichloromethane (15–20 mL). The residue was filtered and purified by recrystallization from ethanol and water. 0.2464 g; Yield: 65%; 1H NMR (500 MHz, DMSO-d6) δ 8.51 (s, 1H), 7.80 – 7.57 (m, 3H), 7.49 (d, J = 7.4 Hz, 1H), 7.37 – 7.26 (m, 2H), 7.24 – 7.13 (m, 1H), 6.12 (t, J = 5.6 Hz, 1H), 3.83 (s, 2H), 3.12 (dd, J = 7.3, 5.6 Hz, 2H), 1.05 (t, J = 7.2 Hz, 3H). 13C NMR (125 MHz, DMSO-d6) δ 155.6, 144.3, 142.9, 141.8, 140.3, 134.7, 127.1, 126.0, 125.4, 120.5, 119.5, 116.9, 114.8, 36.9, 34.5, 16.0. TOF MS ES+ (C20H16N2O): Calc. 253.126; found: 253.134. FTIR (neat), cm−1: 3323, 1633, 1554.
4.2.2. Preparation of compound 2 (3-(9H-fluoren-2-yl)-1-phenylurea)
Phenyl isocyanate (71 mg, 0.6 mmol) was added dropwise to a stirred solution of 2-aminofluorene (90 mg, 0.5 mmol) in dichloromethane (15–20 mL). The residue was filtered and purified by recrystallization has above-mentioned (150 mg, 0.5 mmol, Yield: 83%); 1H NMR (500 MHz, DMSO-d6) δ 8.76 (s, 1H), 8.69 (s, 1H), 7.82 – 7.67 (m, 3H), 7.52 (d, J = 7.4 Hz, 1H), 7.49 – 7.44 (m, 2H), 7.38 (dd, J = 8.2, 2.0 Hz, 1H), 7.32 (td, J = 7.5, 1.0 Hz, 1H), 7.27 (m, 2H), 7.25 – 7.22 (td, J = 7.5, 1.0 Hz, 1H), 6.98–6.91 (m, 1H), 3.88 (s, 2H). 13C NMR (125 MHz, DMSO-d6) δ: 153.00, 144.4, 143.0, 141.6, 140.2, 139.3, 135.6, 129.3, 127.1, 126.2, 125.4, 122.3, 120.7, 119.7, 118.6, 117.5, 115.4, 37.0. TOF MS ES+ (C20H16N2O): Calc 301.126; found: 301.133. FTIR (neat), cm−1: 3294, 1633, 1548.
4.2.3. Preparation of compound 3 (1-(4-chlorophenyl)-3-(9H-fluoren-2-yl)urea)
4-Chlorophenyl isocyanate (92 mg, 0.6 mmol) was added dropwise to a stirred solution of 2-aminofluorene (90 mg, 0.5 mmol) in dichloromethane (15–20 mL). The residue was filtered and purified by recrystallization as above-mentioned (161 mg, 0.48 mmol; Yield: 90%); 1H NMR (500 MHz, DMSO-d6) δ: 8.85 (s, 1H), 8.81 (s, 1H), 7.85 – 7.75 (m, 3H), 7.56 – 7.47 (m, 3H), 7.40 (dd, J = 8.3, 2.0 Hz, 1H), 7.36 – 7.31 (m, 3H), 7.24 (td, J = 7.4, 1.2 Hz, 1H), 3.89 (s, 2H). 13C NMR (125 MHz, DMSO-d6) δ 152.9, 144.4, 143.0, 141.6, 139.2, 139.1, 135.7, 129.1, 127.2, 126.3, 125.8, 125.4, 120.7, 120.1, 119.7, 117.6, 115.6, 37.0 TOF MS ES+ (C20H15ClN2O): Calc. 335.087; found: 335.094. FTIR (neat), cm−1: 3303, 1637, 1541.
4.3. Synthesis of sulfonylurea
4.3.1. Preparation of compound 4 (1-(4-chlorobenzenesulfonyl)-3-(9H-fluoren-2-yl)urea)
4-Chlorobenzenesulfonyl isocyanate (131 mg, 0.6 mmol) was added dropwise to a stirred solution of 2-aminofluorene (90 mg, 0.5 mmol) in dichloromethane (15–20 mL). The reaction mixture was stirred under a dried nitrogen atmosphere overnight at ambient temperature. The resulting precipitate was filtered, washed with cold ether, and purified by recrystallization from ethanol and water (211 mg, 0.53 mmol; Yield: 88%); 1H NMR (500 MHz, DMSO-d6) δ: 10.72 (s, 1H), 9.04 (s, 1H), 8.02 – 7.95 (m, 2H), 7.76 (m, 2H), 7.73 – 7.69 (m, 2H), 7.65 (d, J = 2.0 Hz, 1H), 7.49 (dd, J = 7.5 Hz, 2 Hz, 1H), 7.34 – 7.26 (m, 2H), 7.22 (td, J = 7.4, 1.2 Hz, 1H), 3.83 (s, 2H). 13C NMR (125 MHz, DMSO-d6) δ: 149.8, 144.4, 143.2, 141.3, 139.3, 138.7, 137.4, 136.9, 130.0, 129.7, 129.5, 128.1, 127.2, 126.6, 125.5, 120.7, 119.9, 118.3, 116.3, 36.9. TOF MS ES− (C20H15ClN2O3S): Calc. [M-H]−: 397.049; found: 397.041. FTIR (neat), cm−1: 3285, 3207, 1678, 1355, 1168.
4.4. Synthesis of sulfonamides
4.4.1. General procedure 1: synthesis of compounds 5 to 8, 10 to 20, 22 to 24
To a stirred solution of appropriate aniline (1 equiv) dissolved in anhydrous dichloromethane (5 mL), substituted benzene sulfonyl chloride (1 equiv) was added dropwise. The reaction was allowed to stir for 8–12 h at room temperature. The reaction mixture was extracted with an aqueous solution of 1 N hydrochloric acid (7 mL) followed by brine (7 mL). Organic layers were collected, filtered over Na2SO4, and dried in-vacuo to obtain the pure desired product.
4.4.2. General procedure 2: synthesis of compounds 9 and 21
To a solution of the appropriate aniline (1 equiv) in pyridine (3 mL) was added substituted benzene sulfonyl chloride (1.5 equiv). The reaction mixture was heated under reflux for 8 h, cooled and water (6 mL) was added. The precipitate formed was collected by filtration, washed with water, and dried in-vacuo to obtain the pure desired product.
4.4.3. Compound 5 (4-chloro-N-(9H-fluoren-2-yl)benzene-1-sulfonamide)
Beige solid, 115 mg; Yield: 59%; 1H NMR (500 MHz, DMSO-d6) δ 10.38 (s, 1H), 7.79 – 7.69 (m, 4H), 7.59 (d, J = 8.7 Hz, 2H), 7.49 (d, J = 7.4 Hz, 1H), 7.35 – 7.28 (m, 2H), 7.24 (td, J = 7.4, 1.2 Hz, 1H), 7.08 (dd, J = 8.2, 2.0 Hz, 1H), 3.82 (s, 2H). 13C NMR (126 MHz, DMSO-d6) δ 144.7, 143.3, 140.9, 138.8, 138.2, 138.2, 136.6, 129.9, 129.1, 127.2, 127.0, 125.5, 121.0, 120.2, 119.9, 118.1, 36.9. HRMS-ESI (m/z): [M − H]− calcd for C19H13ClNO2S, 354.0356, found [M − H]− 354.1710. FTIR (neat), cm−1: 3213, 1325, 1150.
4.4.4. Compound 6 (4-chloro-N-[4-(morpholin-4-yl)phenyl]benzene-1-sulfonamide)
Tan solid, 102 mg; Yield: 52%; 1H NMR (500 MHz, DMSO-d6) δ 9.88 (s, 1H), 7.70 – 7.52 (m, 4H), 6.89 (d, J = 8.9 Hz, 2H), 6.79 (d, J = 9.0 Hz, 2H), 3.78 – 3.57 (m, 4H), 3.07 – 2.89 (m, 4H). 13C NMR (126 MHz, DMSO-d6) δ 149.0, 139.0, 138.0, 129.8, 129.1, 128.8, 123.9, 115.9, 66.5, 48.8. HRMS-ESI (m/z): [M + H]+ calcd for C16H18ClN2O3S, 353.0727, found [M + H]+ 353.1532. FTIR (neat), cm−1: 3218, 1329, 1156.
4.4.5. Compound 7 (4-chloro-N-[4-(thiomorpholin-4-yl)phenyl]benzene-1-sulfonamide)
Brown solid, 120 mg; Yield: 63%; 1H NMR (500 MHz, DMSO-d6) δ 9.87 (s, 1H), 7.77 – 7.49 (m, 4H), 6.87 (d, J = 9.0 Hz, 2H), 6.77 (d, J = 9.1 Hz, 2H), 3.46 – 3.33 (m, 4H), 2.70 – 2.52 (m, 4H). 13C NMR (126 MHz, DMSO-d6) δ 148.7, 139.0, 138.0, 129.8, 129.1, 128.5, 124.0, 117.2, 51.5, 26.1. HRMS-ESI (m/z): [M + H]+ calcd for C16H18ClN2O2S2, 369.0498, found [M + H]+ 369.1861. FTIR (neat), cm−1: 3212, 1326, 1151.
4.4.6. Compound 8 (4-chloro-N-[4-(piperidin-1-yl)phenyl]benzene-1-sulfonamide)
Light pink solid, 104 mg; Yield: 52%; 1H NMR (500 MHz, DMSO-d6) δ 9.82 (s, 1H), 7.75 – 7.48 (m, 4H), 6.85 (d, J = 9.0 Hz, 2H), 6.76 (d, J = 9.1 Hz, 2H), 3.13 – 2.88 (m, 4H), 1.54 (q, J = 5.6 Hz, 4H), 1.47 (d, J = 5.4 Hz, 2H). 13C NMR (126 MHz, DMSO-d6) δ 149.7, 139.0, 137.9, 129.7, 129.1, 128.1, 124.0, 116.6, 49.9, 25.7, 24.2. HRMS-ESI (m/z): [M + H]+ calcd for C17H20ClN2O2S, 351.0934, found [M + H]+ 351.0952. FTIR (neat), cm−1: 3209, 1326, 1150.
4.4.7. Compound 9 (4-chloro-N-[4-(5-methyl-1,3-benzothiazol-2-yl)phenyl]benzene-1-sulfonamide)
Beige solid, 177 mg; Yield: 51%; 1H NMR (500 MHz, DMSO-d6) δ 10.82 (s, 1H), 7.93 (d, J = 8.7 Hz, 2H), 7.86 (d, J = 3.9 Hz, 2H), 7.81 (d, J = 8.7 Hz, 2H), 7.64 (d, J = 8.7 Hz, 2H), 7.30 (dd, J = 8.4, 1.7 Hz, 1H), 7.26 (d, J = 8.7 Hz, 2H), 2.41 (s, 3H). 13C NMR (126 MHz, DMSO-d6) δ 165.9, 152.2, 140.6, 138.6, 138.6, 135.6, 135.0, 130.1, 129.1, 128.8, 128.5, 122.7, 122.3, 120.2, 21.5. HRMS-ESI (m/z): [M + Na]+ calcd for C20H15ClN2NaO2S2, 437.0161, found [M + Na]+ 437.2186. FTIR (neat), cm−1: 3457,1398, 1164.
4.4.8. Compound 10 (4-chloro-N-(4-methanesulfonylphenyl)benzene-1-sulfonamide)
Light pink solid, 447 mg; Yield: 87%; 1H NMR (500 MHz, DMSO-d6) δ 11.11 (s, 1H), 7.84 (d, J = 8.7 Hz, 2H), 7.79 (d, J = 8.8 Hz, 2H), 7.66 (d, J = 8.7 Hz, 2H), 7.30 (d, J = 8.8 Hz, 2H), 3.11 (s, 3H). 13C NMR (126 MHz, DMSO-d6) δ 142.7, 138.8, 138.5, 135.9, 130.2, 129.2, 129.1, 119.0, 44.1. HRMS-ESI (m/z): [M − H]− calcd for C13H11ClNO4S2, 343.9818, found [M − H]− 343.9820. FTIR (neat), cm−1: 3189, 1329, 1156.
4.4.9. Compound 11(4-chloro-N-(4-methoxy-1,3-benzothiazol-2-yl)benzene-1-sulfonamide)
Pink solid, 107 mg; Yield: 54%; 1H NMR (500 MHz, DMSO-d6) δ 7.91 – 7.74 (m, 2H), 7.67 – 7.54 (m, 2H), 7.35 (dd, J = 8.0, 0.9 Hz, 1H), 7.21 (t, J = 8.1 Hz, 1H), 7.03 (dd, J = 8.2, 1.0 Hz, 1H), 3.86 (s, 3H). 13C NMR (126 MHz, DMSO-d6) δ 167.8, 146.7, 141.4, 137.6, 129.7, 128.2, 126.2, 126.01, 125.2, 114.9, 109.7, 56.6. HRMS-ESI (m/z): [M − H]− calcd for C14H10ClN2O3S, 352.9821, found [M − H]− 352.9672. FTIR (neat), cm−1: 3131, 1332, 1135.
4.4.10. Compound 12 (4-chloro-N-(4-methoxy-1,3-benzothiazol-2-yl)benzene-1-sulfonamide)
Light pink solid, 387 mg; Yield: 79%; 1H NMR (500 MHz, DMSO-d6) δ 7.85 (d, J = 8.7 Hz, 2H), 7.82 – 7.77 (m, 1H), 7.61 (d, J = 8.6 Hz, 2H), 7.39 (ddd, J = 8.4, 7.3, 1.2 Hz, 1H), 7.32 – 7.28 (m, 1H), 7.25 (ddd, J = 8.0, 7.3, 1.2 Hz, 1H). 13C NMR (126 MHz, DMSO-d6) δ 167.8, 141.3, 137.7, 136.6, 129.8, 128.2, 127.8, 125.2, 124.3, 123.3, 113.4. HRMS-ESI (m/z): [M + H]+ calcd for C13H9ClN2O2S2, 323.9794, found [M − H]− 322.9720. FTIR (neat), cm−1: 3032, 1322, 1148.
4.4.11. Compound 13 (4-chloro-N-(1H-indol-5-yl)benzene-1-sulfonamide)
Tan solid, 157 mg; Yield: 68%; 1H NMR (500 MHz, DMSO-d6) δ 11.05 (s, 1H), 9.87 (s, 1H), 7.64 (d, J = 8.7 Hz, 2H), 7.55 (d, J = 8.7 Hz, 2H), 7.29 (s, 1H), 7.25 – 7.18 (m, 2H), 6.78 (dd, J = 8.6, 2.1 Hz, 1H), 6.32 (s, 1H). 13C NMR (126 MHz, DMSO-d6) δ 139.0, 137.8, 134.2, 129.6, 129.1, 129.0, 128.1, 126.8, 117.7, 114.7, 112.2, 101.6. HRMS-ESI (m/z): [M + H]+ calcd for C14H12ClN2O2S, 307.0308, found [M + H]+ 307.1488. FTIR (neat), cm−1: 3337, 3248, 1327, 1155.
4.4.12. Compound 14 (4-chloro-N-(quinolin-5-yl)benzene-1-sulfonamide)
Orange solid, 115 mg; Yield: 55%; 1H NMR (500 MHz, DMSO-d6) δ 8.95 (dd, J = 4.2, 1.6 Hz, 1H), 8.23 (d, J = 8.5 Hz, 1H), 7.82 – 7.75 (m, 7H), 7.50 (dd, J = 8.6, 4.1 Hz, 1H), 7.38 – 7.30 (m, 1H). 13C NMR (126 MHz, DMSO-d6) δ 151.9, 148.7, 140.8, 136.8, 133.0, 131.6, 130.8, 130.5, 130.1, 129.7, 128.0, 123.0. HRMS-ESI (m/z): [M + H]+ calcd for C15H12ClN2O2S, 319.0308, found [M + H]+ 319.0316. FTIR (neat), cm−1: 3088, 1384, 1177.
4.4.13. Compound 15 (N-(9H-fluoren-2-yl)-4-nitrobenzene-1-sulfonamide)
Yellow solid, 113 mg; Yield: 56%; 1H NMR (500 MHz, DMSO-d6) δ 10.38 (s, 1H), 7.73 (t, J = 7.6 Hz, 2H), 7.68 – 7.61 (m, 2H), 7.45 (t, J = 7.5 Hz, 2H), 7.41 – 7.33 (m, 2H), 7.31 (t, J = 7.5 Hz, 1H), 7.23 (t, J = 7.4 Hz, 1H), 7.15 (dd, J = 8.2, 2.0 Hz, 1H), 3.82 (s, 2H). 13C NMR (126 MHz, DMSO-d6) δ 144.7, 144.7, 143.2, 141.0, 129.6, 129.0, 127.9, 127.8, 127.5, 127.2, 126.9, 125.5, 121.0, 120.1, 119.5, 117.7, 36.9. HRMS-ESI (m/z): [M − H]− calcd for C19H13N2O4S, 365.0596, found [M − H]− 365.0312. FTIR (neat), cm−1: 3257, 1537, 1348, 1162.
4.4.14. Compound 16 (N-[4-(morpholin-4-yl)phenyl]-4-nitrobenzene-1-sulfonamide)
Yellow solid, 369 mg; Yield: 75%; 1H NMR (500 MHz, DMSO-d6) δ 10.14 (s, 1H), 8.50 – 8.19 (m, 2H), 7.90 (d, J = 8.3 Hz, 2H), 6.90 (d, 8.5 Hz, 2H), 6.86 – 6.66 (m, 2H), 3.66 (s, 4H), 2.99 (s, 4H). 13C NMR (126 MHz, DMSO-d6) δ 150.2, 149.3, 145.6, 128.8, 128.2, 125.0, 124.2, 115.9, 66.5, 48.7. HRMS-ESI (m/z): [M − H] + calcd for C16H16N3O5S, 362.0811, found [M − H]− 362.0816. FTIR (neat), cm−1: 3268, 1513, 1331, 1116.
4.4.15. Compound 17 (4-nitro-N-[4-(thiomorpholin-4-yl)phenyl]benzene-1-sulfonamide)
Brown solid, 372 mg; Yield: 65%; 1H NMR (500 MHz, DMSO-d6) δ 10.13 (s, 1H), 8.35 (d, J = 8.6 Hz, 2H), 7.90 (d, J = 8.6 Hz, 2H), 6.89 (d, J = 8.7 Hz, 2H), 6.78 (d, J = 8.5 Hz, 2H), 3.39 (d, J = 2.4 Hz, 4H), 2.59 (s, 4H). 13C NMR (126 MHz, DMSO-d6) δ 150.2, 148.8, 145.7, 128.8, 127.9, 125.0, 124.3, 117.1, 51.4, 26.0. HRMS-ESI (m/z): [M − H]− calcd for C16H16N3O4S2, 378.0582, found [M − H]− 378.0599. FTIR (neat), cm−1: 3281, 1530, 1347, 1166.
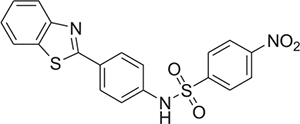
4.4.16. Compound 18 (N-[4-(1,3-benzothiazol-2-yl)phenyl]-4-nitrobenzene-1-sulfonamide)
Beige solid, 711 mg; Yield: 58%; 1H NMR (500 MHz, DMSO-d6) δ 11.10 (s, 1H), 8.37 (d, J = 8.5 Hz, 2H), 8.07 (dd, J = 8.7, 2.3 Hz, 3H), 8.03 – 7.92 (m, 3H), 7.49 (t, J = 7.7 Hz, 1H), 7.40 (t, J = 7.6 Hz, 1H), 7.31 (d, J = 8.7 Hz, 2H). 13C NMR (126 MHz, DMSO-d6) δ 166.9, 154.0, 150.5, 145.1, 140.3, 134.8, 129.3, 129.0, 128.8, 127.1, 125.9, 125.3, 123.2, 122.8, 120.5. HRMS-ESI (m/z): [M − H]− calcd for C19H12N3O4S2, 410.0269, found [M − H]− 410.8632. FTIR (neat), cm−1: 3257, 1526, 1348, 1160.
4.4.17. Compound 19 (N-(1,3-benzothiazol-2-yl)-4-nitrobenzene-1-sulfonamide)
Yellow solid, 443 mg; Yield: 88%; 1H NMR (500 MHz, DMSO-d6) δ 8.36 (d, J = 8.9 Hz, 2H), 8.09 (d, J = 8.9 Hz, 2H), 7.83 (dt, J = 8.0, 0.9 Hz, 1H), 7.40 (ddd, J = 8.3, 7.3, 1.2 Hz, 1H), 7.34 – 7.23 (m, 2H). 13C NMR (126 MHz, DMSO-d6) δ 168.3, 150.0, 147.8, 136.6, 127.9, 125.3, 125.1, 124.5, 123.4, 113.6. HRMS-ESI (m/z): [M + Na]+ calcd for C13H9N3NaO4S2, 357.9932, found [M + Na]+ 358.8911. FTIR (neat), cm−1: 3107, 1581, 1333, 1147.
4.4.18. Compound 20 (N-(4-methoxy-1,3-benzothiazol-2-yl)-4-nitrobenzene-1-sulfonamide)
Beige solid, 140 mg; Yield: 51%; 1H NMR (500 MHz, DMSO-d6) δ 8.35 (d, J = 8.8 Hz, 2H), 8.08 (d, J = 8.9 Hz, 2H), 7.37 (dd, J = 8.0, 0.9 Hz, 1H), 7.23 (t, J = 8.1 Hz, 1H), 7.04 (dd, J = 8.2, 0.9 Hz, 1H), 3.86 (s, 3H). 13C NMR (126 MHz, DMSO-d6) δ 168.2, 149.9, 147.8, 146.9, 127.8, 126.2, 126.2, 125.5, 125.0, 114.9, 109.7, 56.6. HRMS-ESI (m/z): [M + H]+ calcd for C21H17N2O3S2, 366.0218, found [M + H]+ 366.0225. FTIR (neat), cm−1: 3105, 1525, 1348, 1131.
4.4.19. Compound 21 (4-acetyl-N-[4-(1,3-benzothiazol-2-yl)phenyl]benzene-1-sulfonamide)
Yellow solid, 225 mg; Yield: 62%; 1H NMR (500 MHz, DMSO-d6) δ 10.94 (s, 1H), 8.14 – 8.04 (m, 3H), 8.03 – 7.89 (m, 5H), 7.49 (ddd, J = 8.3, 7.2, 1.3 Hz, 1H), 7.41 (ddd, J = 8.3, 7.2, 1.2 Hz, 1H), 7.35 – 7.19 (m, 2H), 2.56 (s, 3H). 13C NMR (126 MHz, DMSO-d6) δ 197.7, 167.0, 154.0, 143.3, 140.7, 140.4, 134.8, 129.7, 129.0, 127.6, 127.1, 125.9, 123.1, 122.8, 120.1, 27.5. HRMS-ESI (m/z): [M + H]+ calcd for C21H17N2O3S2, 409.0681, found [M + H]+ 409.0702. FTIR (neat), cm−1: 3023, 1685, 1343, 1156.
4.4.20. Compound 22 (4-acetyl-N-[4-(morpholin-4-yl)phenyl]benzene-1-sulfonamide)
Green solid, 112 mg; Yield: 56%; 1H NMR (500 MHz, DMSO-d6) δ 10.05 (s, 1H), 8.05 (d, J = 8.5 Hz, 2H), 7.80 (d, J = 8.5 Hz, 2H), 6.92 (d, J = 9.0 Hz, 2H), 6.89 – 6.77 (m, 2H), 3.69 – 3.66 (m, 4H), 3.02 – 2.93 (m, 4H), 2.58 (s, 3H). 13C NMR (126 MHz, DMSO-d6) δ 197.8, 143.8, 140.0, 129.7, 129.4, 128.9, 127.5, 123.6, 116.3, 66.4, 49.0, 27.5. HRMS-ESI (m/z): [M + H]+ calcd for C18H21N2O4S, 361.1222, found [M + H]+ 362.8322. FTIR (neat), cm−1: 2964, 1686, 13 8, 1159.
4.4.21. Compound 23 (N-(9H-fluoren-2-yl)thiophene-2-sulfonamide)
Orange solid, 262 mg; Yield: 54%; 1H NMR (500 MHz, DMSO-d6) δ 10.44 (s, 1H), 7.85 (dd, J = 4.9, 1.4 Hz, 1H), 7.81 – 7.71 (m, 2H), 7.56 – 7.48 (m, 2H), 7.38 – 7.29 (m, 2H), 7.25 (td, J = 7.4, 1.2 Hz, 1H), 7.15 (dd, J = 8.2, 2.0 Hz, 1H), 7.08 (dd, J = 5.0, 3.7 Hz, 1H), 3.84 (s, 2H). 13C NMR (126 MHz, DMSO-d6) δ 144.6, 143.3, 141.0, 140.4, 138.2, 136.7, 133.7, 132.9, 128.1, 127.3, 127.0, 125.5, 121.0, 120.2, 119.9, 118.1, 36.9. HRMS-ESI (m/z): [M − H]− calcd for C17H12NO2S2, 326.0309, found [M − H]− 326.0309. FTIR (neat), cm−1: 3284,1333, 1151.
4.4.22. Compound 24 (N-[4-(morpholin-4-yl)phenyl]-2,3-dihydro-1,4-benzodioxine-6-sulfonamide)
Gray solid, 130 mg; Yield: 62%; 1H NMR (500 MHz, DMSO-d6) δ 9.88 (s, 1H), 7.17 (d, J = 3.9 Hz, 2H), 6.96 (t, J = 6.5 Hz, 5H), 4.25 (d, J = 7.2 Hz, 4H), 3.72 (t, J = 3.5 Hz, 4H), 3.06 (d, J = 4.8 Hz, 4H). 13C NMR (126 MHz, DMSO-d6) δ 172.5, 147.5, 143.6, 132.5, 122.7, 122.6, 120.8, 117.9, 117.1, 116.2, 66.1, 64.8, 64.5. HRMS-ESI (m/z): [M + H]+ calcd for C18H21N2O5S, 377.1171, found [M + H]+ 377.1164. FTIR (neat), cm−1: 3259, 1340, 1153.
4.5. Biophysical assay chemicals, α-synuclein (α-syn), and p-tau
All drug candidates were dissolved in DMSO at 40 mM and used at final concentrations lower than 0.12% (v/v) to avoid any potential toxicity. DMSO was obtained from Alfa Aesar (Ward Hill, MA) and thioflavin-S (ThS) and thioflavin-T (ThT) were purchased from Sigma Aldrich (Burlington, MA). α-Syn was purchased from rPeptide, LLC (Watkinsville, GA). P-tau was prepared as published previously [15–18].
4.6. Thioflavin-T (ThT) fluorescence assay on α-syn
Thioflavin T-based fluorescence assays were used to detect the formation of fibrils using the procedure described previously [30]. In the assay, the compounds were added first (final concentrations of 100 μM), followed by the ThT (final concentration of 20 μM) and then the recombinant α-syn after immediate solubilization in the buffer. α-Syn was dissolved in 20 mM Tris–HCl (pH 7.4) supplemented with 100 mM NaCl to a stock solution of 280 μM (1 mg/250 μL) prior to resuspending it in the ThT buffer to obtain a final concentration of 6 μM in each well. The kinetics of fibril formation begin when the α-syn is solubilized in the ThT buffer (10 mM PBS buffer (pH 7.4), supplemented with 0.5 mM SDS and 300 mM NaCl) and added to a non-treated black 96 well microplate with a transparent flat bottom. Each well was filled with a maximum volume of 150 μL buffer with one 3 mm borosilicate bead [38]. The background signal consisted of ThT in buffer and 0.25% DMSO without α-syn peptide. The fluorescence emission experiments were performed with the excitation and emission wavelengths set at 440 and 485 nm, respectively, with a Synergy HT multi-mode microplate reader (BioTek, Winooski, VT). Measurements were taken at 37 °C every 20 min over 51 h with 30 s of shaking prior to reading the plate. Samples were measured in three replicates and the experiments were repeated three times using different α-syn stock solutions. For each time point, arbitrary units of fluorescence were calculated from the mean values normalized against the maximum value in each completed assay. Arbitrarily, the maximum value (100%) for the fluorescence intensity was established for α-syn.
4.7. Thioflavin-S (ThS) fluorescence assay on p-tau isoform 1N4R
p-Tau from the stock solution of 1 mM was added to 20 mM Tris buffer (pH 7.4) and transferred to a black microplate 384 well plate with flat bottom and medium binding (greiner bio-one, ref 784076). Each well contained a final volume of 15 μL with a peptide final concentration of 6 μM. Experiments in the presence of p-tau were initiated by adding a solution of ThS at a final concentration of 20 μM with different compounds. Best compounds were tested at a final concentration of 50 μM. The background sample consisted of 0.1 % DMSO in buffer without p-tau. The plate was sealed and read with the excitation and emission wavelengths set at 440 and 485 nm, respectively, with a Synergy HT multi-mode microplate reader (BioTek, Winooski, VT). Measurements were taken at 37 °C every 10 min for 12 hours. Samples were measured in three replicates and the experiments were repeated three times using different p-tau stock solutions. For each time point, arbitrary units of fluorescence were calculated from substracting the fluorescence intensity at the initiation of the ThT assay (i.e. time 0; T0) and the resulting kinetic curves obrained from replicates were averaged in each completed assay.
4.8. Transmission electron microscopy
Prior to visualization, p-tau (10 μM) was incubated with 50 μM of sulfonamide derivatives compound for 24 h. Concerning α-syn, a concentration of 60 μM was used with 600 μM of the compound of interest. A volume of 10 μL was applied on a 400-mesh Formvarcarbon-coated copper grid (Electron Microscopy Sciences, Hatfield, PA) to confirm the presence or the absence of fibrils. The grids were incubated for 1 minute and washed three times with distilled water. They were carefully air-dried and incubated for 1 minute in a fresh solution of 1% uranyl acetate. Samples were air-dried and observed using a transmission microscope (JEOL 1400 Flash, Japan). Pictures were acquired at an accelerating voltage of 100 kV and magnification of 40 k.
4.9. α-Syn (or αS) inclusion-forming neuroblastoma cell experiment
As previously described, dox-inducible neuroblastoma cells M17D-TR/ αS-3K::YFP were used [30,37]. Cells were plated in 96-well plates were used with 30,000 cells per well. After 24 h, compounds were added at specific concentrations and plates were incubated for 24 h. αS-3K::YFP transgene expression was then induced in the presence of dox (1 ug per mL, final concentration in culture media). Cells were incubated in the Incucyte Zoom 2000 platform (Essen Biosciences). Images (green, bright field) were acquired continuously. After 48 hours of induction, analysis of inclusion formation and cell growth were performed (96 h after plating). The Incucyte processing definition ‘Inclusions’ and parameters for cell confluence measurement can be found in [30]. A-syn-specific monoclonal antibody 4B12 (Thermofisher, Waltham, MA; 1:1000) and a polyclonal antibody to GAPDH (Sigma-Aldrich, St. Louis, MO, G9545; 1:5000) were used for the Western Blotting.
4.10. Molecular docking parameters
The ground-state geometries of the ligands were optimized using Becke’s three-parameter hybrid exchange functional along with the Lee–Yang–Parr correction functional (B3LYP) method in conjunction with the 6–311G+(d, p) basis set using Gaussian 16 software package (Tables S1–4). The docking studies were performed with AutoDock 4.2 [39–41]. The grid size was set to 80×80×80 points with a grid spacing of 0.375 A° to cover the reported active site on Tau (PDB ID: 1QAB) plasmid [42]. The intermolecular polar interactions and bond angles were analyzed and visualized by UCSF Chimera (version 1.14).
4.11. Statistical analysis
For Figs. 4,5, and 6, data were analyzed by one-way analysis of variance with Dunnett’s multiple comparisons between control and several treatments. Differences were considered statistically significant at p < 0.1.
Supplementary Material
Acknowledgements
AKS has been supported by the National Institutes of Health (NIH) grant (R21AG070447-01A1) awarded to JF. Financial support of JF was provided by the Pharmaceutical Research and Manufacturers of America Foundation (730313). U.D. was supported by NIH grants NS121826 and NS099328. SEC was supported by NIH grants P01AG014449 and R01AG060731. ML, KWW and HTH have been supported by NIH grants R01AG062435 and R44AG57274 awarded to MHK. The authors would like to acknowledge the technical support of Eduardo Ramirez at Purdue University and professional services of Alicia Withrow at the Center for Advanced Microscopy at Michigan State University.
Footnotes
Declaration of Competing Interest
The authors declare no competing interest.
Supplementary materials
Supplementary material associated with this article can be found, in the online version, at doi: 10.1016/j.molstruc.2022.133574.
Data Availability
The datasets generated during and/or analyzed during the current study are available in the present article.
References
- [1].Hickman S, Izzy S, Sen P, Morsett L, El Khoury J, Microglia in neurodegeneration, Nat. Neurosci. 21 (10) (2018) 1359–1369. [DOI] [PMC free article] [PubMed] [Google Scholar]
- [2].Arriagada PV, Marzloff K, Hyman BT, Distribution of Alzheimer-type pathologic changes in nondemented elderly individuals matches the pattern in Alzheimer’s disease, Neurology 42 (9) (1992) 1681–1688. [DOI] [PubMed] [Google Scholar]
- [3].Braak H, Alafuzoff I, Arzberger T, Kretzschmar H, Del Tredici K, Staging of Alzheimer disease-associated neurofibrillary pathology using paraffin sections and immunocytochemistry, Acta Neuropathol. 112 (4) (2006) 389–404. [DOI] [PMC free article] [PubMed] [Google Scholar]
- [4].Cummings J, Lee G, Mortsdorf T, Ritter A, Zhong K, Alzheimer’s disease drug development pipeline: 2017, Alzheimers Dement 3 (3) (2017) 367–384. [DOI] [PMC free article] [PubMed] [Google Scholar]
- [5].Mehta D, Jackson R, Paul G, Shi J, Sabbagh M, Why do trials for Alzheimer’s disease drugs keep failing? A discontinued drug perspective for 2010–2015, Expert Opin. Investig. Drugs 26 (6) (2017) 735–739. [DOI] [PMC free article] [PubMed] [Google Scholar]
- [6].Crowe A, James MJ, Lee VM, Smith AB 3rd, Trojanowski JQ, Ballatore C, Brunden KR, Aminothienopyridazines and methylene blue affect Tau fibrillization via cysteine oxidation, J. Biol. Chem. 288 (16) (2013) 11024–11037. [DOI] [PMC free article] [PubMed] [Google Scholar]
- [7].Pickhardt M, Gazova Z, von Bergen M, Khlistunova I, Wang Y, Hascher A, Mandelkow EM, Biernat J, Mandelkow E, Anthraquinones inhibit tau aggregation and dissolve Alzheimer’s paired helical filaments in vitro and in cells, J. Biol. Chem. 280 (5) (2005) 3628–3635. [DOI] [PubMed] [Google Scholar]
- [8].Pickhardt M, Larbig G, Khlistunova I, Coksezen A, Meyer B, Mandelkow EM, Schmidt B, Mandelkow E, Phenylthiazolyl-hydrazide and its derivatives are potent inhibitors of tau aggregation and toxicity in vitro and in cells, Biochemistry 46 (35) (2007) 10016–10023. [DOI] [PubMed] [Google Scholar]
- [9].Soeda Y, Yoshikawa M, Almeida OF, Sumioka A, Maeda S, Osada H, Kondoh Y, Saito A, Miyasaka T, Kimura T, Suzuki M, Koyama H, Yoshiike Y, Sugimoto H, Ihara Y, Takashima A, Toxic tau oligomer formation blocked by capping of cysteine residues with 1,2-dihydroxybenzene groups, Nat. Commun. 6 (2015) 10216. [DOI] [PMC free article] [PubMed] [Google Scholar]
- [10].Wise J, No “breakthrough” in Alzheimer’s disease, BMJ 354 (2016) i4474. [DOI] [PubMed] [Google Scholar]
- [11].Miao J, Shi R, Li L, Chen F, Zhou Y, Tung YC, Hu W, Gong CX, Iqbal K, Liu F, Pathological tau from Alzheimer’s brain induces site-specific hyperphosphorylation and SDS- and reducing agent-resistant aggregation of tau in vivo, Front. Aging Neurosci. 11 (2019) 34. [DOI] [PMC free article] [PubMed] [Google Scholar]
- [12].Selden SC, Pollard TD, Phosphorylation of microtubule-associated proteins regulates their interaction with actin filaments, J. Biol. Chem. 258 (11) (1983) 7064–7071. [PubMed] [Google Scholar]
- [13].Mazanetz MP, Fischer PM, Untangling tau hyperphosphorylation in drug design for neurodegenerative diseases, Nat. Rev. Drug Discov. 6 (6) (2007) 464–479. [DOI] [PubMed] [Google Scholar]
- [14].Hanger DP, Anderton BH, Noble W, Tau phosphorylation: the therapeutic challenge for neurodegenerative disease, Trends Mol. Med. 15 (3) (2009) 112–119. [DOI] [PubMed] [Google Scholar]
- [15].Sui D, Liu M, Kuo MH, In vitro aggregation assays using hyperphosphorylated tau protein, J. Vis. Exp. (95) (2015) e51537 Published online 2015 Jan 2, doi: 10.3791/51537. [DOI] [PMC free article] [PubMed] [Google Scholar]
- [16].Sui D, Xu X, Ye X, Liu M, Mianecki M, Rattanasinchai C, Buehl C, Deng X, Kuo MH, Protein interaction module-assisted function X (PIMAX) approach to producing challenging proteins including hyperphosphorylated tau and active CDK5/p25 kinase complex, Mol. Cell Proteomics 14 (1) (2015) 251–262. [DOI] [PMC free article] [PubMed] [Google Scholar]
- [17].Liu M, Sui D, Dexheimer T, Hovde S, Deng X, Wang KW, Lin HL, Chien HT, Kweon HK, Kuo NS, Ayoub CA, Jimenez-Harrison D, Andrews PC, Kwok R, Bochar DA, Kuret J, Fortin J, Tsay YG, Kuo MH, Hyperphosphorylation renders tau prone to aggregate and to cause cell death, Mol. Neurobiol. 57 (11) (2020) 4704–4719. [DOI] [PMC free article] [PubMed] [Google Scholar]
- [18].Liu M, Dexheimer T, Sui D, Hovde S, Deng X, Kwok R, Bochar DA, Kuo MH, Hyperphosphoryalted tau aggregation and cytotoxicity modulators screen identified prescription drugs linked to Alzheimer’s disease and cognitive functions, Sci. Rep. 10 (1) (2020) 16551 Oct 6, doi: 10.1038/s41598020736802. [DOI] [PMC free article] [PubMed] [Google Scholar]
- [19].Rankin CA, Sun Q, Gamblin TC, Tau phosphorylation by GSK-3beta promotes tangle-like filament morphology, Mol. Neurodegener. 2 (2007) 12. [DOI] [PMC free article] [PubMed] [Google Scholar]
- [20].Despres C, Di J, Cantrelle FX, Li Z, Huvent I, Chambraud B, Zhao J, Chen J, Chen S, Lippens G, Zhang F, Linhardt R, Wang C, Klarner FG, Schrader T, Landrieu I, Bitan G, Smet-Nocca C, Major differences between the self-assembly and seeding behavior of heparin-induced and in vitro phosphorylated tau and their modulation by potential inhibitors, ACS Chem. Biol. 14 (6) (2019) 1363–1379. [DOI] [PMC free article] [PubMed] [Google Scholar]
- [21].Falcon B, Cavallini A, Angers R, Glover S, Murray TK, Barnham L, Jackson S, O’Neill MJ, Isaacs AM, Hutton ML, Szekeres PG, Goedert M, Bose S, Conformation determines the seeding potencies of native and recombinant Tau aggregates, J. Biol. Chem. 290 (2) (2015) 1049–1065. [DOI] [PMC free article] [PubMed] [Google Scholar]
- [22].Lo Cascio F, Garcia S, Montalbano M, Puangmalai N, McAllen S, Pace A, Palumbo Piccionello A, Kayed R, Modulating disease-relevant tau oligomeric strains by small molecules, J. Biol. Chem. 295 (44) (2020) 14807–14825. [DOI] [PMC free article] [PubMed] [Google Scholar]
- [23].Bulic B, Pickhardt M, Schmidt B, Mandelkow EM, Waldmann H, Mandelkow E, Development of tau aggregation inhibitors for Alzheimer’s disease, Angew. Chem. Int. Ed. Engl. 48 (10) (2009) 1740–1752. [DOI] [PubMed] [Google Scholar]
- [24].Congdon EE, Sigurdsson EM, Tau-targeting therapies for Alzheimer disease, Nat. Rev. Neurol. 14 (7) (2018) 399–415. [DOI] [PMC free article] [PubMed] [Google Scholar]
- [25].Smolek T, Jadhav S, Brezovakova V, Cubinkova V, Valachova B, Novak P, Zilka N, First-in-rat study of human Alzheimer’s disease tau propagation, Mol. Neurobiol. 56 (1) (2019) 621–631. [DOI] [PubMed] [Google Scholar]
- [26].Himmler A, Drechsel D, Kirschner MW, Martin DW Jr., Tau consists of a set of proteins with repeated C-terminal microtubule-binding domains and variable N-terminal domains, Mol. Cell Biol. 9 (4) (1989) 1381–1388. [DOI] [PMC free article] [PubMed] [Google Scholar]
- [27].Evans DB, Rank KB, Bhattacharya K, Thomsen DR, Gurney ME, Sharma SK, Tau phosphorylation at serine 396 and serine 404 by human recombinant tau protein kinase II inhibits tau’s ability to promote microtubule assembly, J. Biol. Chem. 275 (32) (2000) 24977–24983. [DOI] [PubMed] [Google Scholar]
- [28].Dayanandan R, Van Slegtenhorst M, Mack TG, Ko L, Yen SH, Leroy K, Brion JP, Anderton BH, Hutton M, Lovestone S, Mutations in tau reduce its microtubule binding properties in intact cells and affect its phosphorylation, FEBS Lett. 446 (2–3) (1999) 228–232. [DOI] [PubMed] [Google Scholar]
- [29].Sergeant N, Delacourte A, Buee L, Tau protein as a differential biomarker of tauopathies, Biochim. Biophys. Acta 1739 (2–3) (2005) 179–197. [DOI] [PubMed] [Google Scholar]
- [30].Soham M, Kazuma S, Rivet LN, O’Dell M, Rashid AM, Isa NBM, Kepczynski RS, Dettmer U, Borhan B, Fortin JS, In vitro characterization of urea derivatives to inhibit alpha-synuclein early-stage aggregation, J. Mol. Struct. 1249 (2022) 131569 5 February. [Google Scholar]
- [31].Fortin JS, Benoit-Biancamano MO, Gaudreault RC, Discovery of ethyl urea derivatives as inhibitors of islet amyloid polypeptide fibrillization and cytotoxicity, Can. J. Physiol. Pharmacol. 94 (3) (2016) 341–346 Mar. [DOI] [PubMed] [Google Scholar]
- [32].Petitclerc E, Deschesnes RG, Cote MF, Marquis C, Janvier R, Lacroix J, Miot-Noirault E, Legault J, Mounetou E, Madelmont JC, Gaudreault RC, Antiangiogenic and antitumoral activity of phenyl-3-(2-chloroethyl)ureas: a class of soft alkylating agents disrupting microtubules that are unaffected by cell adhesion-mediated drug resistance, Cancer Res, 64 (13) (2004) 4654–4663. [DOI] [PubMed] [Google Scholar]
- [33].Deschesnes RG, Patenaude A, Rousseau JLC, Fortin JS, Ricard C, Cote MF, Hut J, Gaudreault RC, Petitclerc E, Microtubule-destabilizing agents induce focal adhesion structure disorganization and anoikis in cancer cells, J. Pharmacol. Exp. Ther. 320 (2) (2007) 853–864. [DOI] [PubMed] [Google Scholar]
- [34].Wager TT, Hou X, Verhoest PR, Villalobos A, Central nervous system multiparameter optimization desirability: application in drug discovery, ACS Chem. Neurosci. 7 (6) (2016) 767–775. [DOI] [PubMed] [Google Scholar]
- [35].Gade Malmos K, Blancas-Mejia LM, Weber B, Buchner J, Ramirez-Alvarado M, Naiki H, Otzen D, ThT 101: a primer on the use of thioflavin T to investigate amyloid formation, Amyloid 24 (1) (2017) 1–16. [DOI] [PubMed] [Google Scholar]
- [36].Imberdis T, Negri J, Ramalingam N, Terry-Kantor E, Ho GPH, Fanning S, Stirtz G, Kim T-E, Levy OA, Young-Pearse TL, Selkoe D, Dettmer U, Cell models of lipid-rich α-synuclein aggregation validate known modifiers of α-synuclein biology and identify stearoyl-CoA desaturase, Proc. Natl. Acad. Sci. 116 (41) (2019) 20760–20769. [DOI] [PMC free article] [PubMed] [Google Scholar]
- [37].Terry-Kantor E, Tripathi A, Imberdis T, LaVoie ZM, Ho GPH, Selkoe D, Fanning S, Ramalingam N, Dettmer U, Rapid alpha-synuclein toxicity in a neural cell model and its rescue by a stearoyl-CoA desaturase inhibitor, Int. J. Mol. Sci. 21 (15) (2020) 5193. [DOI] [PMC free article] [PubMed] [Google Scholar]
- [38].Sipe JD, Cohen AS, Review: history of the amyloid fibril, J. Struct. Biol. 130 (2–3) (2000) 88–98. [DOI] [PubMed] [Google Scholar]
- [39].Kumari B, Yadav A, Pany SP, Pradeepkumar PI, Kanvah S, Cationic red emitting fluorophore: a light up NIR fluorescent probe for G4-DNA, J. Photochem. Photobiol. B 190 (2019) 128–136. [DOI] [PubMed] [Google Scholar]
- [40].Morris GM, Huey R, Lindstrom W, Sanner MF, Belew RK, Goodsell DS, Olson AJ, AutoDock4 and AutoDockTools4: automated docking with selective receptor flexibility, J. Comput. Chem. 30 (16) (2009) 2785–2791. [DOI] [PMC free article] [PubMed] [Google Scholar]
- [41].Artese A, Costa G, Distinto S, Moraca F, Ortuso F, Parrotta L, Alcaro S, Toward the design of new DNA G-quadruplex ligands through rational analysis of polymorphism and binding data, Eur. J. Med. Chem. 68 (2013) 139–149. [DOI] [PubMed] [Google Scholar]
- [42].Bijari N, Balalaie S, Akbari V, Golmohammadi F, Moradi S, Adibi H, Khodarahmi R, Effective suppression of the modified PHF6 peptide/1N4R Tau amyloid aggregation by intact curcumin, not its degradation products: another evidence for the pigment as preventive/therapeutic “functional food, Int. J. Biol. Macromol. 120 (Pt A) (2018) 1009–1022. [DOI] [PubMed] [Google Scholar]
Associated Data
This section collects any data citations, data availability statements, or supplementary materials included in this article.
Supplementary Materials
Data Availability Statement
The datasets generated during and/or analyzed during the current study are available in the present article.