

Abstract
The aim of this study was to describe pressure ulcer prevalence and prevention interventions in hospital care in Sweden based on nationwide surveys conducted over a 10‐year period. All Swedish hospitals were invited to participate in annual pressure ulcer prevalence surveys during the period 2011–2020. The data collection protocols included gender, age, skin assessment, risk assessment, and preventive interventions. In total, more than 130,000 patients were included in the ten prevalence surveys. The prevalence of pressure ulcers in Swedish hospital patients decreased significantly from 17.0 %to 11.4% between 2011 and 2020 and hospital‐acquired pressure ulcers decreased from 8.1% to 6.4% between 2018 and 2020. There was no significant decline in medicaldevice‐related pressure ulcers during the same period. The proportion of patients who were risk and skin assessed increased, as did the use of pressure‐reducing mattresses, sliding sheets, heel protection, and nrepositioning plans. This study shows that the implementation of a national patient safety program has had an impact on the nationwide prevalence of pressure ulcers in hospital care and the occurrence of prevention strategies. However, one in ten patients in Swedish hospitals still suffers from pressure ulcers. Further improvements can be made.
Keywords: hospital, point prevalence, pressure ulcer, prevention, Sweden
1. BACKGROUND
A pressure ulcer (PU) brings great suffering to those affected and high costs to society. 1 , 2 PUs are often avoidable and are thus regarded as preventable adverse events and as such, a quality indicator for healthcare. 3 Measuring and monitoring the prevalence or incidence of PUs in hospital patients is, therefore, an important part of strategic patient safety work and has become a key focus for many healthcare institutions around the world. 4 , 5 , 6
PUs are defined as a localised area of tissue damage, usually, over a bony prominence, that is a result of direct pressure and/or shearing forces. Both pressure and shear deform soft tissue and may result in cell death due to the deformation itself or ischemia that deformation creates in the long term. 7 Patients at risk of PUs are a heterogeneous group with reduced activity and mobility being the main risk factor. 8 The first step in PU prevention is identifying patients who are at risk. The second step is to reliably implement prevention strategies for all at‐risk patients. The risk identification process uses a structured risk assessment, including skin assessment, and is a well‐established approach. 4 For patients identified as being “at risk”, evidence‐based interventions involving pressure‐distributing or relieving mattresses and pillows as well as regular repositioning and mobilisation are implemented. However, implementing PU prevention interventions has proved to be complex with a number of challenges needing to be overcome in order to succeed and the nursing managers' attitude and engagement are crucial to enable healthcare personnel to work actively with PU prevention. 9
In 2008, the Swedish Association of Local Authorities and Regions (SALAR) launched a national patient safety initiative that had PUs as one of several prioritised areas (Table 1). Evidence‐based clinical guidelines were developed and distributed throughout the country. Timely a new law, the Patient Safety Act 2010:659 was launched in Sweden. 10 For follow‐up and to increase awareness of PUs, SALAR also initiated nationwide PU prevalence surveys starting in 2011 and PU becomes a national quality indicator. SALAR has since 2011 been responsible for the national database of the surveys and to present the annual national results on www.skr.se for open comparison between regions. The next year, SALAR and the Swedish government agreed on further improvements to be made in the patient safety programme for the period 2012–2014. Regions that began to measure the prevalence of PUs and other identified areas, establish action plans and goals based on recommended strategies, and delivered mandatory annual patient safety reports, received funding. The annual results of the overall patient safety work were illustrated on a map of Sweden that was distributed by SALAR for transparency and to enable open comparison between regions (Figure 1). The economic compensation linked to achievement was ended in 2014 but strategic activities continued nationally with the goal of identifying success factors to prevent PUs. 8 Simultaneously, a network of regional chief physicians and a patient safety development manager from each region were convened by SALAR four times annually to discuss patient safety work. Participants in this network were also the ones who organised prevalence measurements in each region. In 2018 the new international pressure ulcer classification system was implemented through web‐based video education and pressure ulcer cards distributed to the participant hospitals.
TABLE 1.
Pressure ulcer classification system used in the data collection
| Category | 2011–2018 | 2019–2020 | |
|---|---|---|---|
| I | Non‐blanchable erythema of intact skin | X | X |
| II | Partial thickness skin loss or blister | X | X |
| III | Full‐thickness skin loss | X | X |
| IV | Full‐thickness tissue loss | X | X |
| Unstageable: | Depth unknown because slough and/or eschar covers the ulcer base | X | |
| Suspected deep tissue injury: | Depth unknown. Purple or maroon area of discoloured intact skin or blood‐filled blister due to damage of underlying soft tissue from pressure and/or shear | X | |
FIGURE 1.
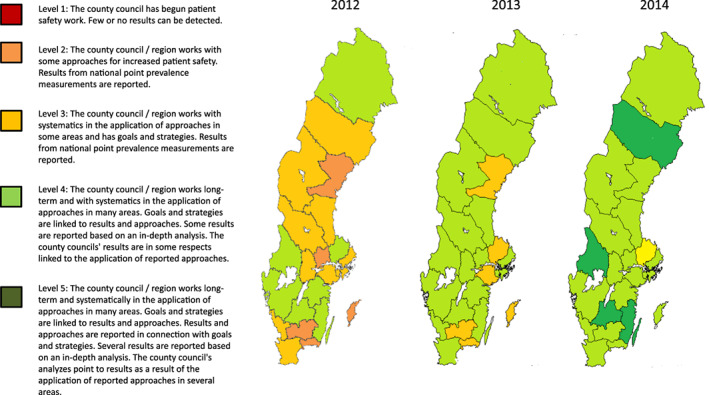
The annual results between 2012 and 2014 of the overall patient safety work illustrated on a map of Sweden
Although two publications from the three first surveys have been published, 11 , 12 Sweden now has annual PU prevalence data between 2011 and 2020 which provides a unique opportunity to evaluate long‐term national efforts in quality improvement of PU prevention. Increased knowledge of the impact of a long‐term national investment in this area is of both national and international interest. The aim of this study was to describe PU prevalence and prevention interventions in hospital care in Sweden, based on nationwide surveys over a 10‐year period.
2. METHOD
2.1. A cross‐sectional research design using annual surveys was used
2.1.1. Context
All hospitals in Sweden were invited to participate in the PU prevalence surveys between 2011 and 2020. Sweden is divided into 21 regions, previously called county councils, that are responsible for organising the healthcare in university hospitals (n = 7), central county council hospitals (n = approximately 20), and county hospitals (n = approximately 50) so that all citizens have access to good and equal care. Nurses in Sweden have a bachelor's degree in nursing. They are mainly responsible for nursing care and work together in teams with enrolled nurses. Approximately 85% of the healthcare system is funded through taxation, while patient and other fees account for the remaining 15%. Between 2011 and 2020, the population of Sweden increased from 9.4 million to 10.3 million, and life expectancy increased by 1.5 and 1.1 years for men and women respectively (http://scb.se). In 2019, the mean life expectancy was 81.3 years for men and 84.7 years for women. In line with these figures, health spending per capita increased from USD 4484 in 2011 to USD 5447 in 2018. 13 During the same period, the transition from inpatient care to more municipal health care continued, which resulted in a reduction of hospital beds from 2.7/1000 inhabitants to 2.2/1000 inhabitants.
2.1.2. Data collection
PU survey data in each participating unit were collected for one specific week in March 2011–2020. The hospitals were free to choose a day within this specified week. The methodology used has been developed by the EPUAP and consists of a uniform, well‐described, tested procedure which was followed from start. 14 , 15 All protocols used over the years included patient data such as gender, age, skin assessment, risk assessment, and preventive interventions they had been part of at the time of the survey. The preventive interventions that were inventoried were the type of mattress and seat cushion in use, heel protection, sliding sheets, and repositioning intervals while in bed and seated. In 2016, information about hospital‐acquired PUs (HAPU) was added, in 2017 medical device‐related PUs (MDR PU) were added, and in 2019 the categories “Unstageable PU” and “Suspect Deep tissue injury (SDTI)” were added.
Inclusion criteria were all adults (≥18 years) who were admitted to the unit before 7 am on the day of each survey. PUs were identified by visual skin assessment of the patients. Existing PUs were categorised according to the EPUAP–NPIAP‐PPPIA classification system (see Table 1).
If patients had more than one PU, the most severe PU was recorded. The risk assessment of the patients was carried out using the Modified Norton scale (MNS), which is commonly used in Sweden. 16 The MNS consists of seven variables to assess and score: mental condition, physical activity, mobility, food intake, fluid intake, incontinence, and general physical condition. The maximum score is 28 and patients with a total score of ≤20 were considered to be at risk of developing a PU.
2.1.3. Introduction of prevalence surveys
SALAR organised the national surveys and encouraged all hospitals to participate. An expert group, including three of the authors (A.H, L.G and C.B) and professionals well‐known in the field of PU prevalence studies, was put together to plan the procedure and define the survey data. Furthermore, the expert group organised education sessions together with SALAR for appointed local supervisors in hospitals throughout Sweden. Education sessions included general information about the survey and theoretical training and instructions on how to use a web‐based educational programme in PU classification 17 (PUCLAS 2). These were organised by the expert group before the first PU prevalence survey was carried out in March 2011. The education session and all information were accessible on the SALAR website (http://www.skr.se) for the remaining PU surveys.
2.1.4. Procedure in the hospitals
Hospital supervisors organised the survey and education sessions for the teams of nurses responsible for data collection for all ten PU surveys carried out during the period 2011–2020. Data were collected primarily by two nurses visiting each patient; one registered nurse who was a team member and one nurse from another unit in order to guarantee objectivity. These two nurses did a visual skin assessment of the patient together. Furthermore, data on skin and risk assessment on admission to the hospital were collected from medical records. Data were entered digitally into the national database at SALAR by each hospital's participating staff members.
2.1.5. Data analysis
All data were extracted from the national database by SALAR. For the analysis of mattresses, pressure‐relieving and pressure‐reducing mattresses were combined, making a dichotomous variable. Descriptive analysis of the characteristics of demographics, PUs, and preventive interventions are presented by frequency and percentage. Changes in year‐to‐year prevalence were compared using Chi‐square analysis and changes in age were compared using an independent t‐test. 18 The years chosen for comparison were 2011 (the start of the survey), 2014 (the final year of government funding), 2017 (medical device‐related PUs, were introduced), and 2020 (the final year of the survey). A level of P < .05 was considered as statistically significant. To rule out that differences in pressure ulcer prevalence were not due to differences in sample between years, the following covariates were controlled for in a logistic regression model; age, gender, at risk for PU and been in hospital more than 24 hours. 18 , 19
2.1.6. Ethics
All regions and directors approved the prevalence surveys and SALAR approved the disclosure of data for this study (Dnr.19/01615). The evaluation of the project was approved by the local ethical review board (Dnr. 2020/453). All principles set out in the Declaration of Helsinki, as well as the national and local ethical guidelines for research, were followed. Patients received verbal and written information about the study and gave verbal consent to participate. Relatives were consulted in some cases, for example, if the participant had dementia. Participation was voluntary and all data were kept confidential at SALAR.
3. RESULTS
In total, more than 130 000 patients were included in the 10 prevalence surveys between 2011 and 2020. The number of patients 70 years or older ranged from 57.0%–62.9%. Women were more highly represented in all years except 2019 and 2020. Between 18.7% and 22.1% of the patients were considered to be at risk of developing PUs according to MNS scores (see Table 2).
TABLE 2.
Patient characteristics
| Hospitals | 2011 | 2012 | 2013 | 2014 | 2015 | 2016 | 2017 | 2018 | 2019 | 2020 |
|---|---|---|---|---|---|---|---|---|---|---|
| n = 71 | n = 62 | n = 70 | n = 70 | n = 79 | n = 74 | n = 65 | n = 65 | n = 61 | n = 61 | |
| Patients, n | 14 257 | 12 146 | 13 719 | 13 540 | 14 269 | 13 660 | 13 713 | 12 624 | 11 962 | 11 358 |
| Gender | ||||||||||
| Female, n (%) | 7475 (52.4) | 6377 (52.5) | 7260 (52.9) | 6984 (51.6) | 7432 (52.1) | 7003 (51.3) | 7112 (51.9) | 6321 (50.1) | 5952 (49.8) | 5646 (49.7) |
| Male, n (%) | 6782 (47.6) | 5769 (47.5) | 6459 (47.1) | 6556 (48.4) | 6837 (47.9) | 6657 (48.7) | 6601 (48.1) | 6303 (49.9) | 6010 (50.2) | 5712 (50.3) |
| .156 a | .641 b | .001 c | ||||||||
| Mean age, years (SD) | 69.1 (18.0) | 69.9 (17.7) | 69.6 (17.7) | 69.2 (18.0) | 70.6 (18.0) | 70.5 (17.8) | 70.2 (18.2) | 71.9 (16.9) | 70.3 (17.8) | 70.4 (17.7) |
| .691 d | <.001 e | .342 f | ||||||||
| Years, n (%) | ||||||||||
| 18–60 years | 3648 (26.6) | 2917 (24.0) | 3411 (24.9) | 3469 (25.6) | 3280 (23.9) | 3101 (22.8) | 3262 (23.8) | 2520 (20.0) | 2760 (23.1) | 2637 (23.2) |
| 61–69 years | 2479 (17.4) | 1960 (16.1) | 2308 (16.8) | 2205 (16.3) | 2167 (15.2) | 2061 (15.1) | 2003 (14.6) | 1831 (14.5) | 1709 (14.3) | 1570 (13.8) |
| 70–79 years | 3307 (23.2) | 2967 (24.4) | 3294 (24.0) | 3329 (24.6) | 3538 (24.8) | 3527 (25.9) | 3564 (26.0) | 3477 (27.5) | 3284 (27.5) | 3196 (28.1) |
| ≥ 80 years | 4823 (33.8) | 4302 (35.4) | 4706 (34.3) | 4537 (33.5) | 5284 (37.0) | 4932 (36.2) | 4884 (35.6) | 4796 (38.0) | 4209 (35.2) | 3955 (34.8) |
| Patients with MNS score ≤ 20, n (%) | 2672 (18.7) | 2387 (19.6) | 2657 (19.4) | 2448 (18.1) | 2799 (19.6) | 2722 (19.9) | 2735 (22.1) | 2789 (22.1) | 2363 (19.8) | 2300 (20.3) |
| .155 a | <.001 b | .548 c | ||||||||
| Subscales from MNS: | ||||||||||
| Physical activity ≤2p | 2771 (19.4) | 2401 (19.8) | 2701 (19.7) | 2523 (18.6) | 2765 (19.4) | 2688 (19.7) | 2696 (19.7) | 2674 (21.2) | 2336 (19.5) | 2243 (19.7) |
| Mobility ≤2p | 2161 (15.1) | 1900 (15.6) | 2070 (15.1) | 1938 (14.3) | 2158 (15.1) | 2146 (15.7) | 2153 (15.7) | 2167 (17.2) | 1865 (15.6) | 1842 (16.2) |
| In hospital ≥24 hours | 11 759 (82.5) | 9954 (82.0) | 11 366 (82.8) | 11 247 (83.1) | 11 812 (82.8) | 11 392 (83.4) | 11 479 (83.7) | 10 444 (82.7) | 9796 (81.9) | 9263 (81.6) |
| .196 a | .153 b | <.001 c | ||||||||
Abbreviation: MNS, Modified Norton scale.
χ2 test between 2011 and 2014.
χ2 test between 2014 and 2017.
χ2 test between 2017 and 2020.
Independent t‐test between 2011 and 2014.
Independent t‐test between 2014 and 2017.
Independent t‐test between 2017 and 2020.
3.1. PU prevalence and locations
PU prevalence in hospital patients decreased significantly between 2011 and 2014 – from 17.0% to 13.9% – was unchanged between 2014 and 2017 and decreased further from 13.9% to 11.4% between 2017 and 2020 (see Table 3 and Figure 2). A significant decrease in HAPUs was seen between 2017 and 2020 with prevalence decreasing from 8.1% to 6.4%. However, there was no significant decline in medical device‐related PUs during the same period. The majority of PUs were located on the sacrum and heels (62.9%–67.9%).
TABLE 3.
Prevalence and locations of pressure ulcers
| Hospitals | 2011 | 2012 | 2013 | 2014 | 2015 | 2016 | 2017 | 2018 | 2019 | 2020 |
|---|---|---|---|---|---|---|---|---|---|---|
| n = 71 | n = 62 | n = 70 | n = 70 | n = 79 | n = 74 | n = 65 | n = 65 | n = 61 | n = 61 | |
| Patients, n | 14 257 | 12 146 | 13 719 | 13 540 | 14 269 | 13 660 | 13 713 | 12 624 | 11 962 | 11 358 |
| All patients with PU, n (%) | 2425 (17.0) | 1946 (16.0) | 2060 (15.0) | 1886 (13.9) | 1968 (13.8) | 1873 (13.7) | 1895 (13.8) | 1810 (14.3) | 1452 (12.1) | 1292 (11.4) |
| P‐value | <.001 a | .679 b | <.001 c | |||||||
| Odds Ratio (CI %) d | 0.771 (0.718; 0.827) | 0.92 (0.855; 0.99) | 0.778 (0.718; 0.843) | |||||||
| Patients with PU stage II or higher, n (%) | 1203 (8.4) | 964 (7.9) | 1003 (7.3) | 911 (6.7) | 1006 (7.1) | 980 (7.2) | 972 (7.1) | 985 (7.8) | 814 (6.8) | 762 (6.7) |
| P‐value | <.001 a | .255 b | .260 c | |||||||
| Patients wiht HAPU, n (%) | 1008 (9.1) | 929 (8.1) | 910 (8.7) | 693 (7.1) | 589 (6.4) | |||||
| P‐value | <.001 c | |||||||||
| Patients with HAPU stage II or higher, n (%) | 418 (3.7) | 399 (3.5) | 433 (4.1) | 334 (3.4) | 290 (3.1) | |||||
| P‐value | .168 c | |||||||||
| Patients with MDRPU, n (%) | 132 (1.0) | 154 (1.2) | 116 (1.0) | 94 (0.8) | ||||||
| P‐value | .233 c | |||||||||
| Uncertenity if PU was MDRPU, n (%) | 464 (3.4) | 259 (2.1) | 248 (2.1) | 163 (1.4) | ||||||
| P‐value | <.001 c | |||||||||
| Location | ||||||||||
| Sacrum, n (%) | 826 (34.1) | 707 (36.6) | 816 (39.6) | 733 (38.9) | 838 (42.6) | 810 (43.2) | 859 (45.3) | 796 (44.0) | 632 (43.5) | 589 (45.6) |
| Heel, n (%) | 719 (29.6) | 511 (26.3) | 525 (25.5) | 510 (27.0) | 478 (24.3) | 428 (22.9) | 428 (22.6) | 405 (22.4) | 325 (22.4) | 256 (19.8) |
| Foot, n (%) | 61 (2.5) | 69 (3.5) | 64 (3.1) | 54 (2.9) | 73 (3.7) | 153 (8.2) | 162 (8.5) | 167 (9.2) | 135 (9.3) | 102 (7.9) |
| Hip, n (%) | 77 (3.2) | 56 (2.9) | 59 (2.9) | 59 (3.1) | 67 (3.4) | 65 (3.5) | 57 (3.0) | 53 (2.9) | 36 (2.5) | 42 (3.3) |
| Ishial Tuberosity, n (%) | 335 (13.8) | 278 (14.3) | 291 (14.1) | 241 (12.8) | 237 (12.0) | 63 (3.4) | 50 (2.6) | 45 (2.5) | 38 (2.6) | 52 (4.0) |
| Ear, n (%) | 254 (10.5) | 213 (10.9) | 199 (9.7) | 184 (9.8) | 173 (8.8) | 104 (5.6) | 99 (5.2) | 95 (5.2) | 71 (4.9) | 73 (5.7) |
| Other, n (%) | 153 (6.3) | 112 (5.8) | 106 (5.1) | 105 (5.6) | 102 (5.2) | 250 (13.3) | 240 (12.7) | 249 (13.8) | 215 (14.8) | 178 (13.8) |
Abbreviations: PU, Pressure ulcer; HAPU, Hospital Aquired Pressure Ulcer; MDRPU, Medical Device Related Pressure Ulcer.
χ2 test between 2011 and 2014.
χ2 test between 2014 and 2017.
χ2 test between 2017 and 2020.
Odds ratio controlled for covariates in a logistic regression model; age, gender, at risk for PU and been in hospital more than 24 hour.
FIGURE 2.
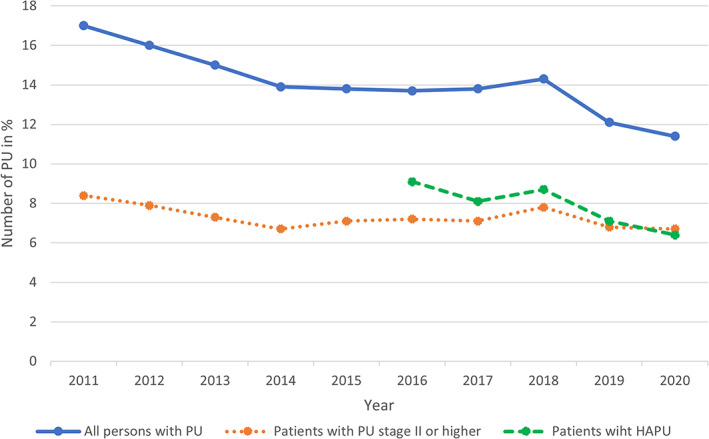
The prevalence of pressure ulcers (PU), pressure ulcers stage II or higher and hospital acquired pressure ulcers (HAPU) over the years 2011 to 2020
3.2. Assessment and prevention interventions
The number of patients who were risk and skin assessed within 24 hours of hospital admittance increased over the years from 14.1 respectively 32.4% in 2011 to 51.1 respectively 70.2% in 2020 (see Table 4). Regarding prevention interventions, 74.4% of patients at risk of developing a PU received a pressure‐reducing mattress in 2011 with this figure increasing to 96.2% in 2020. The proportion of pressure‐reducing mattresses used for patients who already had a PU increased correspondingly between 2011 and 2020. Of those deemed to be at risk of PU development, 47.0% of patients had a documented turning schedule in 2011. This prevention strategy increased significantly to 58.4% in 2020. Of those patients who already had a PU, this increased from 32.6% in 2011 to 49.5% in 2020.
TABLE 4.
Pressure ulcer prevention interventions
| Hospitals | 2011 | 2012 | 2013 | 2014 | 2015 | 2016 | 2017 | 2018 | 2019 | 2020 |
|---|---|---|---|---|---|---|---|---|---|---|
| n = 71 | n = 62 | n = 70 | n = 70 | n = 79 | n = 74 | n = 65 | n = 65 | n = 61 | n = 61 | |
| Patients, n | 14 257 | 12 146 | 13 719 | 13 540 | 14 269 | 13 660 | 13 713 | 12 624 | 11 962 | 11 358 |
| Risk assessed within 24 h, n (%) | 1662 (14.1) | 2472 (24.8) | 3574 (31.4) | 3783 (33.6) | 4691 (39.7) | 5139 (46.5) | 5121 (44.6) | 5020 (48.1) | 4959 (50.6) | 4732 (51.1) |
| P‐value | <.001 a | <.001 b | <.001 c | |||||||
| Skin assessed within 24 h, n (%) | 3805 (32.4) | 4183 (42.0) | 5504 (48.4) | 5934 (52.8) | 6641 (56.2) | 6988 (61.3) | 7300 (63.6) | 6941 (66.5) | 6679 (68.2) | 6504 (70.2) |
| P‐value | <.001 a | <.001 b | <.001 c | |||||||
| Preventive intervention among patients at risk: | ||||||||||
| Pressure reducing mattress, n (%) | 1997 (74.7) | 1862 (78.1) | 2170 (81.6) | 2100 (85.8) | 2507 (89.6) | 2590 (95.1) | 2529 (92.5) | 2635 (94.5) | 2273 (96.2) | 2213 (96.2) |
| P‐value | <.001 a | <.001 b | <.001 c | |||||||
| Heel protection, n (%) | 843 (31.5) | 731 (30.6) | 811 (30.5) | 872 (35.6) | 947 (33.8) | 983 (36.1) | 965 (35.3) | 1043 (37.4) | 932 (39.5) | 886 (38.5) |
| P‐value | .002 a | .800 b | .018 c | |||||||
| Pressure‐reducing chair cushions, n (%) | 264 (9.9) | 241 (10.1) | 253 (9.5) | 242 (9.9) | 287 (10.3) | 307 (11.3) | 305 (11.2) | 276 (9.9) | 268 (11.3) | 274 (11.9) |
| P‐value | .995 a | .139 b | .399 c | |||||||
| Sliding sheets, n (%) | 657 (24.6) | 680 (28.5) | 674 (25.4) | 703 (28.7) | 806 (28.8) | 873 (32.1) | 853 (31.2) | 970 (34.8) | 917 (38.8) | 838 (36.4) |
| P‐value | .001 a | .053 b | <.001 c | |||||||
| Other equipment, n (%) | 207 (7.7) | 153 (6.4) | 149 (5.6) | 230 (9.4) | 259 (9.3) | 238 (8.7) | 271 (9.9) | 358 (12.8) | 289 (12.2) | 305 (13.3) |
| P‐value | .035 a | .533 b | <.001 c | |||||||
| Planned repositioning in bed, n (%) | 1257 (47.0) | 1140 (47.8) | 1205 (45.4) | 1245 (50.9) | 1414 (50.5) | 1422 (52.2) | 1439 (52.6) | 1479 (53.0) | 1307 (55.3) | 1343 (58.4) |
| P‐value | .006 a | .206 b | <.001 c | |||||||
| Prevention interventions among patients with PU: | ||||||||||
| Pressure reducing mattress, n (%) | 1723 (71.1) | 1447 (74.4) | 1618 (78.5) | 1574 (83.5) | 1717 (87.2) | 1775 (94.8) | 1724 (91.0) | 1669 (92.2) | 1383 (95.2) | 1228 (95.0) |
| P‐value | <.001 a | <.001 b | <.001 c | |||||||
| Heel protection, n (%) | 718 (29.6) | 578 (29.7) | 620 (30.1) | 651 (34.5) | 661 (33.6) | 695 (37.1) | 669 (35.3) | 652 (36.0) | 571 (39.3) | 500 (38.7) |
| P‐value | .001 a | .612 b | .051 c | |||||||
| Pressure‐reducing chair cushions, n (%) | 236 (9.7) | 205 (10.5) | 205 (10.0) | 190 (10.1) | 234 (11.9) | 217 (11.6) | 245 (12.9) | 193 (10.7) | 193 (13.3) | 172 (13.3) |
| P‐value | .709 a | .006 b | .752 c | |||||||
| Sliding sheets, n (%) | 458 (18.9) | 417 (21.4) | 422 (20.5) | 414 (22.0) | 445 (22.6) | 470 (25.1) | 478 (25.2) | 463 (25.6) | 457 (31.5) | 399 (30.9) |
| P‐value | .013 a | .018 b | <.001 c | |||||||
| Other equipment, n (%) | 175 (7.2) | 113 (5.8) | 122 (5.9) | 184 (9.8) | 190 (9.7) | 182 (9.7) | 151 (8.0) | 199 (11.0) | 156 (10.7) | 184 (14.2) |
| P‐value | .003 a | .053 b | <.001 c | |||||||
| Planned repositioning in bed, n (%) | 790 (32.6) | 702 (36.1) | 751 (36.5) | 766 (40.6) | 861 (43.8) | 860 (45.9) | 865 (45.6) | 838 (46.3) | 706 (48.6) | 640 (49.5) |
| P‐value | <.001 a | .002 b | .031 c |
χ2 test between 2011 and 2014.
χ2 test between 2014 and 2017.
χ2 test between 2017 and 2020.
4. DISCUSSION
The aim of this study was to describe the prevalence and prevention interventions for PUs in hospital care in Sweden, based on nationwide surveys over a 10‐year period. This study shows that the implementation of a national patient‐safety program has had an impact on PU prevalence and the occurrence of prevention strategies. Within 10 years, PU prevalence in hospitalised patients decreased from 17.0% to 11.4%, while preventive measures such as the use of pressure‐reducing mattresses, sliding sheets, heel protection, and repositioning plans increased. The proportion of patients that were risk and skin assessed also increased. Although reported improvements may have been influenced by other factors and forms of bias, it is plausible that several factors at least in part are a result of the national patient safety programme. These and other factors will be discussed below, mainly reflectively, based on the WHO's framework of strategies for improving healthcare quality in Europe. 20
Firstly, the annual national PU prevalence surveys have been important. They have drawn attention to PUs as adverse events and helped maintain awareness of the importance of their prevention. 9 In addition, the repeated surveys have provided information on progress by making comparison with previous years possible, which may have encouraged professionals to change their clinical practices when needed. To audit and give feedback in this way is a key strategy for improving healthcare quality. 21 , 22 , 23 Furthermore, the final results of the prevalence measurements are publicly reported making open comparisons between Swedish regions and hospitals possible. The public reporting of indicators of both outcome (PU) and process (preventive nursing interventions) has plausibly also served as a motivator for change. 21 , 24 However, decision‐makers, including policymakers, managers, clinicians, and patients, should be aware that the main outcome (prevalence) includes all PUs, not only HAPUs, which are a more valid quality indicator of hospital care than prevalence alone. 25 That HAPUs were added to the protocol in 2016 was therefore valuable. In congruence with overall prevalence, HAPUs also decreased over the years, indicating that change took place not only in healthcare outside of hospitals but also within the hospitals.
Secondly, the implementation of the overall patient safety program (see Figure 1 and Table 1) was followed up and linked to funding during the period 2011 to 2014. As discussed above, the transparent presentation of progress against “expected” levels may have served as stimulus and motivated the hospitals to improve. In Sweden, “pay for quality” seemed to serve as a successful factor starting point despite evidence of the effectiveness of “pay for quality” schemes being deficient in comparison to other quality improvement initiatives. 26 However, our study found that national results further improved after funding ended in 2014. The subsequent follow‐up activities post 2014 that continued to be coordinated by SALAR almost certainly played a major role as did the Patient Safety Act 2010:659 that was passed in 2011. 10
Thirdly, evidence‐based guidelines for PU prevention were provided by SALAR in 2008, which may also have been an important part of the improved quality. 26 , 27 , 28 , 29 Well‐developed guidelines based on scientific evidence have the potential of influencing care outcomes if they are effectively disseminated and implemented. 30 The guidelines provided by SALAR were disseminated nationwide and the results of the present study confirm that the recommendations in the guidelines were gradually implemented. The guidelines highlight the importance of skin and risk assessment and mandatory nursing interventions for patients at risk of developing a PU or who already have a PU, including application for support surface, heel protection, and an individual regular planned repositioning schedule while in bed or sitting in a chair. Nutritional support and skin care were also included in the guidelines but were not followed up in the prevalence surveys. Of the evaluated interventions in the present study, only the use of pressure‐reducing mattresses reached nearly 100% of patients, followed by skin assessment that reached approximately 70%. Considerably fewer patients both at risk of and with PUs received heel protection, pressure‐reducing seat cushions, sliding sheets, or other preventative equipment in 2020. If these interventions had had a higher rate of use, PU prevalence may have been even lower.
So how do Sweden's results compare to other countries? Comparable data are presented by Li et al, 31 who state a pooled global prevalence of PUs is 12.8% and HAPUs is 8.4%. Like Sweden, the global prevalence of PUs has decreased significantly over the last two decades with a 0.7% drop annually in overall PU prevalence and a 1.0% drop annually for HAPUs. In the USA, for instance, the prevalence of PUs declined over a 10‐year period (2006–2015) from 13.5% to 9.3%, with HAPUs declining from 6.2% to 3.4%. 32 This reduction has been attributed to the national “pay for performance” model related to HAPUs.
This study found that the implementation of the national patient safety program has had a positive impact on PU prevalence but that factors at organisational level have probably also been of significance. Factors such as work environment and culture, managers' engagement, staff knowledge and attitudes, and access to appropriate equipment and resources can all have acted as enablers and barriers. 4 , 33 , 34 It would be interesting to analyse patient safety reports submitted by the regions over this period and compare the initiatives carried out in relation to PU outcomes.
4.1. Limitations
A structured and evidence‐based approach to prevention can be ensured only if nurse managers make it sure that access to appropriate equipment for beds and chairs are readily available.
This study has a number of limitations that are worth mentioning. Not all hospitals took part in all ten surveys, which may have influenced the results. However, the sample size did not vary much over the years, and the decrease in the number of participating patients from 2011 to 2020 can also be dependent on the reduction of hospital beds (Table 4).
It would have been interesting to compare outcomes in different care settings, but reorganisations of departments during the ten‐year study period made such a comparison difficult.
In 2016, a new database was introduced by SALAR and this seems to have affected the data of PU location (foot, ischial tuberosity, ears, and “other”). The data seem to have switched place when entered into the new database. Unfortunately, it could not be determined which of the locations had switched. Therefore, we decided not to change anything in the dataset and consequently no statistical comparisons were made with these data. Due to this, conclusions based on the PU location data must be made with caution.
5. CONCLUSION
This study demonstrates that the implementation of a national patient safety program has had a positive impact on the nationwide PU prevalence and occurrence of prevention strategies. In the 10‐year period of the study, PU prevalence has decreased while preventive measures have increased. The national patient safety program, which addresses PUs, seems to have been successful in engaging leadership and health care staff to work systematically with PU prevention and measurements. The passing of the Patient Safety Act in 2010 and SALAR's patient safety program including strategies such as measuring the healthcare quality, developing clinical practice guidelines, “pay for quality”, and public reporting for open comparison may have served as facilitators at a national level. However, the burden of PUs remains substantial in Swedish hospital in‐patient care indicating that the need to continue to dedicate resources to PU prevention remains.
CONFLICT OF INTEREST
The authors declare no conflict of interest.
ACKNOWLEDGEMENTS
We would like to extend our appreciation to Agneta Andersson, Patient Safety Officer at the Swedish Association of Local Authorities and Regions, for her collaboration over the 10 years.
Källman U, Hommel A, Borgstedt Risberg M, Gunningberg L, Sving E, Bååth C. Pressure ulcer prevalence and prevention interventions – A ten‐year nationwide survey in Sweden. Int Wound J. 2022;19(7):1736‐1747. doi: 10.1111/iwj.13779
Funding information We have conducted this research as part of our positions at the Södra Älvsborgs Hospital, Malmö University, Region Östergötland, Uppsala University, Region Gävleborg, and Karlstad University Sweden & Östfold University College, Norway. In addition, the first author has been financially supported by Sparbanken Sjuhärads foundation for research at Södra Älvsborg Hospital, Sweden.
DATA AVAILABILITY STATEMENT
The data that support the findings of this study are available from the corresponding author upon reasonable request.
REFERENCES
- 1. Demarré L, Van Lancker A, Van Hecke A, et al. The cost of prevention and treatment of pressure ulcers: A systematic review. Int J Nurs Stud. 2015;52(11):1754‐1774. [DOI] [PubMed] [Google Scholar]
- 2. Gorecki C, Brown JM, Nelson EA, et al. Impact of pressure ulcers on quality of life in older patients: A systematic review: clinical investigations. J Am Geriatr Soc. 2009;57(7):1175‐1183. [DOI] [PubMed] [Google Scholar]
- 3. Gunningberg L, Sving E, Hommel A, Ålenius C, Wiger P, Bååth C. Tracking pressure injuries as adverse events: national use of the global trigger tool over a 4‐year period. J Eval Clin Pract. 2019;25(1):21‐27. [DOI] [PubMed] [Google Scholar]
- 4. EPUAP/NPUAP & PPPIA . Prevention and Treatment of Pressure Ulcers/Injuries: Clinical Practice Guideline: European Pressure Ulcer Advisory Panel, National Pressure Injury Advisory Panel and Pan Pacific Pressure Injury. Alliance; EPUAP/NPIAP/PPPIA; 2019. [Google Scholar]
- 5. Improvement IoH . Pressure Ulcer: Institute of Healthcare Improvment; Accessed 17 June from: http://www.ihi.org/Topics/PressureUlcers/Pages/default.aspx.
- 6. Comission CE . Pressure injury prevention Australia. Accessed 17 June from: http://www.cec.health.nsw.gov.au/keep‐patients‐safe/pressure‐injury.
- 7. Leopold E, Gefen A. Changes in permeability of the plasma membrane of myoblasts to fluorescent dyes with different molecular masses under sustained uniaxial stretching. Med Eng Phys. 2013;35(5):601‐607. [DOI] [PubMed] [Google Scholar]
- 8. Coleman S, Gorecki C, Nelson EA, et al. Patient risk factors for pressure ulcer development: systematic review. Int J Nurs Stud. 2013;50(7):974‐1003. [DOI] [PubMed] [Google Scholar]
- 9. Hommel A, Gunningberg L, Idvall E, Bååth C. Successful factors to prevent pressure ulcers ‐ an interview study. J Clin Nurs. 2017;26(1–2):182‐189. [DOI] [PubMed] [Google Scholar]
- 10. SFS . Patient Safety Act (2010:659). The Riksdag, Stockholm, Sweden, https://www.riksdagen.se/sv/dokument‐lagar/dokument/svensk‐forfattningssamling/patientsakerhetslag‐2010659_sfs‐2010‐659 [cited February 9, 2022]
- 11. Gunningberg L, Hommel A, Baath C, Idvall E. The first national pressure ulcer prevalence survey in county council and municipality settings in Sweden. J Eval Clin Pract. 2013;19:862‐867. [DOI] [PubMed] [Google Scholar]
- 12. Baath C, Gunningberg L, Idvall E, Hommel A. Pressure‐reducing interventions among persons with pressure ulcers: results from the three national pressure ulcer prevalence surveys in Sweden. J Eval Clin Pract. 2014;20:56‐65. [DOI] [PubMed] [Google Scholar]
- 13. OECD . Health spending https://data.oecd.org/healthres/health-spending.htm: Organisation for Economic Co‐operation and Development (OECD); 2020 [cited February 9, 2022].
- 14. Vanderwee K, Clark M, Dealey C, Gunningberg L, Defloor T. Pressure ulcer prevalence in Europe: a pilot study. J Eval Clin Pract. 2007;13(2):227‐235. [DOI] [PubMed] [Google Scholar]
- 15. Gunningberg L, Carlsson S, Williman A. EPUAP‐protocol‐ a European method to survey pressure ulcers. Vård i Norden. 2006;26(2):48‐51. [Google Scholar]
- 16. Ek AC, Bjurulf P. Interrater variability in a modified Norton scale. Scand J Caring Sci. 1987;1(3–4):99‐102. [DOI] [PubMed] [Google Scholar]
- 17. Beeckman D, Schoonhoven L, Boucqué H, Van Maele G, Defloor T. Pressure ulcers: e‐learning to improve classification by nurses and nursing students. J Clin Nurs. 2008;17(13):1697‐1707. [DOI] [PubMed] [Google Scholar]
- 18. Field A. Discovering statistics using SPSS. Third edition, SAGE Publications, London, England, s. 821.
- 19. Pallant J. A step by step guide to data analysis using IBM SPSS – SPSS survival manual. Fifth edition. Open University Press, McGraw Hill, Berkshire, England, s. 354.
- 20. Improving healthcare quality in Europe ‐ Characteristics, effectiveness and implementation of different strategies [Internet]. Ed. Busse R, Klazinga N, Panteli D, Quentin W, European Observatory on Health Systems and Policies. European Observatory Health Policy Series, 2019; 53. Copenhagen, Danemark. [PubMed]
- 21. Smith P, Mossialos E, Papanicolas I. Principles of performance measurement. Performance measurement for health system improvement: experiences, challenges and prospects. Copenhagen, Danmark: WHO Regional Office for Europe; 2008. [Google Scholar]
- 22. Barbazza E, Klazinga NS, Kringos DS. Exploring the actionability of healthcare performance indicators for quality of care: a qualitative analysis of the literature, expert opinion and user experience. BMJ Qual Saf. 2021;30:1010–1020. [DOI] [PMC free article] [PubMed] [Google Scholar]
- 23. Sving E, Högman M, Mamhidir AG, Gunningberg L. Getting evidence‐based pressure ulcer prevention into practice: a multi‐faceted unit‐tailored intervention in a hospital setting. Int Wound J. 2016;13(5):645‐654. [DOI] [PMC free article] [PubMed] [Google Scholar]
- 24. Jamtvedt G, Flottorp S, Ivers N. Audit and feedback as a quality strategy. In: Busse R, Klazinga NS, Panteli D, Quentin W, eds. Improving Healthcare Quality in Europe ‐ Characteristics, Effectiveness and Implementation of Different Strategies. Copenhagen, Denmark: WHO regional office for Europe and OECD; 2019. [PubMed] [Google Scholar]
- 25. Gunningberg L, Donaldson N, Aydin C, Idvall E. Exploring variation in pressure ulcer prevalence in Sweden and the USA: benchmarking in action. J Eval Clin Pract. 2011;18(4):904‐910. [DOI] [PubMed] [Google Scholar]
- 26. Eckhardt H, Smith P, Quentin W. Pay for quality: using financial incentives to improve quality of care. In: Busse R, Klazinga N, Panteli D, Quentin W, eds. Improving Healthcare Quality in Europe ‐ Characteristics, Effectiveness and Implementation of Different Strategies. Copenhagen, Denmark: WHO regional office for Europe and OECD; 2019. [PubMed] [Google Scholar]
- 27. Tayyib N, Coyer F, Lewis PA. A two‐arm cluster randomized control trial to determine the effectiveness of a pressure ulcer prevention bundle for critically ill patients. J Nurs Scholarsh. 2015;47(3):237‐247. [DOI] [PubMed] [Google Scholar]
- 28. Anderson M, Finch Guthrie P, Kraft W, Reicks P, Skay C, Beal AL. Universal pressure ulcer prevention bundle with WOC nurse support. J Woun Ostom Contin Nurs. 2015;42(3):217‐225. [DOI] [PubMed] [Google Scholar]
- 29. Al‐Otaibi YK, Al‐Nowaiser N, Rahman A. Reducing hospital‐acquired pressure injuries. BMJ Open Qual. 2019;8(1):e000464. [DOI] [PMC free article] [PubMed] [Google Scholar]
- 30. Panteli D, Legido‐Quigley H, Reichebner C, Ollenschläger G, Schäfer C, Busse R. Clinical practice guidelines as a quality strategy. In: Busse R, Klazinga N, Panteli D, Quentin W, eds. Improving Healthcare Quality in Europe Characteristics, Effectiveness and Implementation of Different Strategies. Copenhagen, Denmark: WHO regional office for Europe and OECD; 2019. [PubMed] [Google Scholar]
- 31. Li Z, Lin F, Thalib L, Chaboyer W. Global prevalence and incidence of pressure injuries in hospitalised adult patients: A systematic review and meta‐analysis. Int J Nurs Stud. 2020;105:103546. [DOI] [PubMed] [Google Scholar]
- 32. VanGilder C, Lachenbruch C, Algrim‐Boyle C, Meyer S. The international pressure ulcer prevalence™ survey: 2006–2015: A 10‐year pressure injury prevalence and demographic trend analysis by care setting. J Woun Ostom Contin Nurs. 2017;44(1):20‐28. [DOI] [PubMed] [Google Scholar]
- 33. Baernholdt M, Yan G, Hinton ID, Cramer E, Dunton N. Effect of preventive care interventions on pressure ulcer rates in a national sample of rural and urban nursing units: longitudinal associations over 4 years. Int J Nurs Stud. 2020;105:103455. [DOI] [PMC free article] [PubMed] [Google Scholar]
- 34. Lahmann NA, Halfens RJ, Dassen T. Impact of prevention structures and processes on pressure ulcer prevalence in nursing homes and acute‐care hospitals. J Eval Clin Pract. 2010;16(1):50‐56. [DOI] [PubMed] [Google Scholar]
Associated Data
This section collects any data citations, data availability statements, or supplementary materials included in this article.
Data Availability Statement
The data that support the findings of this study are available from the corresponding author upon reasonable request.