Abstract
We investigated the usefulness of oxygen nano‐bubble water as an oxygen‐rich liquid for wound healing, by analysing its effect on the wound‐healing process in rats. Sprague‐Dawley rats (n = 36) were divided into two groups: the wound‐healing model group without ischaemia (n = 18) and the ischaemic group (n = 18). In each rat, an 8 mm diameter full‐thickness skin defect wound was created on the back; in rats in the ischaemic group, a bi‐pedicle flap (width, 3.6 cm; length, 8.6 cm) was also created. The wounds of six rats from each group were then treated with AQUACELL soaked with oxygen nano‐bubble water, and compared with those of control rats, which were treated with purified water (same as that used to make the oxygen nano‐bubble water; n = 6) or physiological saline solution (n = 6). There was no significant difference in epithelialisation rate and number of days of epithelialisation among the subgroups in the wound‐healing model group. In the ischaemic group, there was a significant improvement in the wound‐healing rate and time of the oxygen nano‐bubble water subgroup. Oxygen nano‐bubble water therapy enhances the ischaemic wound‐healing process.
Keywords: animal model, oxygen nano‐bubble, wound healing
1. INTRODUCTION
In general, wounds recover relatively soon after they occur. However, in clinical practice, the healing process is affected by various factors, such as diabetes, pressure ulcers, radiation injuries, peripheral vascular diseases, and venous stasis diseases. These factors can cause blood vessel damage, as well as a low supply and high demand for oxygen, leading to hypoxia, which in turn results in delayed healing by decreasing a wound's natural antibacterial response and slowing the rate of contraction, epithelialisation, and collagen synthesis. 1 , 2 Most chronic wounds have varying degrees of local tissue ischaemia secondary to scars, fibrin cuffs, increased venous pressure owing to oedema and venous stasis, pressure of pressure ulcers, arteriolar disease, and oedema of diabetic ulcers. With a rapid increase in the number of patients with the aforementioned conditions, there is an increasing number of people who have chronic ischaemic wounds. 3 Oxygen is a key factor for wound healing, and the state of wound oxygenation is known to be a key determinant of healing outcomes. 4
Nano‐bubble water refers to water with a large number of nanoscale particle bubbles. In this study, we aimed to analyse the effects of oxygen therapy on wound healing in humans. If the association between oxygenation and wound healing observed in animals can be applied to humans, this may lead to a method to assist efficient wound healing in humans. In fact, a previous study has proposed that drinking oxygen nano‐bubble water (O2NBW) has an immunostimulatory effect. 5
Oxygen therapy for wound healing has a long history, and multiple roles of oxygen therapy in wound healing have been clarified. The clinical application of oxygen therapy began in the 1960s. 6 There are two widely used methods of oxygen‐based therapies, namely, hyperbaric oxygen therapy (HBOT) and topical oxygen therapy (TOT). HBOT is used in many facilities and is known to be effective. Compared with HBOT, TOT is an experimental stage. a variety of TOT methodologies were developed to provide more effective external oxygen delivery. Among them, experiments on micro/nanobubbles as TOT have been conducted, and there are documents showing its effectiveness in wound healing. 7 Therefore, we aimed to clarify the effects of O2NBW as TOT on wound healing in a rat model.
2. MATERIALS AND METHODS
Thirty‐six female Sprague‐Dawley rats (CLEA Japan, Inc.) with a mean weight of 230.6 ± 44.1 g were housed in a temperature‐controlled room under a standardised 12 hours:12 hours light‐dark cycle at Tokyo Medical University Experimental Animal Centre. The rats were provided with free access to food pellets and drinking water. This study was approved by the Ethics Committee for Animal Experimentation of Tokyo Medical University, Japan.
Rats were anaesthetised by an intraperitoneal injection of a mixture of medetomidine (0.375 mg/kg body weight [BW]), midazolam (2.0 mg/kg BW), and butorphanol (2.5 mg/kg BW) (0.5 mL/100 g BW in total). The rats were then put in the supine position on an animal experiment table, and then the hair on their backs was shaved, and sterilised with 70% ethanol.
The rats (n = 36) were divided into two groups, that is, the wound‐healing model group without ischaemia (n = 18) and the ischaemic wound model group (n = 18). In each group, an 8‐mm diameter full‐thickness skin defect wound was created on the back of the rats with a hole puncher (Kai disposable dermal biopsy punch 8 mm), and for the ischaemic group, a skin bi‐pedicle flap with a width of 3.6 cm and a length of 8.6 cm was additionally created on the dorsal skin of the rats, by raising the skin from the iliac crest to the scapular tip by sharp dissection using scissors. A silicon membrane that was adjusted to the flap size was placed beneath the flap to prevent neovascularisation (blood flow) from the wound bed. The flap was fixed in situ to the surrounding wound edge by a 3 M Precise Multi‐Shot Disposable Skin stapler (3M, Japan) (Figures 1 and 2).
FIGURE 1.
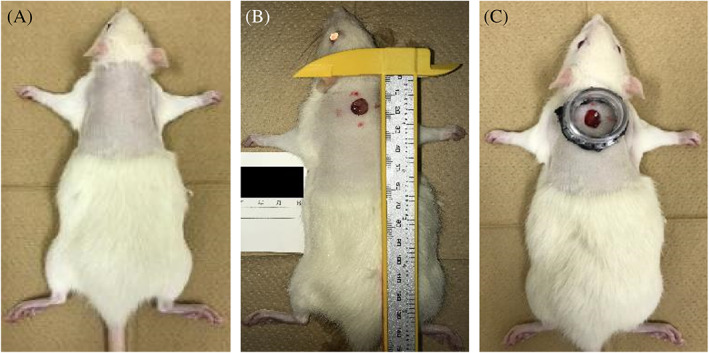
Procedure for creating the wound model. A, After anaesthesia, the hair on their back was shaved, and sterilised with 70% ethanol. B, An 8‐mm diameter full‐thickness skin defect wound was created on the back of the rats with a hole puncher (Kai disposable dermal biopsy punch 8 mm). C, The full‐thickness skin defect wound was to attached a polyethylene terephthalate bottle tap cut by electric heating saw (ILOHAS, natural mineral water, Coca‐Cola, Japan) with double‐sided tape (3M, Japan) to keep the tension of the surrounding skin constant
FIGURE 2.
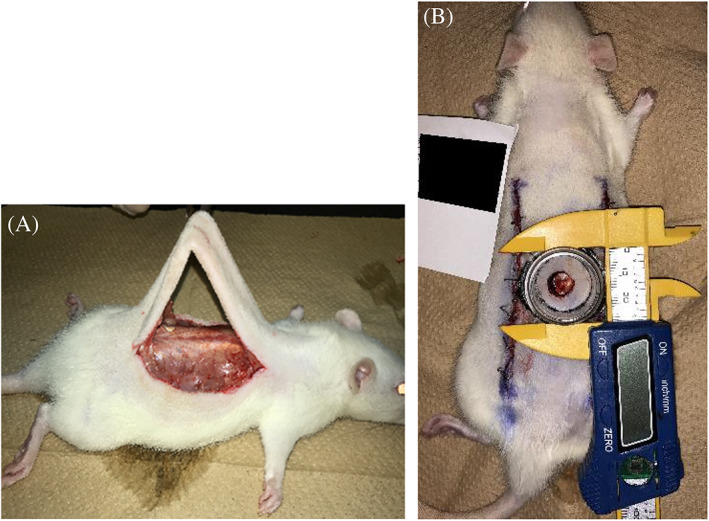
Procedure for creating the ischaemic wound model group. A, A skin bi‐pedicle flap with a width of 3.6 cm and a length of 8.6 cm was additionally created on the dorsal skin of the rats, by raising the skin from the iliac crest to the scapular tip by sharp dissection using scissors. B, A silicon membrane adjusted to the flap size as placed beneath the flap as a barrier to prevent neovascularisation from the wound bed perturbing the flap
A full‐thickness skin defect wound was created by attaching the mouth of a polyethylene terephthalate bottle cut using an electric heating saw (ILOHAS, natural mineral water, Coca‐Cola, Japan) with double‐sided tape (3M, Japan) to keep the tension of the surrounding skin constant (Figures 1 and 2). This makes it possible to prevent the wound area from drying out, and enables the test solutions described below to constantly contact the wound surface.
Three test solutions were used, namely, three types of O2NBW (REO Institution, Inc., Sendai, Japan 8 ), purified water (REO Institution, Inc., Sendai, Japan), and physiological saline solution (Otsuka Pharmaceutical Factory, Inc., Japan). It can be seen that both the O2NBW and the purified water have an average size of about 113 nm. The O2NBW contains oxygen as nanobubbles. The O2NBW contains a concentration of around 3.24e ± 008 particles/mL, while the purified water contains only a concentration of around 3.67e ± 006 particles/mL. From this, it can be seen that the O2NBW contains nearly 100 times the particle concentration (Figures 3 and 4).
FIGURE 3.
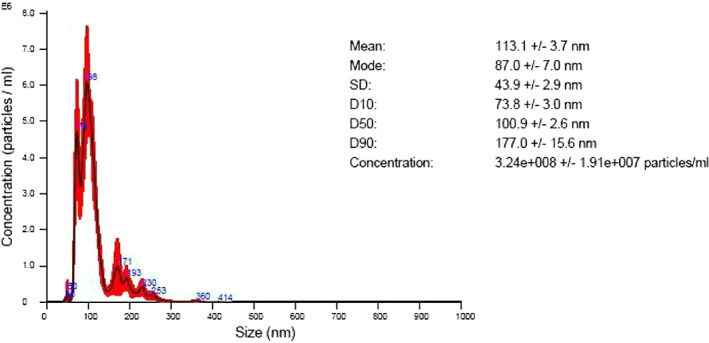
Concentration of the particles of the oxygen nano‐bubble water (O2NBW); REO Institution, Inc, Sendai, Japan. A, Particle size distribution chart = average of 5 measurements. B, Vertical axis = particle concentration (number of particles × 10*/mL)/horizontal axis = particle size (nm). C, Red colour = mean error
FIGURE 4.

Concentration of the particles of purified water; REO Institution, Inc, Sendai, Japan. A, Particle size distribution chart = average of 5 measurements. B, Vertical axis = particle concentration (number of particles × 10*/mL)/horizontal axis = particle size (nm). C, Red colour = mean error
The back wounds of six rats from each group were treated with AQUACELL (Conva Tec, Japan) soaked with O2NBW, and compared with wounds of control rats that were treated with purified water (n = 6 for each group), and physiological saline solution (n = 6 for each group) (Figure 5).
FIGURE 5.
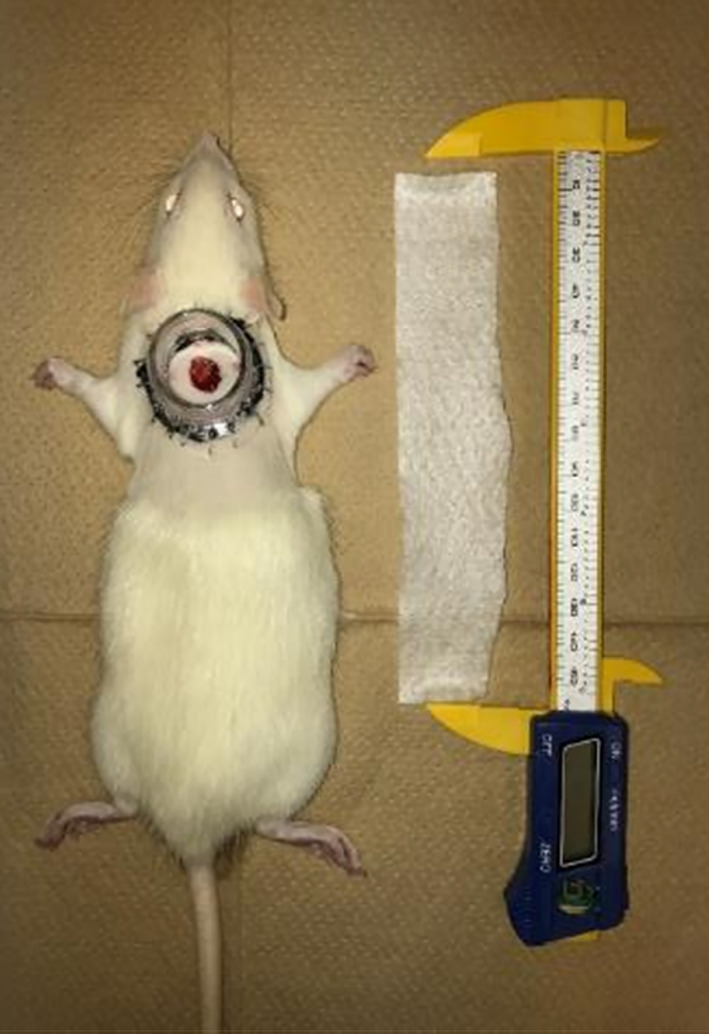
AQUACELL is used for wound dressing soaked with test solution
The day of wound creation was designated as day 0, and wound‐healing rates and wound‐healing times were analysed. The wound was checked and the wound dressing was replaced on days 3, 6, 9, 11, 13, 15, and 17.
Wound‐healing rate is the most direct indicator for the assessment of wound healing. On days 3, 6, 9, 11, 13, 15, 17, and 19 after treatment, the wounds were photographed with a camera, and Image J software was used to measure the wound area and calculate the wound‐healing rate. The formula used was as follows: wound‐healing rate = (initial wound area − area at a particular time point)/initial wound area × 100. The wound was defined as being healed when the wound‐healing rate was greater than 95%.
The same experiment was repeated using female Sprague‐Dawley rats with an average BW of 275.6 ± 24.9 g, (the wound‐healing model: n = 6; the ischaemic wound model: n = 6), and the wound from 1 rat from each group was sampled on day 6. Furthermore, on day 13, the wound from 1 rat in the ischaemic wound model group was sampled. The wound area and a small amount of normal skin around the wound were removed and put in 10% neutral buffer formalin. Wound healing was analysed by haematoxylin and eosin (HE) and van Gieson (VG) staining.
Data were analysed using EZR software (version 1.41), and results were expressed as the mean ± SD. In the wound‐healing model group, the differences in wound‐healing rates were analysed by a variance analysis of the repeated measurements. A P < .05 (*) was considered to indicate a statistically significant difference between groups.
3. RESULTS
A comparison of the changes in wound size at each time point in the wound‐healing model group demonstrated that there was no significant difference in epithelialisation rates and number of days of epithelialisation between the O2NBW subgroup, the purified water subgroup, and the physiological saline solution subgroup. In all treatment groups, obvious growth of granulation tissue was observed on days 3 to 6, and it was milky white to pink, soft, moist, and prone to bleeding. Obvious wound epithelialisation was observed on days 6 to 9. Wound areas were clearly decreased on days 9 to 11. Then, the wound healed on days 9 to 13. There were no cases of wound infection that delayed wounds were found in any of the test solutions (Figure 6, Table 1).
FIGURE 6.
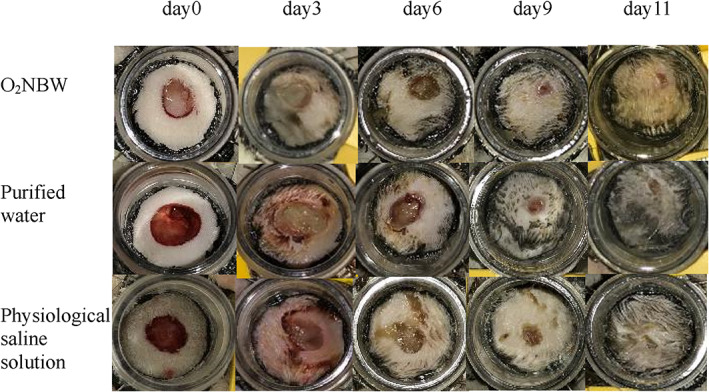
Time‐dependent wound healing in the rat's back wound‐healing model
TABLE 1.
Wound‐healing times among the different treatment subgroups in the wound‐healing model group (unit: day)
| Wound‐healing model group | Healing time |
|---|---|
| O2NBW | 11.3 ± 0.8 |
| Purified water | 10.3 ± 1.0 |
| Physiological saline solution | 11.7 ± 1.0 |
Note: Values are presented as the mean ± SD. Tested by independent‐samples t‐test (*P < .05; **P < .01).
In the ischaemic model group, granulation tissue grew more slowly than in the wound‐healing group, and there were differences in the epithelialisation rates and the number of days of epithelialisation among the O2NBW subgroup, the purified water subgroup, and the physiological saline solution subgroup. In the O2NBW subgroup, the growth of granulation tissue was visible on days 6 to 11, and occurred from the wound margin, and a lack of tissue remained in the central part of the wound. Growth of granulation tissue was also visible on days 9 to 15 in the purified water subgroup and the physiological saline solution subgroup. In the O2NBW subgroup, the wound showed obvious epithelialisation on days 9 to 11 compared with on days 9 to 15 in the purified water subgroup and the physiological saline solution subgroup. Unlike in the wound‐healing model group, in the ischaemic model group, the wound had not completely contracted when final epithelialisation was confirmed in any of the test solution groups. Wound healing was more advanced in the O2NBW subgroup on days 11 to 13 compared with on days 13 to 19 in the purified water subgroup and the physiological saline solution subgroup. There were no cases of wound infection that delayed wounds were found in any of the test solutions (Figure 7, Table 2).
FIGURE 7.

Time‐dependent wound healing in the ischaemic rat's back wound‐healing model
TABLE 2.
Wound‐healing times among the different treatment subgroups in the ischaemic wound model group (unit: day)
| Ischaemic wound model group | Healing time |
|---|---|
| O2NBW | 11.7 ± 1.6** |
| Purified water | 16.3 ± 1.0 |
| Physiological saline solution | 16 ± 2.8 |
Note: Values are presented as the mean ± SD. Tested by independent‐samples t‐test (*P < .05; **P < 0.01).
In the wound‐healing model group, comparison of healing times demonstrated that there were no significant differences between the O2NBW subgroup and the other subgroups (Table 1). In addition, a comparison of wound‐healing rates demonstrated no significant differences between the O2NBW subgroup and the other subgroups (Table 3).
TABLE 3.
Wound‐healing rates among the different treatment subgroups in the wound‐healing model group (unit: %)
| Wound‐healing model group | Day 3 | Day 6 | Day 9 | Day 11 |
|---|---|---|---|---|
| O2NBW | 28.4 ± 6.3 | 55.7 ± 9.9 | 94.7 ± 5.7 | 99.9 ± 1.8 |
| Purified water | 32.0 ± 8.4 | 61.6 ± 7.6 | 94.9 ± 5.5 | 100 ± 0 |
| Psysiologiacal saline solution | 25.7 ± 6.5 | 53.4 ± 5.7 | 91.0 ± 2.5 | 98.4 ± 2.7 |
Note: Values are presented as the mean ± SD. Tested by independent‐samples t‐test (*P < .05; **P < .01).
In the ischaemic wound model group, a comparison of healing times demonstrated significant differences between the O2NBW subgroup and the other subgroups (**P < .01) (Table 2). In addition, a comparison of wound‐healing rates demonstrated significant differences between the O2NBW subgroup and the other subgroups (Table 4).
TABLE 4.
Wound‐healing rates among the different treatment subgroups in the ischaemic wound model group (unit: %)
| Ischaemic wound model group | Day 3 | Day 6 | Day 9 | Day 11 | Day 13 | Day 15 | Day 17 |
|---|---|---|---|---|---|---|---|
| O2NBW | 24.8 ± 7.0* | 53.7 ± 16.2* | 80.2 ± 12.6* | 96.9 ± 4.1** | 100 ± 0* | 100 ± 0 | 100 ± 0 |
| Purified water | 16.9 ± 6.7 | 34.3 ± 5.2 | 58.3 ± 7.8 | 71.1 ± 12.2 | 79.8 ± 11.8 | 92.6 ± 7.5 | 100 ± 0 |
| Psysiologiacal saline solution | 15.1 ± 4.9 | 30.1 ± 9.0 | 57.1 ± 12.6 | 69.4 ± 14.3 | 83.0 ± 16.8 | 93.0 ± 9.9 | 96.7 ± 6.2 |
Note: Values are presented as the mean ± SD. Tested by independent‐samples t‐test (*P < .05; **P < .01).
Regarding both model groups, the O2NBW subgroup demonstrated no differences in the number of days of epithelialisation. In other words, there was no difference in the number of days of epithelialisation between the wound‐healing model group and the ischaemic wound model group. Furthermore, when the same test was performed for the purified water subgroup and the physiological saline solution subgroup, a significant difference was found between the wound‐healing model group and the ischaemic wound model group.
In the ischaemic wound model group, the wound‐healing rates of the O2NBW subgroup showed significantly faster healing rates on days 3, 6, 9, 11, and 13 (Table 4). These results suggested that a large amount of oxygen accelerates wound healing compared with the control subgroups.
Analyses of tissue sections demonstrated that, in the wound‐healing model, new granulation tissue comprising collagen fibres and new blood vessels were formed in each test solution group on day 6. There was a large number of inflammatory cells in all test solution groups. Pathologically, no difference was observed among the different test solution groups in the wound‐healing model group (Figures 8 and 9).
FIGURE 8.
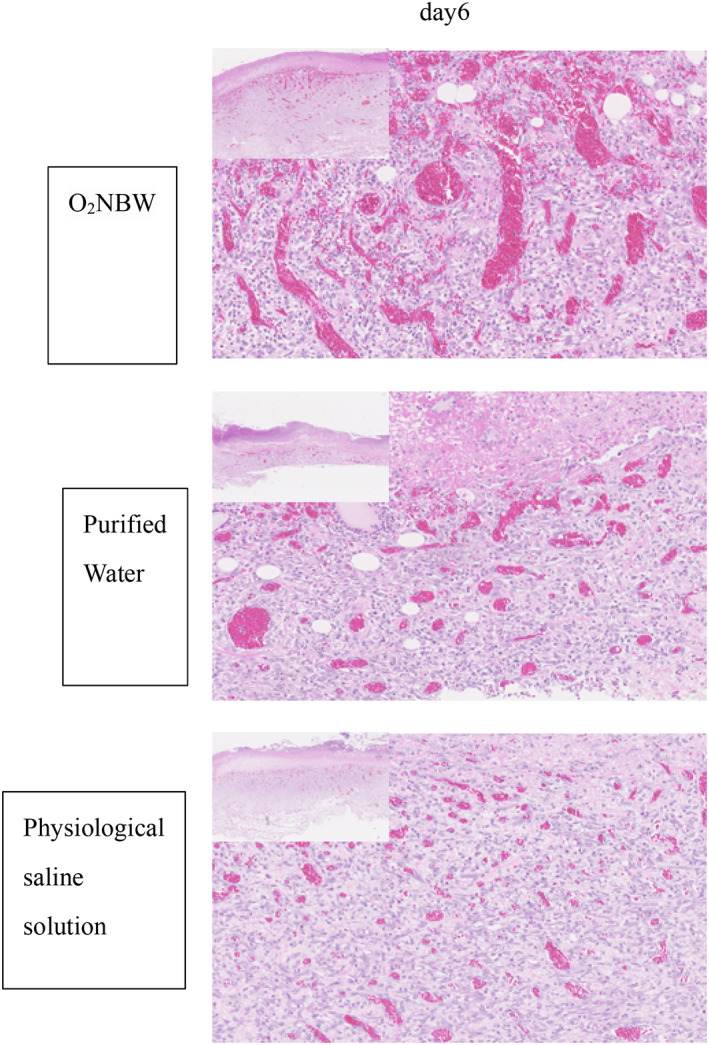
Wound‐healing model: HE staining on day 6 shows the growth of granulation tissue, with some small vessels and a large number of inflammatory cells in all test solution subgroups
FIGURE 9.
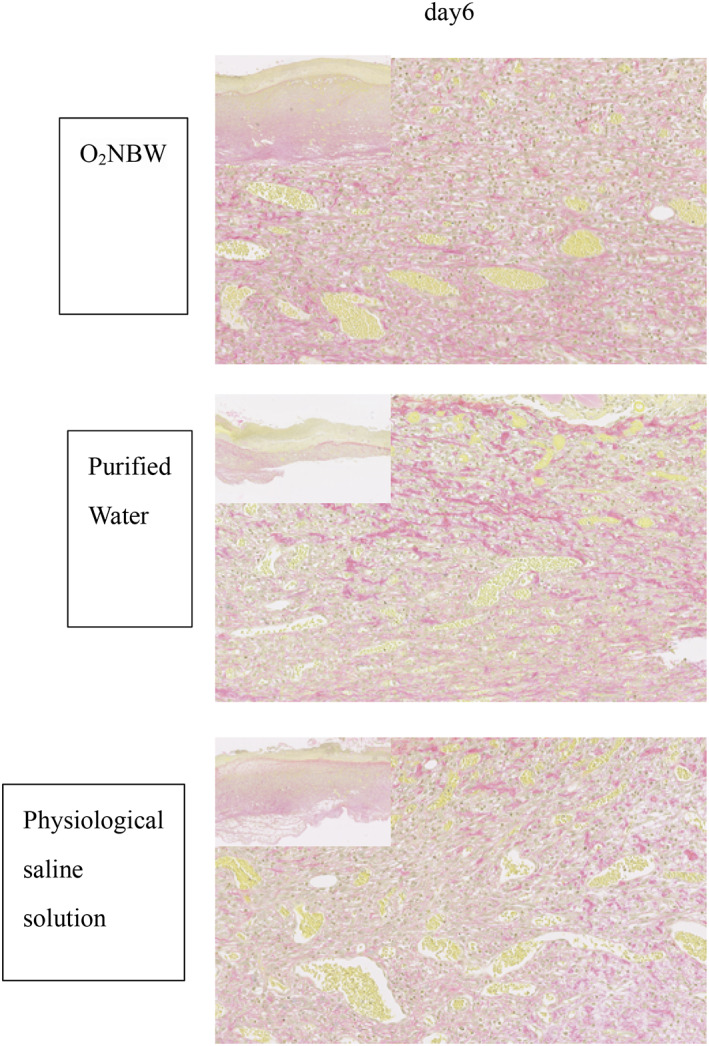
Wound‐healing model: VG staining of sections on day 6 shows collagen fibres and vessels growing in all test solution subgroups. A, The pathological image of low magnification shows a wound edge, and the boundary between normal tissue and repaired tissue can be clearly confirmed
In the ischaemic wound model group on day 6, almost no granulation tissue and inflammatory cell infiltration were observed in the normal tissue at the wound edge. On day 13, the wound was covered with repaired tissue and stratified squamous epithelium, which is evidence of epithelialisation. The ischaemic wound model group had more inflammatory cell infiltration than the wound‐healing model group, but there was not as much inflammatory cell infiltration in the O2NBW subgroup compared with the other solution subgroups in the ischaemic wound model group on day 13 (Figure 10).
FIGURE 10.
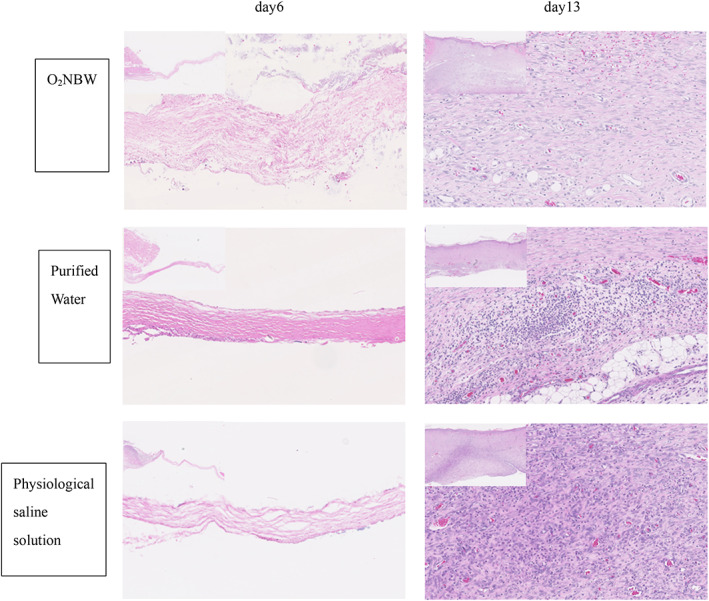
Ischaemic wound model: HE staining of sections on day 6 showed almost no growth of granulation tissue and no inflammatory cell infiltration in the normal tissue around the wound edges (left is normal tissue, right is repaired tissue) (left upper: ×40, ×200). On day 13, the wound is covered with repaired tissue and stratified squamous epithelium, which demonstrates epithelialisation. The infiltration of many inflammatory cells was found in the repaired tissue
In the ischaemic wound model group, consistent with the results of VG staining, there was a difference between the O2NBW subgroup and the purified water subgroup, as well as the physiological saline solution subgroup. In the O2NBW subgroup, collagen fibres were neatly arranged, and were thicker than in the other subgroups on day 6. In addition, there were many more collagen fibres and blood vessels in the O2NBW subgroup than in the other subgroups, but the structure was not integrated on day 13 (Figure 11).
FIGURE 11.
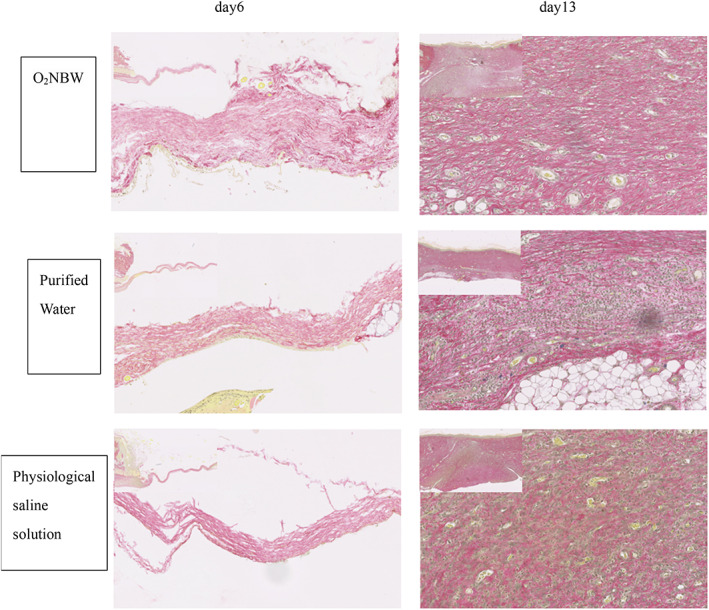
Ischaemic wound model: VG staining sections on day 6 showed almost no collagen fibres, but the collagen fibres in the O2NBW subgroup were neatly arranged, and thicker than those of the other subgroups (left is normal tissue, right is repaired tissue). On day 13, collagen fibres and new blood vessels were observed in all test solution subgroups, and there were many more collagen fibres and new blood vessels in the O2NBW subgroup than in the other subgroups
4. DISCUSSION
The aetiology of chronic wounds is multifactorial, and the most common factor is a change in the degree of hypoxia in the local wound tissue. It has been reported that a partial pressure of tissue oxygen of 5 to 20 mm Hg is found percutaneously in non‐healing chronic wounds, compared with normal tissue, which has a partial pressure of tissue oxygen of 30 to 50 mm Hg. 9 Hypoxia has substantial adverse effects on collagen deposition, angiogenesis, and bactericidal function. 10 , 11 Fibroblasts require oxygen for proliferative activity, and actively proliferating fibroblasts were found only in areas with an oxygen partial pressure of 15 mm Hg or higher. 12
Furthermore, it was found that neutrophils cannot kill bacteria when the oxygen partial pressure is less than 40 mm Hg. 13
The rat's back wound model was developed and used in our laboratory to study the effects of O2NBW in wound‐healing under normal and ischaemic conditions. This model enables the precise measurement of new granulation tissue formation and epithelialisation by constant contact of the wound surface with O2NBW, that is, by constantly supplying oxygen. By comparing this test solution with the purified water subgroup and the physiological saline subgroup, we analysed the formation of granulation tissue and the tendency of epithelialisation accurately both macroscopically and pathologically, to see if the TOT actually had an effect. The AQUACELL used in the experiments retained the test solution well, and none of the wounds dried out.
As can be seen from the number of days of epithelialisation in the two model groups; wound‐healing model and ischaemic model group, the effect of O2NBW was only observed in the ischaemic model group. In the wound‐healing model group, there was no significant difference in the epithelialisation rate and epithelialisation among the O2NBW subgroup, the purified water subgroup, and the saline subgroup. This shows that the use of O2NBW, that is, the supply of more oxygen, has no effect in promoting wound‐healing for wounds in which the wound itself is not in a chronic ischaemic state (wound‐healing model group). In other words, for wounds that are in an ischaemic state, O2NBW supplied more oxygen, which resulted in a favourable healing outcome.
On the other hand, in the ischaemia model group, the O2NBW subgroup had a significantly higher epithelialisation rate and a significantly shorter number of epithelialisation days than the purified water group and the physiological saline group. It is speculated that O2NBW was able to constantly supply oxygen to the wound.
From a histopathological point of view, in the ischaemic wound model group, the replacement of tissue defects with scars took a long time. However, the O2NBW subgroup of the ischaemic wound model group had less infiltration of inflammatory cells than the other test solution groups, and VG staining demonstrated that collagen fibres were neatly arranged in the O2NBW subgroup compared with the other test solution groups. From the fact that there were many collagen fibres and blood vessels, it is presumed that the oxygen supply by O2NBW was able to suppress the delay in wound‐healing to some extent.
From the above results, it is speculated that the TOT and O2NBW we created can promote the wound healing of ischaemic wounds. However, analysis of the effects of O2NBW was insufficient in our present study, as the oxygen concentration on the wound surface could not be measured, and cytological effects on the wound‐healing process by the use of O2NBW was not analysed. Measuring the oxygen concentration that is required for efficient wound healing will enable the development of more useful TOT methods.
In conclusion, an ischaemic wound model was used in rats to test the efficacy of O2NBW therapy. We found that O2NBW used in TOT can promote ischaemic wound healing by stimulating collagen deposition and angiogenesis. Owing to device limitations, wound oxygen levels during and after treatment could not be measured. Therefore, the most beneficial oxygen levels and means of maintaining oxygen balance at various stages of wound healing have not yet been determined and should be investigated in the future.
CONFLICT OF INTEREST
The authors declare that they have no conflict of interest.
ACKNOWLEDGMENT
This work was supported by JSPS KAKENHI Grant Number JP16K15754.
Aoki K, Ida Y, Fukushima N, Matsumura H. Topical application of oxygen nano‐bubble water enhances the healing process of ischaemic skin wound healing in an animal model. Int Wound J. 2022;19(7):1843‐1852. doi: 10.1111/iwj.13790
DATA AVAILABILITY STATEMENT
The data that support the findings of this study are available from the corresponding author, KA, upon reasonable request.
REFERENCES
- 1. Tandara AA, Mustoe TA. Oxygen in wound healing‐more than a nutrient. World J Surg. 2004;28:294‐300. [DOI] [PubMed] [Google Scholar]
- 2. Sen CK. Wound healing essentials let there be oxygen. Wound Repair Regen. 2009;17:1‐18. [DOI] [PMC free article] [PubMed] [Google Scholar]
- 3. Wu L, Xia YP, Roth SI, Gruskin E, Mustoe TA. Transforming growth factor‐betal fails to stimulate wound healing and impairs its signal transduction in an aged ischemic ulcer model: importance of oxygen and age. Am J Pathol. 1999;154:301‐309. [DOI] [PMC free article] [PubMed] [Google Scholar]
- 4. Leaper D. Perfusion, oxygenation and warming. Int Wound J. 2007;4:4‐8. [DOI] [PMC free article] [PubMed] [Google Scholar]
- 5. Suzuki N, Yamamoto K, Shiizuka K, Mano Y. Immunostimulating effects of oxygen nano‐bubble water on human body. Jpn J Hyperbar Undersea Med. 2012;47(3):93–98. [Google Scholar]
- 6. Hunt TK, Ellison EC, Sen CK. Oxygen: at the foundation of wound healing‐introduction. World J Surg. 2004;28:291‐293. [DOI] [PubMed] [Google Scholar]
- 7. Sayadi LR, Banyard DA, Ziegler ME, et al. Topical oxygen therapy & micro/nanobubbles: a new modality for tissue oxygen delivery. Int Wound J. 2018;15:363‐374. [DOI] [PMC free article] [PubMed] [Google Scholar]
- 8. Measurement result of the nanosite, particle/fine bubble measuring device. Leo institute Inc. [Google Scholar]
- 9. Sheffield PJ. Tissue oxygen measurements. In: Davis JC, Hunt TK, eds. Problem Wounds. The Role of Oxygen. New York, NY: Elsevier; 1988:17‐52. [Google Scholar]
- 10. Jonsson K, Jensen JA, Gooodson WH 3rd, et al. Tissue oxygenation, anemia, and perfusion in relation to wound healing in surgical patients. Ann Surg. 1991;214:605‐613. [DOI] [PMC free article] [PubMed] [Google Scholar]
- 11. Hopf HW, Hunt TK, West JM, et al. Wound tissue oxygen tension predicts the risk of wound infection in surgical patients. Arch Surg. 1997;132:997‐1004. discussion 105. [DOI] [PubMed] [Google Scholar]
- 12. Hopf HW, Humphrey LM, Puzziferri N, West JM, Attinger CE, Hunt TK. Adjuncts to preparing wounds for closure: hyperbaric oxygen, growth factors, skin substitutes, negative pressure wound therapy (vacuum‐assisted closure). Foot Ankle Clin. 2001;6:661‐682. [DOI] [PubMed] [Google Scholar]
- 13. Allen DB, Maguire JJ, Mahdavian M, et al. Wound hypoxia and acidosis limit neutrophil bacterial killing mechanisms. Arch Surg. 1997;132:991‐996. [DOI] [PubMed] [Google Scholar]
Associated Data
This section collects any data citations, data availability statements, or supplementary materials included in this article.
Data Availability Statement
The data that support the findings of this study are available from the corresponding author, KA, upon reasonable request.


