

Abstract
BACKGROUND:
Childhood maltreatment (CM) has long-term consequences for dysregulation of the immune system which is particularly pronounced when mental and physical health sequelae have manifested. Higher proinflammatory state has been shown in non-pregnant state in association with CM as well as with depression, one of the most frequent and pernicious psychiatric sequelae of CM. During pregnancy, however, this association is less clear. Given the important role of maternal inflammatory state during pregnancy for fetal, pregnancy, and birth outcomes, we sought to examine the association between CM and proinflammatory state during pregnancy considering the moderating role of maternal depressive symptoms characterized serially across pregnancy.
METHODS:
A prospective, longitudinal study of 180 healthy pregnant women was conducted with serial assessments in early (12.98 ± 1.71 weeks gestation), mid (20.53 ± 1.38 weeks gestation) and late (30.42 ± 1.4 weeks gestation) pregnancy. Maternal history of CM was assessed with the Childhood Trauma Questionnaire (CTQ) and the total score was used as an indicator of CM experience. Maternal depressive symptoms were assessed at each pregnancy visit with the Center for Epidemiologic Studies Depression Scale (CES-D). Serum concentrations of tumor necrosis factor (TNF)-α and interleukin (IL)-6 were obtained at each pregnancy visit and combined to a composite maternal proinflammatory score. Linear mixed effects models were employed to assess the association between CTQ score, CES-D score, and proinflammatory score during pregnancy, adjusting for potential confounders.
RESULTS:
Gestational age was associated with the proinflammatory score (B = .02; SE = .00; p < .001), indicating an increase in inflammation across gestation. Neither CTQ score nor depressive symptoms were independently associated with the proinflammatory score (ps > .28). However, the interaction between CTQ score and depressive symptoms was associated with the proinflammatory score (B = .03, SE = .01, p < .05), indicating higher inflammation across pregnancy with increasing levels of depressive symptoms during pregnancy in women with higher CTQ scores. Exploratory analyses suggested that this interaction was mainly driven by CTQ subscale scores assessing experiences of abuse rather than neglect.
CONCLUSIONS:
These findings suggest a moderating role of maternal depressive symptoms during pregnancy on the association of early life stress with inflammation and thus highlight the importance of the timely assessment of both CM exposure and depressive symptoms which might allow for the development of targeted and individualized interventions to impact inflammation during pregnancy and to ameliorate the detrimental long-term effects of CM. The current findings add to a better understanding of the prenatal biological pathways that may underlie intergenerational transmission of maternal CM.
Keywords: Childhood maltreatment, pregnancy, inflammation, depression
1. Introduction
Traumatic experiences during childhood and early adolescence are among the most pernicious stressors in society today. Childhood maltreatment (CM) constitutes a frequent and widespread condition associated with high numbers of unrecorded cases, significant interrelatedness of different types of adverse experiences, and high individual and societal cost [1–5]. The long-term psychiatric, social, behavioral and bio-physical health consequences of CM in the exposed individual are well established [6–8] and a growing body of evidence points to detrimental effects of maternal CM extending even to the next generation [9–19].
One potential mechanism in the development of the long-term health effects of CM is the dysregulation of the inflammatory system, particularly elevated peripheral levels of C-reactive protein (CRP), interleukin (IL)-6 and tumor necrosis factor (TNF)-α [20–25]. Furthermore, because elevated inflammation during pregnancy is associated with a variety of detrimental pregnancy, birth, and offspring health outcomes [26–38], it is likely to be a key pathway in the context of the intergenerational transmission of CM.
An association between CM and elevated inflammation has also been reported during pregnancy. However, there are some discrepancies in the literature, with some studies showing a direct effect of early life adversity on inflammatory markers during pregnancy [39–41], while others reported that the association between early life adversity and inflammation during pregnancy was moderated by additional current risk factors (e.g., poor nutrition, depression) [42]. Across studies that included more than one proinflammatory marker, no clear pattern emerges in terms of specific associations with CM, with some but not all studies showing positive associations between CM and CRP, IL-6 and TNF-α concentrations [43–46]. Inconsistencies across studies may emerge due to heterogeneity regarding types and time points of measurements of both inflammatory markers and CM, as well as regarding potential conditional effects explored. Prominent among potential moderators of the association between CM and inflammation are psychiatric symptoms, and especially depressive symptoms, as CM-associated inflammatory dysregulation in non-pregnant state appears to be particularly exacerbated among individuals who exhibit psychological symptomatology [47–51]. Despite this potential interactive impact of CM and depression on immune processes, empirical evidence on their combined effect during pregnancy is limited. To date, only two studies specifically tested the interactive effect of maternal depression and early life adversity on inflammation during pregnancy and support the premise of depression being a significant moderator of the association between CM and IL-6 concentrations [42, 43].
Based on these considerations, we hypothesize that the interaction of CM and depressive symptoms during pregnancy, is associated with elevated proinflammatory state during pregnancy. In order to conduct a conservative test of this hypothesis, we chose to conduct the current study in a low-risk population of healthy pregnant women not enriched for either severe CM or specific types of CM or high (clinical) levels of depression. We address previous discrepancies across studies in CM severity by measuring CM on a continuum in order to capture the wide spectrum of traumatic experience. We analyze the separate as well as interactive effects of CM and depressive symptoms, similarly measured on a continuum, as well as the main effect of depressive symptoms in women with vs. without moderate to severe CM. In order to address previous discrepancies in time points of measurements of depression and inflammation during pregnancy, we measured both depressive symptoms as well as inflammation serially in early, mid- and late pregnancy. We focus on proinflammatory cytokines TNF-α and IL-6 as markers of inflammation during pregnancy because both multifunctional cytokines are important in autocrine and paracrine processes during reproduction, including implantation, placentation, embryogenesis, and parturition [26, 52, 53] and are risk markers for major obstetric complications such as pregnancy loss and preterm delivery [27–31] – conditions that have been shown to be more prevalent among women exposed to CM [9–12]. Furthermore, both cytokines play an important role in fetal programming of disease susceptibility [54], as elevated levels during pregnancy are associated with a variety of developmental and health conditions in the offspring [32–37]. Thus, these cytokines are responsive to perturbation or adverse environmental conditions, are known to play obligatory roles in the initiation, maintenance and progression of normal gestation, fetal development, and birth, and thereby can mediate the effects of different intrauterine perturbations on fetal physiology [55]. We further add to the existing literature by aggregating measures of these major proinflammatory cytokines because the combination of these cytokines is representative of a systemic pro-inflammatory state.
2. Methods
2.1. Participants
The study was conducted at the University of California, Irvine in a socio-demographically diverse cohort of 248 pregnant women with singleton, intrauterine pregnancies and no known cord, placental, uterine anomalies or fetal congenital malformations, or any conditions known to be associated with dysregulated neuroendocrine function. Data on proinflammatory state (n = 58 missing), CM (n = 31 missing), depressive symptoms (n = 16 missing), and relevant covariates (n = 11 missing) were available for 180 participants. All following results are reported for these 180 participants. This subsample did not differ from the remaining 68 participants with regard to maternal age (p < .4), socio-economic status (p < .9), racial/ethnical background (ps > .17), pre-pregnancy BMI (p < .9), mean pregnancy CES-D score (p < .2), and CTQ total score (p < .4). Maternal sociodemographic characteristics of the women included in the current analyses as well as descriptive information on gestational age, infant weight and length at birth are provided in Table 1.
Table 1.
Frequencies, means and standard deviations of maternal characteristics and birth outcomes in the study sample.
| Maternal characteristic | N = 180 |
|---|---|
|
| |
| Maternal age in years (M ± SD) | 27.6 ± 5.2 |
| Highest level of formal education (n, %) | |
| High School or less | 40 (22.3) |
| Technical or Vocational School or Certificate | 22 (12.3) |
| College, no degree | 55 (30.7) |
| Associate Degree | 10 (5.6) |
| Bachelor’s Degree or higher | 52 (29.1) |
| Family income last year in USD (n, %) | |
| <15k | 13 (7.6) |
| 15–29k | 28 (16.5) |
| 30–49k | 34 (20) |
| 50–100k | 73 (42.9) |
| >100k | 22 (12.9) |
| Race/ethnicity (n, %) | |
| Non-Hispanic White | 72 (40) |
| Non-Hispanic Other | 24 (13.3) |
| Hispanic | 84 (46.7) |
| Life-time history of in-patient treatment for emotional conditions (n, %) | 8 (4.4) |
| Pharmacological treatment for anxiety/depression during pregnancy (n, %) | 3 (1.7) |
|
| |
| Parity (M ± SD) | 1 ± 1.1 |
| Pre-pregnancy BMI (M ± SD) | 26.4 ± 6.3 |
| Presence of any obstetric risk condition (n, %) | 30 (16.7) |
| Hypertension | 2 (1.1) |
| Diabetes | 3 (1.7) |
| Severe infections | 16 (8.9) |
| Anemia | 6 (3.3) |
| Vaginal Bleeding | 4 (2.2) |
|
| |
| Birth outcomes | n = 172 |
| Gestational age at delivery in weeks (M ± SD) | 39.35 ± 1.38 |
| Birth ≥ 37 weeks gestation (n, %) | 164 (95.3) |
| Birth weight in g (M ± SD) | 3364.89 ± 500.43 |
| Birth weight ≥ 2500 g (n, %) | 163 (94.8) |
| Birth length in cm (M ± SD) | 49.43 ± 4.78 |
|
| |
| Early pregnancy CES-D score (M ± SD) | 13.8 ± 9.0 |
| Mid-pregnancy CES-D score (M ± SD) | 12.5 ± 9.3 |
| Late pregnancy CES-D score (M ± SD) | 13.7 ± 9.0 |
| Mean pregnancy CES-D score (M ± SD) | 14.7 ± 8.0 |
| CES-D scores consistently above cut-off 16 (N, %) | 24 (13.3) |
| CES-D scores consistently above cut-off 201 (N, %) | 17 (9.4) |
|
| |
| Total CTQ score (M ± SD) | 36 ± 14.3 |
| Participants above moderate cut-off on any subscale (N, %) | 55 (30.6) |
| Emotional Abuse (EA) subscale score (M ± SD) | 7.6 ± 4 |
| Participants above moderate cut-off (13) (N, %) | 21 (11.7) |
| Physical Abuse (PA) subscale score (M ± SD) | 6.5 ± 3.3 |
| Participants above moderate cut-off (10) (N, %) | 18 (10) |
| Sexual Abuse (SA) subscale score (M ± SD) | 6.4 ± 4.1 |
| Participants above moderate cut-off (8) (N, %) | 26 (14.4) |
| Emotional Neglect (EN) subscale score (M ± SD) | 8.9 ± 3.9 |
| Participants above moderate cut-off (15) (N, %) | 20 (11.1) |
| Physical Neglect (PN) subscale score (M ± SD) | 6.6 ± 2.6 |
| Participants above moderate cut-off (10) (N, %) | 23 (12.8) |
|
| |
| Early pregnancy TNF-α (M ± SD) | 8.13 (3.64) |
| Early pregnancy TNF-α winsorized (M ± SD) | 8.11 (3.57) |
| Mid-pregnancy TNF-α (M ± SD) | 8.52 (3.89) |
| Mid-pregnancy TNF-α winsorized (M ± SD) | 8.48 (3.75) |
| Late pregnancy TNF-α | 9.02 (4.03) |
| Late pregnancy TNF-α winsorized (M ± SD) | 9.01 (3.97) |
| Early pregnancy IL-6 (M ± SD) | .79 (.84) |
| Early pregnancy IL-6 winsorized (M ± SD) | .75 (.52) |
| Mid-pregnancy IL-6 (M ± SD) | .87 (.83) |
| Mid-pregnancy IL-6 winsorized (M ± SD) | .85 (.67) |
| Late pregnancy IL-6 | 1.14 (1.05) |
| Late pregnancy IL-6 winsorized (M ± SD) | 1.02 (.59) |
Note. M = Mean; SD = standard deviation; BMI = Body-Mass-Index; CES-D = Center for Epidemiologic Studies – Depression Scale
a CES-D score of 20 or higher was used to indicate clinically relevant depressive symptoms in analyses [59]; CTQ = Childhood Trauma Questionnaire.
2.2. Procedures
The study employed a prospective, longitudinal design with serial assessments over the course of pregnancy. Study visits occurred up to a maximum of 3 times in early (M = 12.98, SD = 1.71 weeks gestation), mid (M = 20.53, SD = 1.38 weeks gestation) and late pregnancy (M = 30.42, SD = 1.4 weeks gestation) and included the administration of structured interviews and questionnaires and the collection of maternal venous blood samples. Blood draws were only conducted when participants did not present with acute infections. Gestational age was determined by best obstetric estimate with a combination of last menstrual period and early uterine size, and was confirmed by obstetric ultrasonographic biometry using standard clinical criteria [56]. All study procedures were approved by the UC Irvine Institutional Review Board, and all participants provided written informed consent.
2.3. Measures
Maternal childhood maltreatment.
Exposure to adverse experiences in childhood and adolescence were ascertained at mid-gestation using the Childhood Trauma Questionnaire [57]. This widely used instrument assesses five dimensions of CM in 25 items measuring answers ranging from 1 (“never true”) to 5 (“very often true”): emotional abuse (EA), physical abuse (PA), sexual abuse (SA), emotional neglect (EN), and physical neglect (PN). The total CTQ score, a sum score of all subscales ranging from 25 to 125 with higher scores indicating more severe CM experiences, was used as the predictor in statistical analyses. In order to elucidate whether different types of CM were differentially associated with prenatal inflammatory response, additional exploratory analyses were performed using the summary scores for each of the 5 subscales. Follow-up analyses were conducted in women with vs. without CM by means of a dichotomous CM variable based on cut-off values for at least moderate exposure on one of the subscales (EA ≥ 13, PA ≥ 10, SA ≥ 8, EN ≥ 15, and PN ≥ 10) [57] which categorized women without any moderate CM experience (CM-) and women with at least one moderate or severe experience (CM+).
Maternal depressive symptoms during pregnancy.
Depressive symptoms were assessed in early, mid- and late pregnancy using the 20-item Center for Epidemiological Studies Depression Scale (CES-D) [58]. CES-D total scores were calculated for all participants with 3 or fewer missing items. In case of missing items, mean scores for the completed items were calculated and multiplied by 20. This resulted in scores ranging from 0 to 60 for all participants with higher scores indicating greater depressive symptoms. These repeatedly-measured continuous CES-D scores were used as predictors in the statistical analyses. CES-D scores were available for 87.8% (158 participants) at all three time points, and for 12.2% (22 participants) at only two time points. Specifically, 92.8% (167 participants) provided CES-D data in early pregnancy, 96.1% (173 participants) in mid-pregnancy, and 98.9% (178 participants) in late pregnancy.
Maternal proinflammatory composite score (based on TNF-α, IL-6).
Concentrations of TNF-α and IL-6 were quantified in early, mid- and late pregnancy. Maternal antecubital venous blood samples (20 ml) were collected in serum tubes (BD Vacutainer) under sterile conditions. In order to control for potentially confounding effects of dietary intake on cytokine measurements, fasting blood samples were obtained from all participants. Blood samples were allowed to clot for 30 minutes at room temperature before being centrifuged at 4 °C at 1500 × g. Serum was then separated and stored at −80°. IL-6 concentrations were determined using a commercial high sensitivity ELISA (eBioscience) with a sensitivity of 0.03 pg/mL. The coefficient of variation (CV) for IL-6 measurements was 14%. TNF-α concentrations were quantified by means of a commercial Multiplex Bead-Based Kit (V-Plex Proinflammatory Pannel 1; 10-Plex, Milliplex MAP Human Cytokine/Chemokine Kit; Millipore, Billerica, MA, USA), which was administered according to the manufacturer’s kit-specific protocols with a sensitivity of 3.2 pg/mL. The coefficient of variation was 2.97% for TNF-α. Plates were read on a Luminex FLEXMAP 3D System and analyzed using xPONENT® software (Luminex). Cytokine distributions were inspected for outliers separately for each plate. There were no measurements below the detection limit for TNF-α.
180 unique individuals were included in analyses. All 180 participants provided TNF-α and IL-6 at at least one prenatal time point, with varying numbers of participants who provided measures at early, mid- and late pregnancy: IL-6 concentrations were available for 91.1% (n = 164) in early, 96.7% (n = 174) in mid-, and 96.7% (n = 174) in late pregnancy. TNF-α concentrations were available for 91.1% (n = 164) in early, 97.8% (n = 176) in mid-, and 96.7% (n = 174) in late pregnancy. TNF-α and IL-6 concentrations were significantly correlated at each prenatal time point (r’s ≥ .2, all ps < .01; see Table 2). First, in order to maintain data variability while minimizing the influence of extreme outliers, outlier values on proinflammatory cytokine values were winsorized to mean ± 3 standard deviations. Raw and winsorized values of TNF-α and IL-6 are presented in Table 1. Results of linear mixed effects models were largely consistent when using raw values as well as when excluding extreme outliers instead of winsorization (see Supplement for more information). The values of IL-6 and TNF-α were then converted into z-scores. Finally, the z-scores were averaged into a composite proinflammatory score for each pregnancy assessment time point when data on both markers was available. In the study sample of 180 participants, this proinflammatory score was available for 1.1% (n = 2) at one, 13.9% (25 participants) at two, and 85% (n = 153) at three prenatal time points. Specifically, the proinflammatory score was calculated for 91.1% (164 participants) in early, 96.6% (n = 174) in mid- and 96.1% (n = 173) in late pregnancy.
Table 2.
Bivariate correlations between cytokine concentrations.
| 1. | 2. | 3. | 4. | 5. | ||
|---|---|---|---|---|---|---|
|
| ||||||
| n | r | r | r | r | r | |
|
| ||||||
|
| ||||||
| 1. early pregnancy TNF-α | 164 | - | ||||
| 2. mid-pregnancy TNF-α | 176 | 0.53*** | - | |||
| 3. late pregnancy TNF-α | 174 | 0.49*** | 0.36*** | - | ||
| 4. early pregnancy IL-6 | 164 | 0.22** | 0.18* | 0.11 | - | |
| 5. mid-pregnancy IL-6 | 174 | 0.16* | 0.41*** | 0.26*** | 0.56*** | - |
| 6. late pregnancy IL-6 | 174 | 0.20* | 0.24** | 0.29*** | 0.58*** | 0.54*** |
Note. all TNF-α and IL-6 scores were winsorized to mean +- 3 SD. r = Pearson’s correlation coefficient.
p < .001
p < .01
p < .05
Sociodemographic information and covariates.
A structured sociodemographic interview was conducted by clinically trained personnel in order to obtain information about maternal age, racial and ethnical background, family income, medication, parity, and history of lifetime psychiatric disorders. Data on obstetric risk conditions were abstracted from antepartum delivery medical records. In order to address potential confounding of the association between CM and depressive symptoms with the proinflammatory score, all linear mixed effect models and secondary analytic models included the following sociodemographic and biophysical covariates selected based on previous empirical work: Maternal pre-pregnancy body mass index (BMI), presence of any obstetric risk conditions in the index pregnancy (anemia, diabetes, hypertension, infection, or vaginal bleeding, coded as 0, none of these conditions endorsed vs. 1, any of these conditions endorsed), maternal racial/ethnic background (coded as 0, “Non-Hispanic/White”, 1, “Hispanic”, and 2, “Non-Hispanic/non-White”), and socio-economic status (SES; operationalized as the mean score derived from highest education and family income per year, each measured on a scale ranging from 1 to 5, with higher scores indicating higher education/income). Furthermore, in order to control for effects of previous or current psychiatric or psychological treatment, which might create a buffering effect that only women diagnosed with psychiatric disorders were able to benefit from, two variables indicating history of admissions to hospital for emotional conditions (lifetime psychiatric in-patient treatment) and use of pharmacological treatment for anxiety and/or depression during the index pregnancy were included in the analyses.
2.4. Statistical analyses
Bivariate correlations (Pearson’s correlations) and point-biserial correlations were computed to test associations among and between cytokines as well as between maternal socio-demographic and obstetric characteristics, CTQ total score, mean pregnancy CES-D score and proinflammatory score. Repeated measures ANOVA was conducted to test for differences in depressive symptoms between pregnancy time points.
Two-level hierarchical linear mixed effect models (LME) (e.g. Long, 2012) with random intercepts and fixed slopes were employed to test the association of the main predictors total CTQ score (natural-log transformed, level-2), assessed in mid-pregnancy, and the repeatedly-measured CES-D scores (level-1) with the repeatedly-measured proinflammatory scores (level-1). The LME accounts for the longitudinal data structure and allows for inclusion of all subjects with available measurements in the repeated-measures variables. The repeatedly-measured proinflammatory scores were used as the outcome variable and an unconditional model was employed to assess intra-class correlation (ICC) of proinflammatory scores which suggested that 54.6% of the overall variance in inflammation was explained by between-person variance, rendering employment of the LME adequate. Models were fitted with maximum likelihood estimation which is an adequate strategy for accounting for missing values. All models were adjusted for the covariates listed above (all level-2). Gestational age was centered by setting the lowest value (8.86 weeks gestation) to 0 and all other metric predictors and covariates (pre-pregnancy BMI, SES, CES-D score, CTQ score) were grand-mean centered to a mean of 0.
Model M1 included all covariates and the repeatedly-measured gestational age at assessment (GA) (level-1) as a predictor. All subsequent models were adjusted for covariates and included GA as a predictor. Model M2 included total CTQ score as a predictor, Model M3 included the repeatedly-measured CES-D score as a predictor and Model M4 included both CTQ and CES-D scores as predictors. Model M5 included total CTQ score and CES-D score as well as the interaction of these predictors.
The equation for the full linear mixed effects model (Model M5) is:
Proinflammatory Scoreij = β0 + β1 (Gestational Ageij) + β2 (Treatmenti) + β3 (Medicationi) + β4 (BMIi) + β5 (OB Riski) + β6 (SESi) + β7 (CTQ Scorei) + β8 (CES-D Scoreij) + β9 (CTQ Scorei × CES-D Scoreij) + u0i + rij
In this equation, the proinflammatory score of person i on occasion j is predicted by an intercept, β0, the person’s life-time history of in-patient treatment for emotional conditions, β2, pharmacological medication during the index pregnancy of person i, β3, the person’s pre-pregnancy BMI, β4, presence of any obstetric risk (OB) conditions in person i, β5, and the person’s socio-economic status, β6. Gestational ageij was included as a level-1 predictor to control for changes in the proinflammatory score across pregnancy. The person’s CTQ total score (ln) is indicated by β7, while person i’s CES-D score on occasion j is indicated by β8 and β9 denotes the interaction term of person i’s CTQ total score and person i’s CES-D score on occasion j. Person i’s deviation from the average level is denoted by the parameter u0i, and the parameter rij denotes person i’s deviation from this individual level at occasion j.
Pseudo R2 indicating explanation of variance by fixed effects are reported for each model. Additionally, these linear mixed effects models were analyzed separately for TNF-α and IL-6 in the study sample (N = 180). The results of these analyses (models M1 – M5) are provided in the Supplement (see Tables S-5 and S-6).
To follow up on the results of the interactive effects of CM experience and depressive symptoms (Model M5), analyses stratified by dichotomized CM were conducted: Model M3 was repeated in women without (CM-) vs. with (CM+) any moderate to severe CM experience [57] in order to test the association between CES-D score and proinflammatory score in these two groups.
In order to explore the association between different types of CM and depressive symptoms with the proinflammatory score, Model M5 was repeated using each of the five CTQ subscale scores separately (natural-log transformed) instead of the total CTQ score as well as CES-D score as predictors.
LME analyses were run in R using the lme4-package (R Core Team, 2017). The significance level was set at p < 0.05 for all applied analyses.
3. Results
3.1. Descriptive analyses
Associations between maternal characteristics and CTQ total score, mean pregnancy CES-D score, and the proinflammatory score are depicted in Table 3. CTQ total score was positively associated with pregnancy mean CES-D score (r = .42, p < .01) and negatively associated with SES (r = −.22, p < .01). Pregnancy mean CES-D score was positively associated with presence of obstetric risk conditions (r = .25, p < .01), CTQ total score and all CTQ subscale scores (all ps < .01) as well as negatively associated with SES (r = .26, p < .01). Both CTQ total score and pregnancy mean CES-D score were lower in Non-Hispanic White participants (r = −.20 and r = −.22; ps < .01; compared to Hispanic and Non-Hispanic Non-White) and positively associated with life-time history of in-patient treatment for emotional conditions (r = .21, p < .01 for CTQ, and r = .17, p < .05 for CES-D). The mean pregnancy proinflammatory score was positively associated with pre-pregnancy BMI (r = .41, p < .01).
Table 3.
Correlations between maternal characteristics, CTQ total score, mean pregnancy CES-D score, and mean pregnancy proinflammatory score.
| Maternal characteristic | CTQ total score | Mean CES-D score | Mean pro-inflammatory score |
|---|---|---|---|
|
| |||
| r | r | r | |
|
| |||
| SES | −0.217** | −.257** | −.042 |
| Pre-pregnancy BMI | 0.007 | .094 | .411** |
| Total CTQ score | .422** | .050 | |
| Emotional Abuse (EA) subscale score | .357** | .077 | |
| Physical Abuse (PA) subscale score | .346** | .044 | |
| Sexual Abuse (SA) subscale score | .308** | .008 | |
| Emotional Neglect (EN) subscale score | .359** | .056 | |
| Physical Neglect (PN) subscale score | .320** | .005 | |
| Mean pregnancy CES-D score | .422** | .125 | |
| Mean pregnancy proinflammatory score | .050 | .125 | |
|
| |||
| r pb | r pb | r pb | |
|
| |||
| Race/ethnicity | |||
| Non-Hispanic Whitea | −.195** | −.217** | −.114 |
| Non-Hispanic Non-Whiteb | .118 | .103 | −.046 |
| Hispanicc | .112 | .143 | .143 |
| Presence of any obstetric risk condition | −.002 | .250** | −.014 |
| Life-time history of in-patient treatment for emotional conditions |
.212** | .172* | .050 |
| Pharmacological treatment for anxiety/depression during pregnancy | −.036 | −.045 | −.057 |
Note. r = Pearson’s correlation coefficient; rpb = Pearson’s point-biserial correlation coefficient; SES = socio-economic status derived from highest education and family income per year; BMI = Body-Mass-Index; CES-D = Center for Epidemiologic Studies – Depression Scale; CTQ = Childhood Trauma Questionnaire;
dummy variable 1 = Non-Hispanic White, 0 = other race/ethnicity
dummy variable 1 = Non-Hispanic Non-White, 0 = other race/ethnicity
dummy variable 1 = Hispanic, 0 = other race/ethnicity
p < .01
p < .05
compared to hispanic and non-hispanic other race/ethnicity
Gestational age was not associated with CES-D score (p = .908). A repeated measures ANOVA with a Greenhouse-Geisser correction determined that the mean scores for CES-D concentration did not significantly differ between pregnancy time points (p = .102).
All CTQ subscale scores were significantly correlated (all ps < .01, see Table 4). The correlations between total CTQ score and CES-D scores at all three assessments were significant (total CTQ score and CES-D in early pregnancy: r = .39, p < .01; mid-pregnancy: r= .34, p < .01; late pregnancy: r = .34, p < .01). The association between total CTQ score and pregnancy mean CES-D score (r = .42, p < .01) is depicted in Figure 1. Of the women who endorsed at least one moderate to severe experience of CM (n = 55), 34.5% (n = 19) had CES-D scores above 20, indicating clinically significant depressive symptoms [59], in early pregnancy, 30.9% (n = 17) in mid-pregnancy, and 30.9% (n = 17) in late pregnancy. In women who reported CTQ scores below the moderate cut-off [57] on all scales (N = 125), 15.2% (n = 19) had CES-D scores above 20 in early pregnancy, 12% (n = 15) in mid-, and 18.4% (n = 23) in late pregnancy. This indicates a higher likelihood of experiencing depressive symptoms if more severe CM is endorsed, but also shows that there is a significant number of cases of women with CM who have low depressive symptoms.
Table 4.
Bivariate correlations between CTQ subscale scores in the study sample (N = 180).
| 1. | 2. | 3. | 4. | |
|---|---|---|---|---|
|
| ||||
| r | r | r | r | |
|
| ||||
| 1. CTQ Emotional Abuse subscale score | - | |||
| 2. CTQ Physical Abuse subscale score | 0.76** | - | ||
| 3. CTQ Sexual Abuse subscale score | 0.51** | 0.58** | - | |
| 4. CTQ Emotional Neglect subscale score | 0.61** | 0.48** | 0.37** | - |
| 5. CTQ Physical Neglect subscale score | 0.60** | 0.60** | 044** | 0.65** |
Note. r = Pearson’s correlation coefficient.
p < .01
Figure 1.
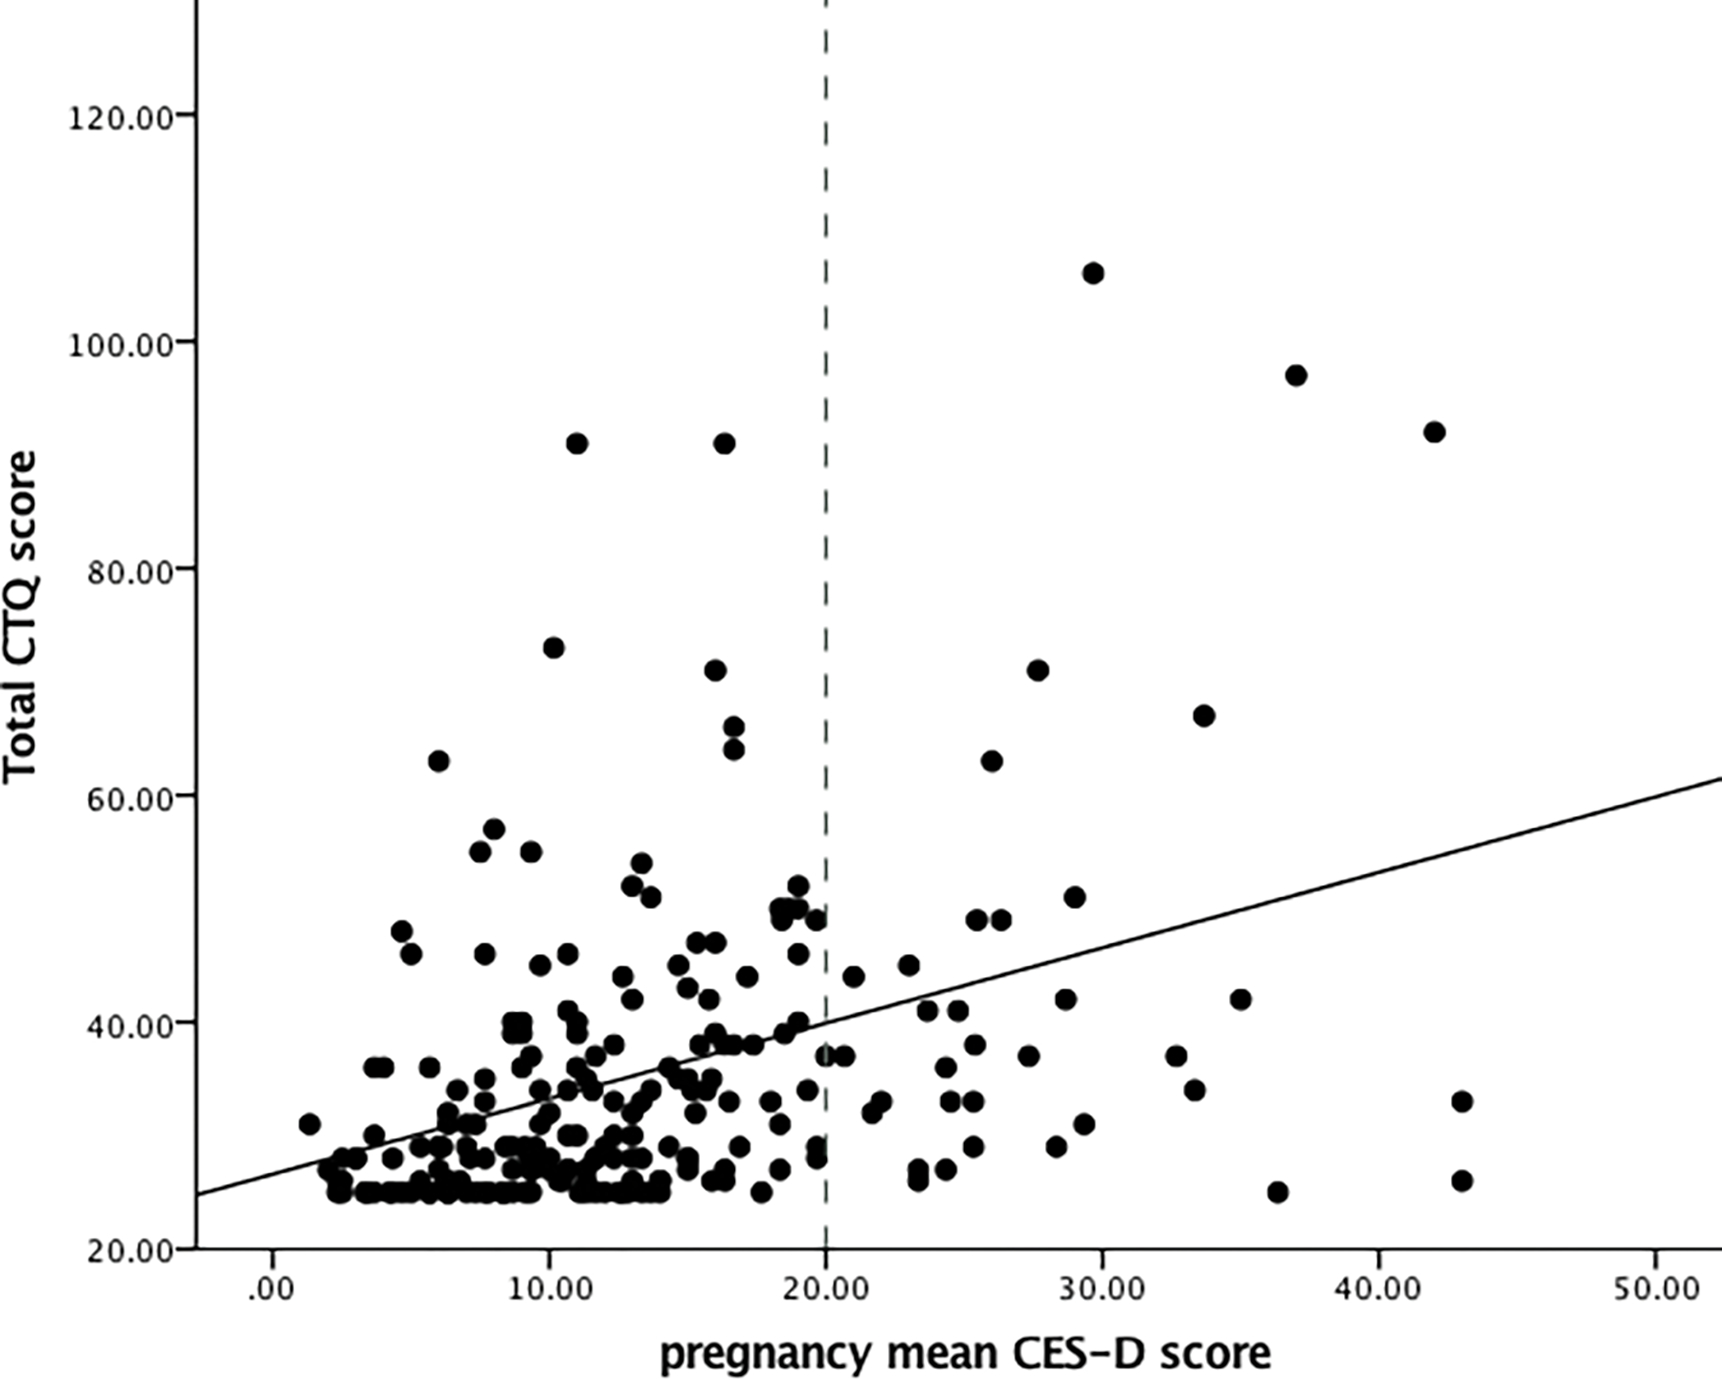
Association between total CTQ score and pregnancy mean CES-D score. For illustration purposes, a cut-off of 20 or higher was applied to the CES-D scores to indicate clinically relevant depressive symptoms [59].
Birth outcomes were in the normal healthy range, with 95.3% of births after 37 completed weeks gestation, and 94.8% of infants weighing 2500 g or more at birth.
3.2. Linear mixed effect models: associations between CTQ score, CES-D score and proinflammatory score
Results of linear mixed effect models M1 through M5 are displayed in Table 5. All linear mixed effect models showed an association of gestational age with the proinflammatory score (p < .001) (M1–5, see Figure 2). There was no main effect of total CTQ score on the proinflammatory score (p > .6) (M2, M4). Maternal depressive symptoms (CES-D score), similarly, were not associated with the proinflammatory score (p > .28) (M3, M4). Model M5 revealed a significant interaction of total CTQ score and CES-D score (B = .03, SE = .01, p < .05), indicating higher proinflammatory scores in women with higher CTQ scores and higher levels of depressive symptoms during pregnancy.
Table 5.
Linear mixed effect models with proinflammatory score as outcome variable.
| Model M1 | Model M2 | Model M3 | Model M4 | Model M5 | |||||||||||
|---|---|---|---|---|---|---|---|---|---|---|---|---|---|---|---|
|
| |||||||||||||||
| Regression coefficients | |||||||||||||||
|
| |||||||||||||||
| Est. | SE | p | Est. | SE | p | Est. | SE | p | Est. | SE | p | Est. | SE | p | |
|
| |||||||||||||||
| Intercept | −0.27 | 0.09 | 0.004 | −0.27 | 0.09 | 0.005 | −0.26 | 0.09 | 0.006 | −0.26 | 0.09 | 0.006 | −0.28 | 0.09 | 0.003 |
| Maternal race/ethnicity (Ref. Non-Hispanic White) | |||||||||||||||
| Hispanic | 0.16 | 0.11 | 0.166 | 0.15 | 0.11 | 0.178 | 0.15 | 0.11 | 0.189 | 0.15 | 0.11 | 0.195 | 0.14 | 0.11 | 0.226 |
| Non-Hispanic Other | −0.02 | 0.14 | 0.896 | −0.03 | 0.15 | 0.837 | −0.03 | 0.14 | 0.828 | −0.04 | 0.15 | 0.804 | −0.03 | 0.14 | 0.852 |
| Pre-pregnancy BMI | 0.05 | 0.01 | <0.001 | 0.05 | 0.01 | <0.001 | 0.05 | 0.01 | <0.001 | 0.05 | 0.01 | <0.001 | 0.05 | 0.01 | <0.001 |
| Lifetime psychiatric in-patient treatment (Ref. No) | |||||||||||||||
| Yes | 0.19 | 0.22 | 0.384 | 0.17 | 0.23 | 0.447 | 0.17 | 0.22 | 0.454 | 0.16 | 0.23 | 0.486 | 0.13 | 0.23 | 0.552 |
| Presence of any obstetric risk condition (Ref. No) | |||||||||||||||
| Yes | −0.13 | 0.13 | 0.291 | −0.13 | 0.13 | 0.303 | −0.15 | 0.13 | 0.233 | −0.15 | 0.13 | 0.244 | −0.16 | 0.13 | 0.211 |
| Pharmacological treatment of anxiety/depression during pregnancy (Ref. No) | |||||||||||||||
| Yes | −0.47 | 0.36 | 0.194 | −0.47 | 0.36 | 0.198 | −0.46 | 0.36 | 0.197 | −0.46 | 0.36 | 0.199 | −0.45 | 0.36 | 0.208 |
| SES | 0.03 | 0.06 | 0.605 | 0.03 | 0.06 | 0.553 | 0.03 | 0.06 | 0.543 | 0.04 | 0.06 | 0.524 | 0.03 | 0.06 | 0.557 |
| Gestational age | 0.02 | 0.00 | <0.001 | 0.02 | 0.00 | <0.001 | 0.02 | 0.00 | <0.001 | 0.02 | 0.00 | <0.001 | 0.02 | 0.00 | <0.001 |
| CTQ total score (ln) | 0.07 | 0.16 | 0.661 | 0.03 | 0.16 | 0.830 | −0.05 | 0.17 | 0.755 | ||||||
| CES-D score | 0.00 | 0.00 | 0.345 | 0.00 | 0.00 | 0.389 | 0.00 | 0.00 | 0.678 | ||||||
| CTQ total score (ln)*CES-D score | 0.03 | 0.01 | 0.025 | ||||||||||||
| Variance components | |||||||||||||||
| Within-person variance σ2 | 0.31 | 0.31 | 0.31 | 0.31 | 0.31 | ||||||||||
| Between-person variance τ00 | 0.25 participant | 0.25 participant | 0.25 participant | 0.25 participant | 0.24 participant | ||||||||||
| Model summary | |||||||||||||||
| Observations | 498 | 498 | 498 | 498 | 498 | ||||||||||
| N (participants) | 180 participant | 180 participant | 180 participant | 180 participant | 180 participant | ||||||||||
| Pseudo R2 | 0.164 | 0.164 | 0.166 | 0.166 | 0.178 | ||||||||||
| AIC | 1059.0 | 1060.8 | 1060.1 | 1062.0 | 1059.1 | ||||||||||
| BIC | 1105.3 | 1111.3 | 1110.6 | 1116.8 | 1118.0 | ||||||||||
Note. Est. = Estimates; SE = standard error; BMI = Body-Mass-Index; SES = socio-economic status; CES-D = Center for Epidemiologic Studies – Depression Scale; CTQ = Childhood Trauma Questionnaire. Outcome: repeatedly-measured aggregated score of serum concentrations of TNF-α and IL-6; Covariates: maternal race/ethnicity, SES, pre-pregnancy BMI, lifetime psychiatric in-patient treatment, presence of any obstetric risk conditions, pharmacological treatment of anxiety/depression during pregnancy; Predictors: Model 1: gestational age; Model 2: gestational age, total CTQ score (ln); Model 3: gestational age, repeatedly-measured CES-D score; Model 4: gestational age, total CTQ score (ln), repeatedly-measured CES-D score; Model 5: gestational age, total CTQ score (ln), repeatedly-measured CES-D score, total CTQ score (ln)*repeatedly-measured CES-D score.
Figure 2.

Association between repeatedly-measured proinflammatory scores and gestational age in weeks.
When conducting these analyses separately for TNF-α and IL-6, the positive main effect of gestational age remained significant in all linear mixed effects models for both TNF-α (ps < .05) and IL-6 (ps < .001). The interaction effect of CM and depressive symptoms was significant for TNF-α (B = .17, SE = .06, p < .01) but not for IL-6 (B = .003, SE = .01, p = .64) (see Supplement Tables S-5 and S-6).
Missing data was imputed in R with the mice package [60] in order to test whether the observed effects were robust. Proportion of missing data, trace plots of the imputed data, density plots of the observed and imputed data, and results of linear mixed effects models with imputed data are presented in the Supplement (see Figures S-1 and S-2, and Tables S-1 and S-2).
3.3. Linear mixed effect models: associations between CES-D score and proinflammatory score in women with vs. without CM experience
To follow up on the results of the interactive effects of CM experience and depressive symptoms on proinflammatory scores, Model M3 was repeated in women with (CM+) vs. without (CM-) moderate to severe CM experiences (see Figures 3a and 3b). In women without CM experiences, CES-D score was not associated with the proinflammatory score (p > .68), while in women with one or more moderate or severe CM experiences, higher CES-D score was marginally associated with the proinflammatory score (B = .02, SE = .01, p = .06). This indicates that while an increase in depressive symptoms is not associated with an increase in inflammation in the CM- group, an increase by approximately 1 SD (9.12 units) in the CES-D score is marginally associated with a .2 SD increase in the proinflammatory score in the CM+ group. Pseudo R2 of Model M3 in the CM- group vs. the CM+ group (.261 vs. .104) indicates that a larger proportion of the variance is explained by the fixed effects in the CM- group than the CM+ group. Results of Model M3 in women with vs. without CM experiences are displayed in Table 6.
Figure 3a.
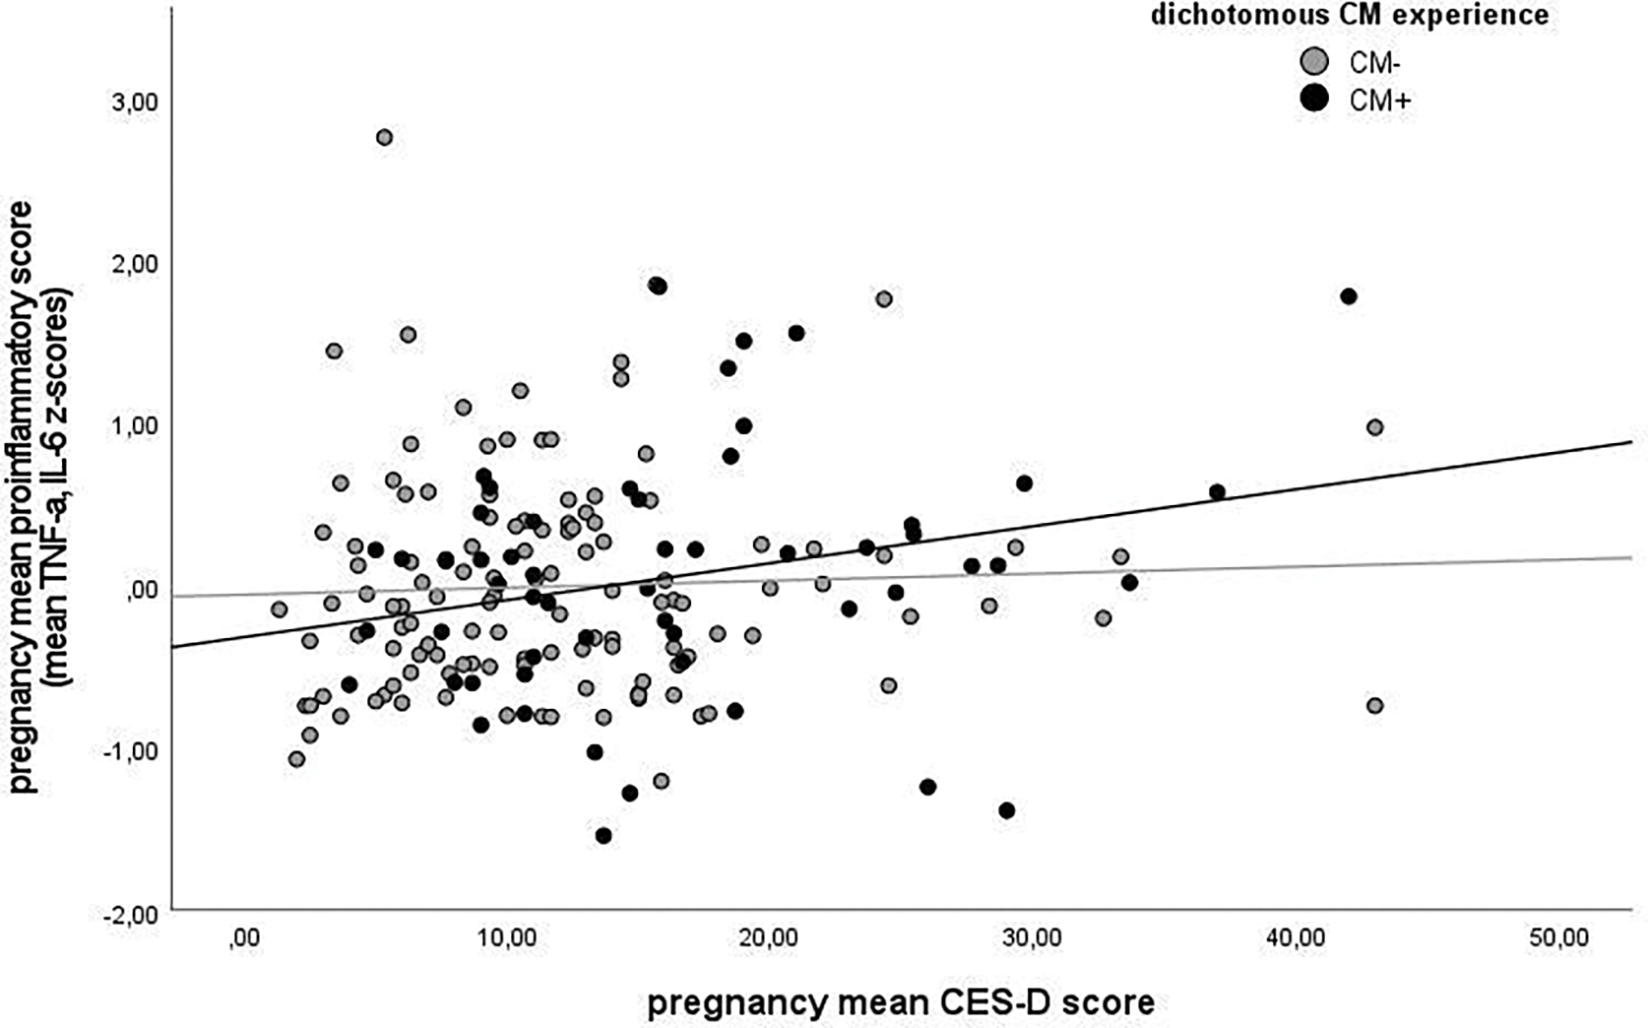
Association between pregnancy mean proinflammatory score and pregnancy mean CES-D score in women without vs. with CM experiences. For illustration purposes, a cut-off for moderate CM experiences was used.
Note. CM+ = moderate to severe score (EA ≥ 13, PA ≥ 10, SA ≥ 8, EN ≥ 15, and PN ≥ 10) on at least one CTQ subscale; CM- = scores below moderate cut-off on all CTQ subscales.
Figure 3b.
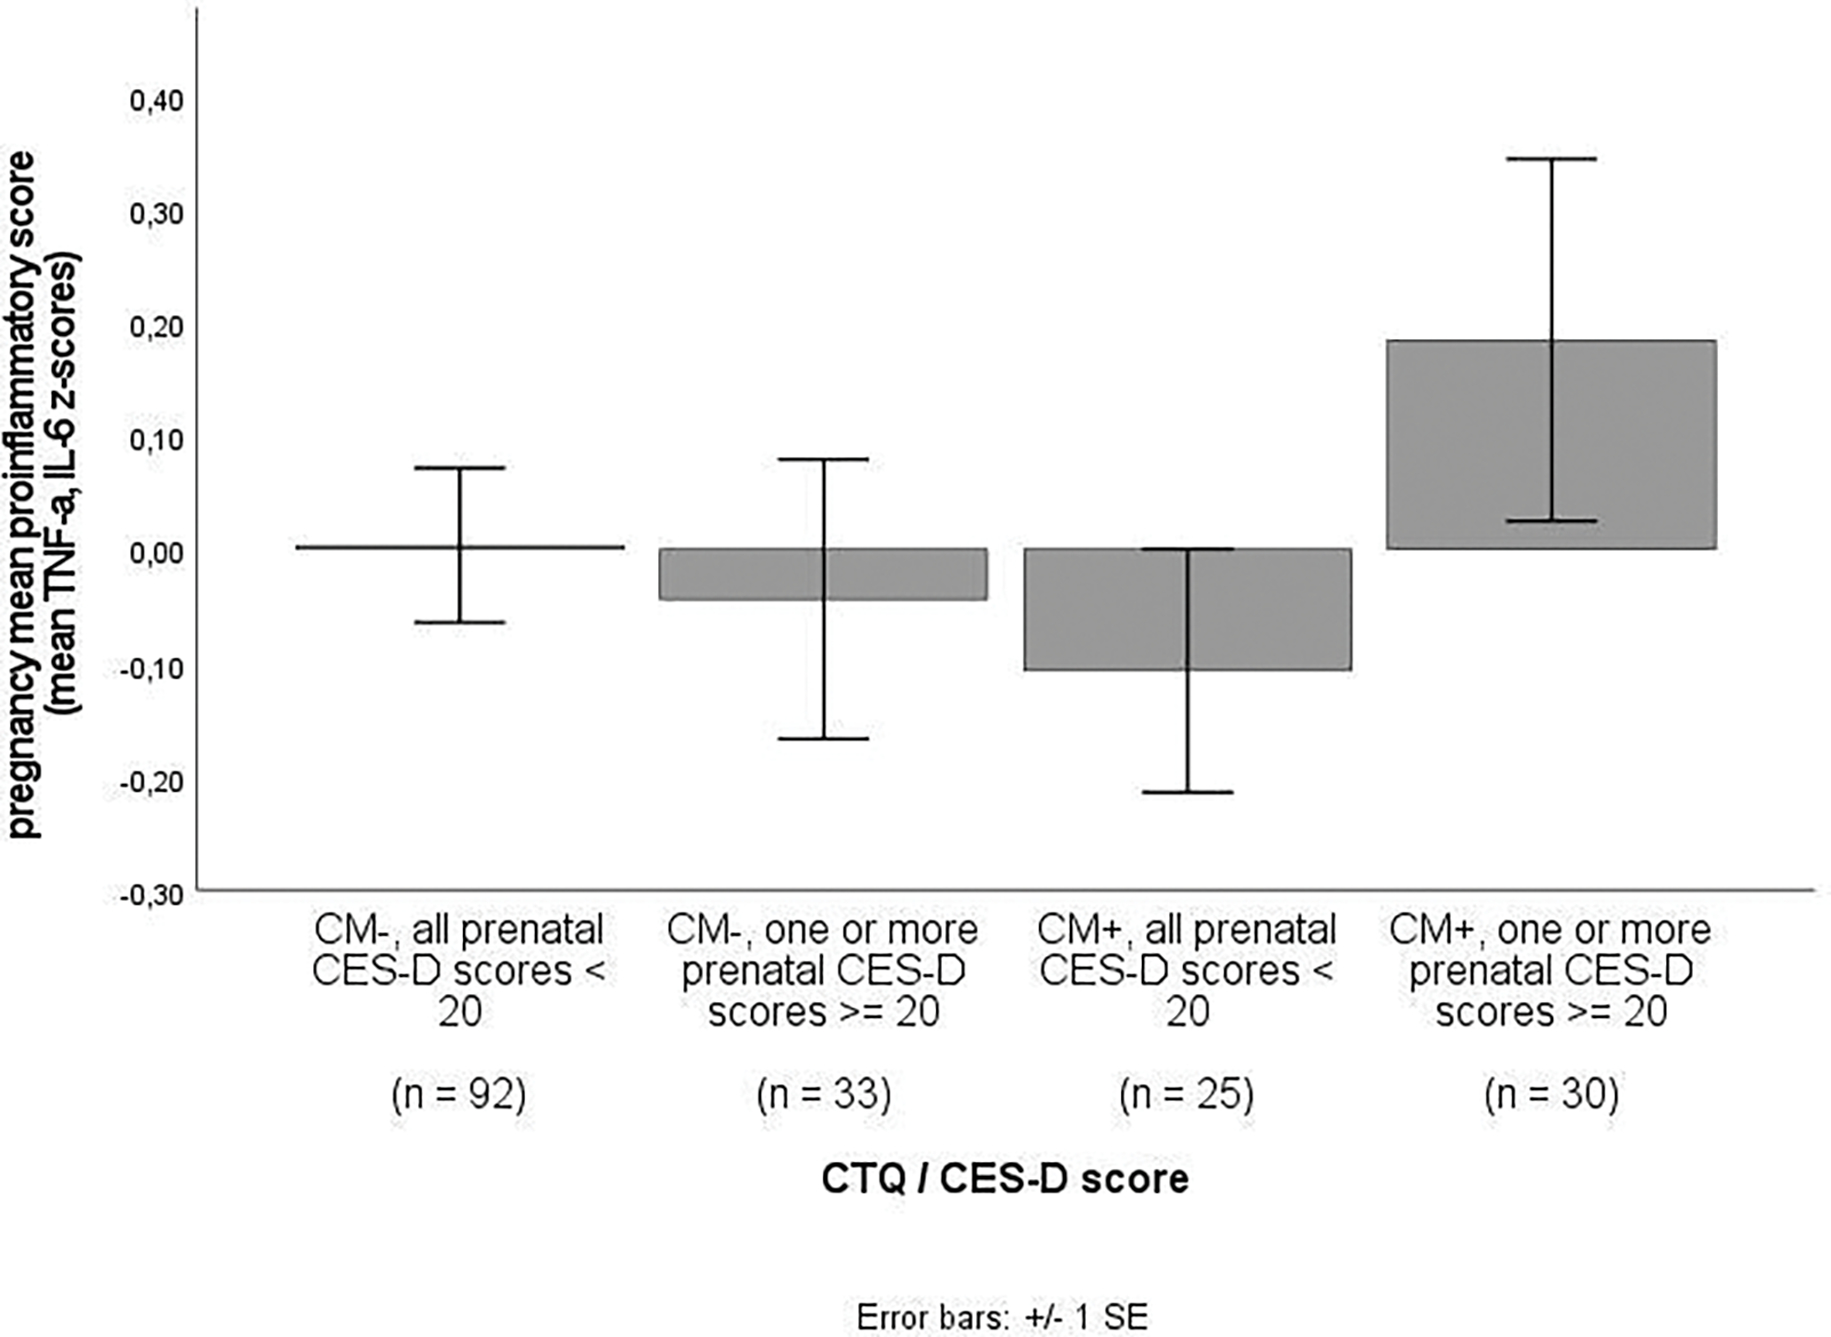
Pregnancy mean proinflammatory score in women without vs. with CM experiences and none vs. any clinically relevant depressive symptoms [59].
Note. CM+ = moderate to severe score (EA ≥ 13, PA ≥ 10, SA ≥ 8, EN ≥ 15, and PN ≥ 10) on at least one CTQ subscale; CM- = scores below moderate cut-off on all CTQ subscales.
Table 6.
Linear mixed effect models with proinflammatory score as outcome variable in women with none vs. one or more moderate to severe CM experiences.
| Model M3: CM− | Model M3: CM+ | |||||
|---|---|---|---|---|---|---|
|
| ||||||
| Regression coefficients | Estimates | SE | p | Estimates | SE | p |
|
| ||||||
| Intercept | −0.35 | 0.10 | <0.001 | −0.09 | 0.21 | 0.669 |
| Maternal race/ethnicity (Ref. Non-Hispanic White) | ||||||
| Hispanic | 0.28 | 0.13 | 0.026 | 0.06 | 0.23 | 0.796 |
| Non-Hispanic Other | −0.12 | 0.17 | 0.495 | −0.09 | 0.28 | 0.755 |
| Pre-pregnancy BMI | 0.06 | 0.01 | <0.001 | 0.03 | 0.02 | 0.087 |
| Lifetime psychiatric in-patient treatment (Ref. No) | ||||||
| Yes | 1.11 | 0.40 | 0.006 | −0.19 | 0.32 | 0.543 |
| Presence of any obstetric risk condition (Ref. No) | ||||||
| Yes | −0.06 | 0.13 | 0.675 | −0.31 | 0.28 | 0.267 |
| Pharmacological treatment of anxiety/depression during pregnancy (Ref. No) | ||||||
| Yes | −0.24 | 0.39 | 0.535 | −0.60 | 0.74 | 0.420 |
| SES | 0.13 | 0.07 | 0.055 | −0.00 | 0.13 | 0.983 |
| Gestational age | 0.02 | 0.00 | <0.001 | 0.02 | 0.01 | 0.010 |
| CES-D score | −0.00 | 0.00 | 0.620 | 0.02 | 0.01 | 0.060 |
| Variance components | ||||||
| Within person variance σ2 | 0.26 | 0.42 | ||||
| Between-person variance τ00 | 0.18 participant | 0.32 participant | ||||
| Model summary | ||||||
| Observations | 346 | 152 | ||||
| N (participants) | 125 participant | 55 participant | ||||
| Pseudo R2 | 0.261 | 0.104 | ||||
Note. SE = standard error; BMI = Body-Mass-Index; SES = socio-economic status; CES-D = Center for Epidemiologic Studies – Depression Scale; CTQ = Childhood Trauma Questionnaire; CM = Childhood maltreatment; CM+ = moderate to severe scores (EA ≥ 13, PA ≥ 10, SA ≥ 8, EN ≥ 15, and PN ≥ 10) on at least one CTQ subscale; CM− = scores below moderate cut-off on all CTQ subscales. Outcome: repeatedly-measured aggregated score of serum concentrations of TNF-α and IL-6; Covariates: maternal race/ethnicity, SES, pre-pregnancy BMI, lifetime psychiatric in-patient treatment, presence of any obstetric risk conditions, pharmacological treatment of anxiety/depression during pregnancy; Predictors: Model 3: gestational age, repeatedly-measured CES-D score.
3.4. Linear mixed effect models: associations between CTQ subscale scores, CES-D score and proinflammatory score
Exploratory analyses using each of the five CTQ subscale scores individually as predictors in Model M5 indicated that there was no main effect of any of the CTQ subscale scores (ps > .08) or CES-D score (p > .28) on the proinflammatory score. The interaction effect of CTQ subscale score and CES-D score on the proinflammatory score was significant for CTQ subscales emotional abuse (B = .03, SE = .01, p < .01) and physical abuse (B = .00, SE = .00, p < .05) as well as marginally significant for sexual abuse (B = .02, SE = .01, p = .066), but was not significant for CTQ subscales emotional neglect (p = .172) and physical neglect (p = .105). Results of Model M5 with the respective CTQ subscale scores as predictors are displayed in Table 7.
Table 7.
Linear mixed effect models with CTQ subscale scores (natural-log transformed) as predictor and proinflammatory score as outcome variable.
| Model M5: CTQ subscale score: Emotional Abuse (EA) | Model M5: CTQ subscale score: Physical Abuse (PA) | Model M5: CTQ subscale score: Sexual Abuse (SA) | Model M5: CTQ subscale score: Emotional Neglect (EN) | Model M5: CTQ subscale score: Physical Neglect (PN) | |||||||||||
|---|---|---|---|---|---|---|---|---|---|---|---|---|---|---|---|
| Estimates | SE | p | Estimates | SE | p | Estimates | SE | p | Estimates | SE | p | Estimates | SE | p | |
|
| |||||||||||||||
| Regression coefficients | |||||||||||||||
|
| |||||||||||||||
| Intercept | −0.27 | 0.09 | 0.004 | −0.27 | 0.09 | 0.004 | −0.28 | 0.09 | 0.003 | −0.26 | 0.09 | 0.005 | −0.26 | 0.09 | 0.005 |
| Maternal race/ethnicity (Ref. Non-Hispanic White) | |||||||||||||||
| Hispanic | 0.12 | 0.11 | 0.274 | 0.13 | 0.11 | 0.232 | 0.16 | 0.11 | 0.142 | 0.14 | 0.11 | 0.217 | 0.14 | 0.11 | 0.201 |
| Non-Hispanic Other | −0.05 | 0.14 | 0.718 | −0.03 | 0.14 | 0.808 | −0.00 | 0.14 | 0.980 | −0.04 | 0.14 | 0.757 | −0.03 | 0.14 | 0.837 |
| Pre-pregnancy BMI | 0.05 | 0.01 | <0.001 | 0.05 | 0.01 | <0.001 | 0.05 | 0.01 | <0.001 | 0.05 | 0.01 | <0.001 | 0.05 | 0.01 | <0.001 |
| Lifetime psychiatric in-patient treatment (Ref. No) | |||||||||||||||
| Yes | 0.09 | 0.22 | 0.681 | 0.16 | 0.22 | 0.463 | 0.22 | 0.22 | 0.317 | 0.15 | 0.22 | 0.512 | 0.17 | 0.22 | 0.461 |
| Presence of any obstetric risk condition (Ref. No) | |||||||||||||||
| Yes | −0.16 | 0.13 | 0.198 | −0.17 | 0.13 | 0.184 | −0.16 | 0.13 | 0.201 | −0.14 | 0.13 | 0.261 | −0.17 | 0.13 | 0.186 |
| Pharmacological treatment of anxiety/depression during pregnancy (Ref. No) | |||||||||||||||
| Yes | −0.43 | 0.36 | 0.230 | −0.49 | 0.36 | 0.170 | −0.42 | 0.36 | 0.243 | −0.45 | 0.36 | 0.207 | −0.50 | 0.36 | 0.162 |
| SES | 0.04 | 0.06 | 0.514 | 0.03 | 0.06 | 0.594 | 0.03 | 0.06 | 0.576 | 0.05 | 0.06 | 0.392 | 0.03 | 0.06 | 0.661 |
| Gestational age | 0.02 | 0.00 | <0.001 | 0.02 | 0.00 | <0.001 | 0.02 | 0.00 | <0.001 | 0.02 | 0.00 | <0.001 | 0.02 | 0.00 | <0.001 |
| CES-D score | −0.00 | 0.00 | 0.945 | 0.00 | 0.00 | 0.510 | 0.00 | 0.00 | 0.415 | 0.00 | 0.00 | 0.702 | 0.00 | 0.00 | 0.345 |
| CTQ subscale score (ln) | 0.09 | 0.12 | 0.473 | −0.02 | 0.02 | 0.250 | −0.24 | 0.14 | 0.090 | 0.12 | 0.12 | 0.305 | −0.16 | 0.16 | 0.320 |
| CTQ subscale score (ln) *CES-D score | 0.03 | 0.01 | 0.002 | 0.00 | 0.00 | 0.015 | 0.02 | 0.01 | 0.066 | 0.01 | 0.01 | 0.172 | 0.02 | 0.01 | 0.105 |
| Variance components | |||||||||||||||
| Within-person variance σ2 | 0.30 | 0.31 | 0.31 | 0.31 | 0.31 | ||||||||||
| Between-person variance τ00 | 0.24 participant | 0.24 participant | 0.24 participant | 0.25 participant | 0.24 participant | ||||||||||
| Model summary | |||||||||||||||
| Observations | 498 | 498 | 498 | 498 | 498 | ||||||||||
| N (participants) | 180 participant | 180 participant | 180 participant | 180 participant | 180 participant | ||||||||||
| Pseudo R2 | 0.190 | 0.180 | 0.177 | 0.173 | 0.173 | ||||||||||
Note. SE = standard error; BMI = Body-Mass-Index; SES = socio-economic status; CES-D = Center for Epidemiologic Studies – Depression Scale; CTQ = Childhood Trauma Questionnaire. Outcome: repeatedly-measured aggregated score of serum concentrations of TNF-α and IL-6; Covariates: maternal race/ethnicity, SES, pre-pregnancy BMI, lifetime psychiatric in-patient treatment, presence of any obstetric risk conditions, pharmacological treatment of anxiety/depression during pregnancy; Predictors: Model 5: gestational age, CTQ subscale score (ln), repeatedly-measured CES-D score, CTQ subscale score (ln)*repeatedly-measured CES-D score.
4. Discussion
In this sample of healthy pregnant women, we found a positive association between gestational age and the proinflammatory state. This is consistent with prior studies showing increasing levels of TNF-α [61–63] and IL-6 [61, 64] across gestation. Consistent with our hypothesis we found that the association between maternal CM severity and proinflammatory state is moderated by severity of depressive symptoms during pregnancy. The reported results are in concordance with previous observations on the combined effect of CM and depression on inflammation in non-pregnant and pregnant populations [42, 43, 47–51]. Our results extend the findings in the pregnancy literature on the interactive effect of depressive symptoms and CM on proinflammatory cytokines [42, 43], which have thus far been limited to IL-6, by aggregating both IL-6 and TNF-α as a more comprehensive measure representative of a systemic pro-inflammatory state. When conducting analyses separately for TNF-α and IL-6, the interaction effect of CM and depressive symptoms was significant for TNF-α but not for IL-6, which is in concordance with the heterogeneous pattern of associations observed between CM and single inflammatory markers in the literature [65]. We had deliberately chosen to use an aggregated inflammatory marker that better reflects the interplay of proinflammatory cytokines – an approach that has been frequently used in pregnant [34, 66, 67] and non-pregnant populations [68–71]. By applying this composite score, we address the lack of consistency in the literature regarding a specific operationalization of inflammation. The use of the proinflammatory score is further justified by the fact that while TNF-α and IL-6 are significantly correlated, they are not redundant (all r < .5, all p < .01, see Table 2).
Previous studies on the interactive effect of CM and depressive symptoms have focused on IL-6 as a single marker of inflammation. While the combined effect of CM and depression on IL-6 in mid-pregnancy has been established previously in adolescent Hispanic women [43], our results suggest that the association between CM, depressive symptoms and systemic inflammation may also apply to a more diverse sample of healthy adults and to a wider range of pregnancy time points. While in a previous study CM, represented by a dichotomous variable indicating absence or presence of CM, was not associated with pregnancy IL-6 either independently or in interaction with depressive symptoms, quality of maternal caregiving experience has been found to interact with depressive symptoms to predict elevated IL-6 in late pregnancy [42]. Our approach of focusing on CM severity similarly provided evidence for an interactive effect of a continuous measure of childhood adversity and depressive symptoms on proinflammatory state during pregnancy.
We found that depressive symptoms were marginally associated with inflammation in women with CM, indicating an increase in the proinflammatory score of 0.2 SD per 1 SD increase in depressive symptoms in women with CM. This estimate is similar to the reported association between maternal depression and hsCRP [72] in obese women but slightly higher than what has been reported for the association between depression and inflammatory markers during pregnancy independent of additional risk factors that may increase inflammatory state (e.g., CM history, obesity) [72]. This suggests that depressive symptoms are especially potent in affecting maternal inflammatory state in interaction with other maternal risk factors. More variance in the proinflammatory score remains unaccounted for in the CM+ compared to the CM- group. This raises the question which additional variables may be missing from the model. It is possible that other common sequelae of CM exposure, like obesity, may moderate the association between CM and inflammation during pregnancy. In future larger cohorts, the moderating effects of additional common sequelae should be investigated with the aims of identifying targets for intervention to reduce inflammation during pregnancy in women exposed to CM.
There is extensive literature linking inflammation during pregnancy with detrimental pregnancy, birth and offspring health outcomes such as preterm delivery, preeclampsia, pregnancy loss, impaired neurodevelopment and offspring psychopathology [26–37]. For instance, increases in log TNF-α and IL-6 of this magnitude (.2 SD) have previously been associated with a .2 fold increased risk of preterm delivery < 37 weeks [73, 74]. We therefore suggest that the effect observed in this study is likely to have important clinical significance.
Pregnancy constitutes a particularly sensitive period in which depressive symptoms are both prevalent and have the potential to affect health and wellbeing of the mother and her child. Among the potential biological mechanisms of depression during pregnancy are dysregulations in reproductive steroids (estrogen and progesterone) which, in a complex interplay with dysregulations of the HPA axis, may increase the risk for depression in vulnerable or susceptible women [75]. Our results are in concordance with literature suggesting that the co-occurrence of CM and depression is associated with enduring disruptions of brain, endocrine and immune functioning [51]. While there is growing interest in the causal relationship between inflammation and depression, with some highlighting a bidirectional relationship [76, 77], and a growing body of literature supporting the hypothesis that inflammation contributes to the pathogenesis of mental illness, especially in the context of CM [49, 78–83], no definitive conclusions can be drawn about causality or temporal sequence of the factors under investigation here due to the correlational nature of the analyses conducted. Our results fall in line with a growing body of evidence suggesting that depression and inflammation may share common origins in early life stress: depression and increased inflammatory response have been found to cluster in individuals who have experienced CM and these lingering effects of CM appear to be bidirectional in that brief depressive symptomatology leave a persisting inflammatory residue and vice versa [49].
Several pathways by which CM may result in elevated concentrations of inflammation-related biomarkers [20] have been discussed [84, 85] including dysregulation of the hypothalamic-pituitary-adrenal (HPA), characterized by reduced sensitivity of the glucocorticoid receptor (GR), potentially as a consequence of epigenetic alterations (e.g. in FKBP-5) in response to early life stress [86] resulting in an up-regulation of the transcription factor NF-κB and consequently elevated inflammation levels [87]. Furthermore, activation of the inflammatory response to stress in early development may program microglia reactivity, which contributes to neuroinflammation. Additionally, early life stress has been shown to be associated with advanced cellular aging and these senescent cells may contribute to an inflammatory milieu [88]. In depressive disorders, alterations in brain-endocrine-immune interaction and neuroendocrine and neuroimmune response frequently appear to be secondary to early life stress [80], and CM-related persistent sensitization of stress responses and HPA axis hyperactivation may represent one mechanism mediating the manifestation of depressive symptoms [80, 89]. Severity of CM has been shown to be associated with increased HPA axis activity specifically in depressed individuals with glucocorticoid resistance [90].
Our results suggest that inflammatory dysregulation is particularly pronounced in CM-exposed depressed women, while neither CM nor depression independently predict inflammation. This observed moderation could simply be a reflection of the severity of CM exposure because depressive symptoms increase with CM severity in a dose-response manner and thus the women with CM and depressive symptoms may be the ones with the most severe early life adversity and are consequently the ones with the more severe biological alterations.
Even though no conclusions can be drawn about the chronological and causal relationships between CM, inflammation and depression in this study, it is possible that depressive symptoms are a consequence of biological embedding of CM experience via inflammatory pathways. Prospective studies of individuals exposed to CM provide the opportunity to address the question whether the biological embedding (i.e., increased inflammation) of CM experiences predisposes individuals to develop detrimental mental health consequences or whether the psychiatric sequelae of CM are crucial pathways by which the biological effects of CM get established and/or become exacerbated. In order to further assess why some individuals develop depressive symptoms after CM experience, and thus present with increased inflammation during pregnancy, while others do not, it is important to consider factors which may account for higher resilience versus vulnerability. Candidate mechanisms may be genetic risk factors [91–95], individual differences in psychological resilience and coping styles [96–101] and other behavioral and environmental characteristics (e.g. family and social support and relationships) [102–107]. Thus, it will be crucial in future research to assess pathways to both resilience and vulnerability to inflammatory and psychological sequelae of CM.
We conducted exploratory analyses in order to address the question whether certain types of CM were more strongly associated with inflammation during pregnancy than other types of CM. Our results suggest that more severe experiences of abuse, but not neglect, interact with depressive symptoms to predict elevated proinflammatory state during pregnancy. Potential explanations for this observation are higher severity of experiences of abuse compared to experiences of neglect which may lead to more severe biological alterations and more salient memories of events of abuse than experiences of neglect [108], which may render the retrospective assessment of childhood abuse and therefore the analysis of its long-term sequelae more accurate. As different types of CM experience frequently overlap [5] – as evidenced in our study sample by the high correlations between different types of CM – it is difficult to draw definitive conclusions on distinct effects of isolated CM experiences.
We suggest several strengths of our study. Firstly, we employed a longitudinal design to investigate the relationship between CM, depression and inflammation across a time span of over 25 weeks, covering early to late pregnancy. Secondly, by using an aggregated score of major proinflammatory cytokines TNF-α and IL-6, we adopted a more comprehensive approach which allowed us to take into consideration the functionally intertwined components of the immune system. Thirdly, by serially assessing prenatal depressive symptoms on a continuous self-report scale, we were able to characterize the prenatal profile of a variety of depressive symptoms, ranging from low-grade depressive mood to clinically significant major depressive episodes and were able to show that increasing levels of depressive symptoms in women exposed to CM, rather than clinically significant depressive episodes only, are associated with increased inflammation. We conducted this study in a demographically diverse, low-risk sample of healthy pregnant women not enriched for either severe CM or specific types of CM or clinical levels of depression. As expected in this sample of healthy pregnant women, depressive symptoms during pregnancy were low with a mean pregnancy CES-D score of 14.7 (SD = 8.0). 9% of participants consistently scored 20 or higher on the CES-D, which has been suggested as an adequate cut-off for detecting depression in the general population [59]. When applying the more frequently-used cut-off of 16 for CES-D, 13% of women were above this score across pregnancy, which suggests a lower percentage of clinically significant episodes compared to 20% above the cut-off reported in a sample of pregnant women screened in obstetrics settings [109]. Similarly, the percentage of women endorsing at least moderate CM in this study sample (30.6%) is slightly lower than previously reported in pregnancy [110]. All results remained significant after taking into consideration a variety of potential biophysical and psychosocial confounders, among those psychiatric or psychological treatment, which might create a buffering effect that only women who have been diagnosed with psychiatric disorders were able to benefit from.
Our findings should be considered within the context of the following limitations. Firstly, there are limitations of retrospective assessments of CM. The credibility of retrospective, self-report measures of early life stress has been evaluated critically [111] and the CTQ is a valid instrument with high internal consistency, good test-retest reliability and convergence with other types of instruments [112]. Secondly, while CM likely represents the antecedent exposure, no definitive conclusions can be drawn on the order of occurrence of depressive symptoms and elevated inflammation. Longitudinal studies could provide further understanding of the sequence of events in order to establish potential pathways underlying the association between CM, psychopathology, and inflammation.
The results provided here highlight not only the importance of the timely ascertainment of CM exposure but further suggest that by concurrently assessing depressive symptoms, particularly prior to the exposed woman’s pregnancy, clinicians might be able through targeted and individualized interventions to impact inflammation during pregnancy and to ameliorate the detrimental long-term effects of CM for the pregnant woman and her child.
Supplementary Material
Acknowledgments
Funding:
This work was supported in part by US PHS (NIH) grants R01 HD-060628, R01 HD-065825, UH3 OD-O23349, and European Research Council grant ERC-Stg 639766, and the Elsa-Neumann-Scholarship received by TK.
Footnotes
Competing interests
Authors report no competing interests.
References.
- 1.Wang C-T and Holton J, Total estimated cost of child abuse and neglect in the United States. 2007: Prevent Child Abuse America; Chicago, IL. [Google Scholar]
- 2.Anda R, The health and social impact of growing up with adverse childhood experiences: The human and economic costs of the status quo. Centers for Disease Control and Prevention, 2007. [Google Scholar]
- 3.Bynum L, et al. , Adverse childhood experiences reported by adults-five states, 2009. Morbidity and Mortality Weekly Report, 2010. 59(49): p. 1609–1613. [PubMed] [Google Scholar]
- 4.Everson MD, et al. , Concordance between adolescent reports of childhood abuse and child protective service determinations in an at-risk sample of young adolescents. Child maltreatment, 2008. 13(1): p. 14–26. [DOI] [PubMed] [Google Scholar]
- 5.Dong M, et al. , The interrelatedness of multiple forms of childhood abuse, neglect, and household dysfunction. Child abuse & neglect, 2004. 28(7): p. 771–784. [DOI] [PubMed] [Google Scholar]
- 6.Chapman DP, Dube SR, and Anda RF, Adverse childhood events as risk factors for negative mental health outcomes. Psychiatric Annals, 2007. 37(5). [Google Scholar]
- 7.Felitti VJ and Anda RF, The relationship of adverse childhood experiences to adult medical disease, psychiatric disorders, and sexual behavior: Implications for healthcare. The impact of early life trauma on health and disease: The hidden epidemic, 2010: p. 77–87. [Google Scholar]
- 8.Dube SR, et al. , The impact of adverse childhood experiences on health problems: evidence from four birth cohorts dating back to 1900. Preventive medicine, 2003. 37(3): p. 268–277. [DOI] [PubMed] [Google Scholar]
- 9.Smith MV, Gotman N, and Yonkers KA, Early childhood adversity and pregnancy outcomes. Maternal and child health journal, 2016. 20(4): p. 790–798. [DOI] [PMC free article] [PubMed] [Google Scholar]
- 10.Leeners B, et al. , Pregnancy complications in women with childhood sexual abuse experiences. Journal of psychosomatic research, 2010. 69(5): p. 503–510. [DOI] [PubMed] [Google Scholar]
- 11.Selk SC, et al. , An observational study of type, timing, and severity of childhood maltreatment and preterm birth. J Epidemiol Community Health, 2016. 70(6): p. 589–595. [DOI] [PubMed] [Google Scholar]
- 12.Abajobir AA, et al. , Risky sexual behaviors and pregnancy outcomes in young adulthood following substantiated childhood maltreatment: Findings from a prospective birth cohort study. The Journal of Sex Research, 2018. 55(1): p. 106–119. [DOI] [PubMed] [Google Scholar]
- 13.Dubowitz H, et al. , Type and timing of mothers’ victimization: effects on mothers and children. Pediatrics, 2001. 107(4): p. 728–735. [DOI] [PubMed] [Google Scholar]
- 14.Pasalich DS, et al. , Child abuse history in teen mothers and parent–child risk processes for offspring externalizing problems. Child abuse & neglect, 2016. 56: p. 89–98. [DOI] [PubMed] [Google Scholar]
- 15.Cort NA, et al. , Maternal intergenerational transmission of childhood multitype maltreatment. Journal of Aggression, Maltreatment & Trauma, 2011. 20(1): p. 20–39. [Google Scholar]
- 16.Buss C, et al. , Intergenerational transmission of maternal childhood maltreatment exposure: implications for fetal brain development. Journal of the American Academy of Child & Adolescent Psychiatry, 2017. 56(5): p. 373–382. [DOI] [PMC free article] [PubMed] [Google Scholar]
- 17.Widom CS and Wilson HW, Intergenerational transmission of violence, in Violence and mental health. 2015, Springer. p. 27–45. [Google Scholar]
- 18.Roberts AL, et al. , Women’s experience of abuse in childhood and their children’s smoking and overweight. American journal of preventive medicine, 2014. 46(3): p. 249–258. [DOI] [PMC free article] [PubMed] [Google Scholar]
- 19.Moog NK, et al. , Intergenerational effect of maternal exposure to childhood maltreatment on newborn brain anatomy. Biological psychiatry, 2018. 83(2): p. 120–127. [DOI] [PMC free article] [PubMed] [Google Scholar]
- 20.Baumeister D, et al. , Childhood trauma and adulthood inflammation: a meta-analysis of peripheral C-reactive protein, interleukin-6 and tumour necrosis factor-α. Molecular psychiatry, 2016. 21(5): p. 642. [DOI] [PMC free article] [PubMed] [Google Scholar]
- 21.Danese A, et al. , Childhood maltreatment predicts adult inflammation in a life-course study. Proceedings of the National Academy of Sciences, 2007. 104(4): p. 1319–1324. [DOI] [PMC free article] [PubMed] [Google Scholar]
- 22.Danese A, et al. , Biological embedding of stress through inflammation processes in childhood. Molecular psychiatry, 2011. 16(3): p. 244–246. [DOI] [PMC free article] [PubMed] [Google Scholar]
- 23.Carpenter LL, et al. , Association between plasma IL-6 response to acute stress and early-life adversity in healthy adults. Neuropsychopharmacology, 2010. 35(13): p. 2617–2623. [DOI] [PMC free article] [PubMed] [Google Scholar]
- 24.Gouin J-P, et al. , Childhood abuse and inflammatory responses to daily stressors. Annals of Behavioral Medicine, 2012. 44(2): p. 287–292. [DOI] [PMC free article] [PubMed] [Google Scholar]
- 25.Fagundes CP, Glaser R, and Kiecolt-Glaser JK, Stressful early life experiences and immune dysregulation across the lifespan. Brain, behavior, and immunity, 2013. 27: p. 8–12. [DOI] [PMC free article] [PubMed] [Google Scholar]
- 26.Prins JR, Gomez-Lopez N, and Robertson SA, Interleukin-6 in pregnancy and gestational disorders. Journal of reproductive immunology, 2012. 95(1–2): p. 1–14. [DOI] [PubMed] [Google Scholar]
- 27.Curry AE, et al. , First-trimester maternal plasma cytokine levels, pre-pregnancy body mass index, and spontaneous preterm delivery. Acta obstetricia et gynecologica Scandinavica, 2009. 88(3): p. 332–342. [DOI] [PubMed] [Google Scholar]
- 28.Curry AE, et al. , Mid-pregnancy maternal plasma levels of interleukin 2, 6, and 12, tumor necrosis factor-alpha, interferon-gamma, and granulocyte-macrophage colony-stimulating factor and spontaneous preterm delivery. Acta obstetricia et gynecologica Scandinavica, 2007. 86(9): p. 1103–1110. [DOI] [PubMed] [Google Scholar]
- 29.Koçyıgıt Y, et al. , Changes in serum levels of leptin, cytokines and lipoprotein in pre-eclamptic and normotensive pregnant women. Gynecological endocrinology, 2004. 19(5): p. 267–273. [DOI] [PubMed] [Google Scholar]
- 30.Kupferminc MJ, et al. , Tumor necrosis factor-α is elevated in plasma and amniotic fluid of patients with severe preeclampsia. American journal of obstetrics and gynecology, 1994. 170(6): p. 1752–1759. [PubMed] [Google Scholar]
- 31.Daher S, et al. , Cytokines in recurrent pregnancy loss. Journal of Reproductive Immunology, 2004. 62(1–2): p. 151–157. [DOI] [PubMed] [Google Scholar]
- 32.Buka SL, et al. , Maternal cytokine levels during pregnancy and adult psychosis. Brain, behavior, and immunity, 2001. 15(4): p. 411–420. [DOI] [PubMed] [Google Scholar]
- 33.Halonen M, et al. , Perinatal tumor necrosis factor-α production, influenced by maternal pregnancy weight gain, predicts childhood asthma. American journal of respiratory and critical care medicine, 2013. 188(1): p. 35–41. [DOI] [PMC free article] [PubMed] [Google Scholar]
- 34.Lazarides C, et al. , Maternal pro-inflammatory state during pregnancy and newborn leukocyte telomere length: A prospective investigation. Brain, behavior, and immunity, 2019. [DOI] [PMC free article] [PubMed] [Google Scholar]
- 35.Graham AM, et al. , Maternal systemic interleukin-6 during pregnancy is associated with newborn amygdala phenotypes and subsequent behavior at 2 years of age. Biological psychiatry, 2018. 83(2): p. 109–119. [DOI] [PMC free article] [PubMed] [Google Scholar]
- 36.Rudolph MD, et al. , Maternal IL-6 during pregnancy can be estimated from newborn brain connectivity and predicts future working memory in offspring. Nature neuroscience, 2018. 21(5): p. 765–772. [DOI] [PMC free article] [PubMed] [Google Scholar]
- 37.Rasmussen JM, et al. , Maternal Interleukin-6 concentration during pregnancy is associated with variation in frontolimbic white matter and cognitive development in early life. NeuroImage, 2019. 185: p. 825–835. [DOI] [PMC free article] [PubMed] [Google Scholar]
- 38.Cappelletti M, et al. , Inflammation and preterm birth. Journal of leukocyte biology, 2016. 99(1): p. 67–78. [DOI] [PubMed] [Google Scholar]
- 39.Miller GE, et al. , Mothers’ childhood hardship forecasts adverse pregnancy outcomes: role of inflammatory, lifestyle, and psychosocial pathways. Brain, behavior, and immunity, 2017. 65: p. 11–19. [DOI] [PMC free article] [PubMed] [Google Scholar]
- 40.Bublitz M, et al. , Childhood maltreatment and inflammation among pregnant women with gestational diabetes mellitus: a pilot study. Obstetric medicine, 2017. 10(3): p. 120–124. [DOI] [PMC free article] [PubMed] [Google Scholar]
- 41.Bublitz MH, et al. , Childhood adversity, prenatal depression, and maternal inflammation across pregnancy. Obstetric Medicine, 2021: p. 1753495X211011910. [DOI] [PMC free article] [PubMed] [Google Scholar]
- 42.McCormack C, et al. , Maternal childhood adversity and inflammation during pregnancy: Interactions with diet quality and depressive symptoms. Brain, Behavior, and Immunity, 2020. [DOI] [PubMed] [Google Scholar]
- 43.Walsh K, et al. , Associations Among Child Abuse, Depression, and Interleukin 6 in Pregnant Adolescents. Psychosomatic medicine, 2016. 78(8): p. 920. [DOI] [PMC free article] [PubMed] [Google Scholar]
- 44.Mitchell AM, Porter K, and Christian LM, Examination of the role of obesity in the association between childhood trauma and inflammation during pregnancy. Health Psychology, 2018. 37(2): p. 114. [DOI] [PMC free article] [PubMed] [Google Scholar]
- 45.Blackmore ER, et al. , Psychiatric symptoms and proinflammatory cytokines in pregnancy. Psychosomatic medicine, 2011. 73(8): p. 656. [DOI] [PMC free article] [PubMed] [Google Scholar]
- 46.Finy MS and Christian LM, Pathways linking childhood abuse history and current socioeconomic status to inflammation during pregnancy. Brain, behavior, and immunity, 2018. 74: p. 231–240. [DOI] [PMC free article] [PubMed] [Google Scholar]
- 47.Munjiza A, et al. , Higher concentration of interleukin 6-A possible link between major depressive disorder and childhood abuse. Psychiatry research, 2018. 264: p. 26–30. [DOI] [PubMed] [Google Scholar]
- 48.Grosse L, et al. , Cytokine levels in major depression are related to childhood trauma but not to recent stressors. Psychoneuroendocrinology, 2016. 73: p. 24–31. [DOI] [PubMed] [Google Scholar]
- 49.Miller GE and Cole SW, Clustering of depression and inflammation in adolescents previously exposed to childhood adversity. Biological psychiatry, 2012. 72(1): p. 34–40. [DOI] [PMC free article] [PubMed] [Google Scholar]
- 50.De Punder K, et al. , Inflammatory measures in depressed patients with and without a history of adverse childhood experiences. Frontiers in psychiatry, 2018. 9: p. 610. [DOI] [PMC free article] [PubMed] [Google Scholar]
- 51.Danese A, et al. , Elevated inflammation levels in depressed adults with a history of childhood maltreatment. Archives of general psychiatry, 2008. 65(4): p. 409–415. [DOI] [PMC free article] [PubMed] [Google Scholar]
- 52.Alijotas-Reig J, et al. , Tumor necrosis factor-alpha and pregnancy: focus on biologics. An updated and comprehensive review. Clinical reviews in allergy & immunology, 2017. 53(1): p. 40–53. [DOI] [PubMed] [Google Scholar]
- 53.Hunt JS, Expression and regulation of the tumour necrosis factor-alpha gene in the female reproductive tract. Reproduction, fertility and development, 1993. 5(2): p. 141–153. [DOI] [PubMed] [Google Scholar]
- 54.Buss C, Entringer S, and Wadhwa PD, Fetal programming of brain development: intrauterine stress and susceptibility to psychopathology. Science signaling, 2012. 5(245): p. pt7–pt7. [DOI] [PMC free article] [PubMed] [Google Scholar]
- 55.Lindsay KL, et al. , Intergenerational transmission of the effects of maternal exposure to childhood maltreatment on offspring obesity risk: a fetal programming perspective. Psychoneuroendocrinology, 2020. 116: p. 104659. [DOI] [PMC free article] [PubMed] [Google Scholar]
- 56.O’Brien GD, Queenan JT, and Campbell S, Assessment of gestational age in the second trimester by real-time ultrasound measurement of the femur length. American journal of obstetrics and gynecology, 1981. 139(5): p. 540–545. [DOI] [PubMed] [Google Scholar]
- 57.Bernstein DP and Fink L, Childhood trauma questionnaire: A retrospective self-report: Manual. 1998: Harcourt Brace & Company. [Google Scholar]
- 58.Radloff L, The Center for Epidemiological Studies Depression scale (CES-D): A self-report depression scale for research in the general population. Applied Psychological Measures, 1992. 7: p. 343–351. [Google Scholar]
- 59.Vilagut G, et al. , Screening for depression in the general population with the Center for Epidemiologic Studies Depression (CES-D): a systematic review with meta-analysis. PloS one, 2016. 11(5): p. e0155431. [DOI] [PMC free article] [PubMed] [Google Scholar]
- 60.Van Buuren S and Groothuis-Oudshoorn K, mice: Multivariate imputation by chained equations in R. Journal of statistical software, 2011. 45: p. 1–67. [Google Scholar]
- 61.Christian LM and Porter K, Longitudinal changes in serum proinflammatory markers across pregnancy and postpartum: effects of maternal body mass index. Cytokine, 2014. 70(2): p. 134–140. [DOI] [PMC free article] [PubMed] [Google Scholar]
- 62.Winkler G, et al. , Tumor necrosis factor system in insulin resistance in gestational diabetes. Diabetes research and clinical practice, 2002. 56(2): p. 93–99. [DOI] [PubMed] [Google Scholar]
- 63.Kirwan JP, et al. , TNF-α is a predictor of insulin resistance in human pregnancy. Diabetes, 2002. 51(7): p. 2207–2213. [DOI] [PubMed] [Google Scholar]
- 64.Coussons-Read ME, Okun ML, and Nettles CD, Psychosocial stress increases inflammatory markers and alters cytokine production across pregnancy. Brain, behavior, and immunity, 2007. 21(3): p. 343–350. [DOI] [PubMed] [Google Scholar]
- 65.Brown M, Worrell C, and Pariante CM, Inflammation and early life stress: An updated review of childhood trauma and inflammatory markers in adulthood. Pharmacology Biochemistry and Behavior, 2021. 211: p. 173291. [DOI] [PubMed] [Google Scholar]
- 66.Scholaske L, et al. , Maternal subjective social standing is related to inflammation during pregnancy. Brain, behavior, and immunity, 2020. 88: p. 711–717. [DOI] [PMC free article] [PubMed] [Google Scholar]
- 67.Spallek J, et al. , Association of maternal migrant background with inflammation during pregnancy–results of a birth cohort study in Germany. Brain, Behavior, and Immunity, 2021. [DOI] [PMC free article] [PubMed] [Google Scholar]
- 68.Miller GE, et al. , A family-oriented psychosocial intervention reduces inflammation in low-SES African American youth. Proceedings of the National Academy of Sciences, 2014. 111(31): p. 11287–11292. [DOI] [PMC free article] [PubMed] [Google Scholar]
- 69.Hostinar CE, et al. , Additive contributions of childhood adversity and recent stressors to inflammation at midlife: Findings from the MIDUS study. Developmental psychology, 2015. 51(11): p. 1630. [DOI] [PMC free article] [PubMed] [Google Scholar]
- 70.Walker KA, et al. , Systemic inflammation during midlife and cognitive change over 20 years: The ARIC Study. Neurology, 2019. 92(11): p. e1256–e1267. [DOI] [PMC free article] [PubMed] [Google Scholar]
- 71.Bonaccio M, et al. , A score of low-grade inflammation and risk of mortality: prospective findings from the Moli-sani study. Haematologica, 2016. 101(11): p. 1434. [DOI] [PMC free article] [PubMed] [Google Scholar]
- 72.Lahti-Pulkkinen M, et al. , Maternal depression and inflammation during pregnancy. Psychological medicine, 2020. 50(11): p. 1839–1851. [DOI] [PubMed] [Google Scholar]
- 73.Gargano JW, et al. , Mid-pregnancy circulating cytokine levels, histologic chorioamnionitis and spontaneous preterm birth. Journal of reproductive immunology, 2008. 79(1): p. 100–110. [DOI] [PMC free article] [PubMed] [Google Scholar]
- 74.Sun B, et al. , Early pregnancy immune profile and preterm birth classified according to uteroplacental lesions. Placenta, 2020. 89: p. 99–106. [DOI] [PubMed] [Google Scholar]
- 75.Meltzer-Brody S, New insights into perinatal depression: pathogenesis and treatment during pregnancy and postpartum. Dialogues in clinical neuroscience, 2011. 13(1): p. 89. [DOI] [PMC free article] [PubMed] [Google Scholar]
- 76.Beurel E, Toups M, and Nemeroff CB, The bidirectional relationship of depression and inflammation: double trouble. Neuron, 2020. 107(2): p. 234–256. [DOI] [PMC free article] [PubMed] [Google Scholar]
- 77.Gibney SM and Drexhage HA, Evidence for a dysregulated immune system in the etiology of psychiatric disorders. Journal of Neuroimmune Pharmacology, 2013. 8(4): p. 900–920. [DOI] [PubMed] [Google Scholar]
- 78.Baumeister D, et al. , Inflammatory biomarker profiles of mental disorders and their relation to clinical, social and lifestyle factors. Social psychiatry and psychiatric epidemiology, 2014. 49(6): p. 841–849. [DOI] [PubMed] [Google Scholar]
- 79.Danese A and Baldwin JR, Hidden wounds? Inflammatory links between childhood trauma and psychopathology. Annual review of psychology, 2017. 68: p. 517–544. [DOI] [PubMed] [Google Scholar]
- 80.Heim C, et al. , The link between childhood trauma and depression: insights from HPA axis studies in humans. Psychoneuroendocrinology, 2008. 33(6): p. 693–710. [DOI] [PubMed] [Google Scholar]
- 81.Serafini G, et al. , The role of inflammatory cytokines in suicidal behavior: a systematic review. European Neuropsychopharmacology, 2013. 23(12): p. 1672–1686. [DOI] [PubMed] [Google Scholar]
- 82.Das A, Psychosocial distress and inflammation: Which way does causality flow? Social Science & Medicine, 2016. 170: p. 1–8. [DOI] [PubMed] [Google Scholar]
- 83.Moriarity DP, et al. , Bidirectional associations between inflammatory biomarkers and depressive symptoms in adolescents: potential causal relationships. Clinical Psychological Science, 2020. 8(4): p. 690–703. [DOI] [PMC free article] [PubMed] [Google Scholar]
- 84.Danese A and Lewis JS, Psychoneuroimmunology of Early-Life Stress: The Hidden Wounds of Childhood Trauma? Neuropsychopharmacology, 2017. 42(1): p. 99–114. [DOI] [PMC free article] [PubMed] [Google Scholar]
- 85.Entringer S, Childhood abuse accelerates inflammaging. Brain, behavior, and immunity, 2021. 94: p. 25–26. [DOI] [PubMed] [Google Scholar]
- 86.Heim CM, Entringer S, and Buss C, Translating basic research knowledge on the biological embedding of early-life stress into novel approaches for the developmental programming of lifelong health. Psychoneuroendocrinology, 2019. 105: p. 123–137. [DOI] [PMC free article] [PubMed] [Google Scholar]
- 87.Danese A and McEwen BS, Adverse childhood experiences, allostasis, allostatic load, and age-related disease. Physiol Behav, 2012. 106(1): p. 29–39. [DOI] [PubMed] [Google Scholar]
- 88.Franceschi C and Campisi J, Chronic inflammation (inflammaging) and its potential contribution to age-associated diseases. Journals of Gerontology Series A: Biomedical Sciences and Medical Sciences, 2014. 69(Suppl_1): p. S4–S9. [DOI] [PubMed] [Google Scholar]
- 89.Pariante CM and Lightman SL, The HPA axis in major depression: classical theories and new developments. Trends in neurosciences, 2008. 31(9): p. 464–468. [DOI] [PubMed] [Google Scholar]
- 90.Nikkheslat N, et al. , Childhood trauma, HPA axis activity and antidepressant response in patients with depression. Brain, behavior, and immunity, 2020. 87: p. 229–237. [DOI] [PMC free article] [PubMed] [Google Scholar]
- 91.Binder EB, et al. , Association of FKBP5 polymorphisms and childhood abuse with risk of posttraumatic stress disorder symptoms in adults. Jama, 2008. 299(11): p. 1291–1305. [DOI] [PMC free article] [PubMed] [Google Scholar]
- 92.Gillespie CF, et al. , Risk and resilience: genetic and environmental influences on development of the stress response. Depression and anxiety, 2009. 26(11): p. 984–992. [DOI] [PMC free article] [PubMed] [Google Scholar]
- 93.Bradley RG, et al. , Influence of child abuse on adult depression: moderation by the corticotropin-releasing hormone receptor gene. Archives of general psychiatry, 2008. 65(2): p. 190–200. [DOI] [PMC free article] [PubMed] [Google Scholar]
- 94.Caspi A, et al. , Role of genotype in the cycle of violence in maltreated children. Science, 2002. 297(5582): p. 851–854. [DOI] [PubMed] [Google Scholar]
- 95.Belsky J and Pluess M, Beyond diathesis stress: differential susceptibility to environmental influences. Psychological bulletin, 2009. 135(6): p. 885. [DOI] [PubMed] [Google Scholar]
- 96.Poole JC, Dobson KS, and Pusch D, Childhood adversity and adult depression: the protective role of psychological resilience. Child abuse & neglect, 2017. 64: p. 89–100. [DOI] [PubMed] [Google Scholar]
- 97.Campbell-Sills L, Cohan SL, and Stein MB, Relationship of resilience to personality, coping, and psychiatric symptoms in young adults. Behaviour research and therapy, 2006. 44(4): p. 585–599. [DOI] [PubMed] [Google Scholar]
- 98.Wingo AP, et al. , Moderating effects of resilience on depression in individuals with a history of childhood abuse or trauma exposure. Journal of affective disorders, 2010. 126(3): p. 411–414. [DOI] [PMC free article] [PubMed] [Google Scholar]
- 99.Seok J-H, et al. , Impact of early-life stress and resilience on patients with major depressive disorder. Yonsei medical journal, 2012. 53(6): p. 1093–1098. [DOI] [PMC free article] [PubMed] [Google Scholar]
- 100.Low CA, Matthews KA, and Hall M, Elevated CRP in adolescents: roles of stress and coping. Psychosomatic medicine, 2013. 75(5): p. 449. [DOI] [PMC free article] [PubMed] [Google Scholar]
- 101.Gouin J-P, et al. , Resilience resources moderate the association of adverse childhood experiences with adulthood inflammation. Annals of Behavioral Medicine, 2017. 51(5): p. 782–786. [DOI] [PubMed] [Google Scholar]
- 102.Miller GE, Chen E, and Parker KJ, Psychological stress in childhood and susceptibility to the chronic diseases of aging: moving toward a model of behavioral and biological mechanisms. Psychological bulletin, 2011. 137(6): p. 959. [DOI] [PMC free article] [PubMed] [Google Scholar]
- 103.Chen E, et al. , Maternal warmth buffers the effects of low early-life socioeconomic status on pro-inflammatory signaling in adulthood. Molecular psychiatry, 2011. 16(7): p. 729–737. [DOI] [PMC free article] [PubMed] [Google Scholar]
- 104.Evans GW, et al. , Cumulative risk, maternal responsiveness, and allostatic load among young adolescents. Developmental psychology, 2007. 43(2): p. 341. [DOI] [PubMed] [Google Scholar]
- 105.Luecken LJ and Appelhans BM, Early parental loss and salivary cortisol in young adulthood: the moderating role of family environment. Development and psychopathology, 2006. 18(1): p. 295–308. [DOI] [PubMed] [Google Scholar]
- 106.Miller GE, et al. , Pathways to resilience: Maternal nurturance as a buffer against the effects of childhood poverty on metabolic syndrome at midlife. Psychological science, 2011. 22(12): p. 1591–1599. [DOI] [PMC free article] [PubMed] [Google Scholar]
- 107.Fritz J, et al. , A systematic review of amenable resilience factors that moderate and/or mediate the relationship between childhood adversity and mental health in young people. Frontiers in psychiatry, 2018. 9: p. 230. [DOI] [PMC free article] [PubMed] [Google Scholar]
- 108.Hardt J and Rutter M, Validity of adult retrospective reports of adverse childhood experiences: review of the evidence. Journal of child psychology and psychiatry, 2004. 45(2): p. 260–273. [DOI] [PubMed] [Google Scholar]
- 109.Marcus SM, et al. , Depressive symptoms among pregnant women screened in obstetrics settings. Journal of women’s health, 2003. 12(4): p. 373–380. [DOI] [PubMed] [Google Scholar]
- 110.Schmidt MR, et al. , Childhood maltreatment on the Adverse Childhood Experiences (ACEs) Scale versus the Childhood Trauma Questionnaire (CTQ) in a perinatal sample. Journal of Aggression, Maltreatment & Trauma, 2020. 29(1): p. 38–56. [Google Scholar]
- 111.Moog NK, et al. , The challenge of ascertainment of exposure to childhood maltreatment: Issues and considerations. Psychoneuroendocrinology, 2020: p. 105102–105102. [DOI] [PMC free article] [PubMed] [Google Scholar]
- 112.Bernstein DP, et al. , Initial reliability and validity of a new retrospective measure of child abuse and neglect. The American journal of psychiatry, 1994. [DOI] [PubMed] [Google Scholar]
Associated Data
This section collects any data citations, data availability statements, or supplementary materials included in this article.