

Abstract
Due to the overexploitation of farming, as well as habitat destruction, the wild population of Chinese giant salamander (CGS) Andrias davidianus, a species with seven genetically distinct lineages, has decreased by over 80% in the past 70 years. Traditional survey methods have proven to be unsuitable for finding this rare and elusive species. We evaluated the efficacy of environmental DNA (eDNA) sampling to detect CGS indirectly from its aquatic environment. We developed several species-specific primer sets; validated their specificity and sensitivity; and assessed their utility in silico, in the laboratory, and at two field sites harboring released farm-bred CGS. We detected the presence of CGS DNA by using polymerase chain reaction and Sanger sequencing. We also sequenced an amplicon mixture of seven haplotype-represented samples using high-throughput sequencing. Our eDNA methods could detect the presence of CGS at moderate densities reported across its range, proving them as a cost-effective way to establish broad-scale patterns of occupancy for CGS. In addition, our primers enabled the detection of mitochondrial lineage mixture or introduced individuals from geographically isolated populations of CGS.
Keywords: Andrias davidianus, Chinese giant salamander, eDNA, metabarcoding, population survey
Chinese giant salamander (CGS) Andrias davidianus is the largest amphibian in the world. As a classic living fossil, its anatomical structure has remained almost unchanged for 160 million years (Gao and Shubin 2003). Genetic data suggests that CGS consists of seven genetically distinct, but morphologically similar, lineages (Yan et al. 2018; Liang et al. 2019), some of which warrant species-level recognition (Turvey et al. 2019). This species was once widely distributed in the watersheds of Pearl, Yangtze, and Yellow Rivers in central and southern China (Fei et al. 2006). However, due to the overexploitation of farming, as well as habitat loss and degradation, the wild population has decreased by over 80% in the past 70 years (Zhang et al. 2002; Turvey et al. 2018). In contrast, 2,080 CGS farms were licensed, and up to 12,490,000 individuals were farmed across the country (China Aquatic Wildlife Conservation 2015). Government-promoted conservation translocations have been conducted in 16 provinces or municipalities since 2002 (Shu et al. 2021). Distinct genetic lineages that historically occupied different geographic ranges have become admixed in the wild, raising concerns about the loss of genetic diversity within wild populations (Wang 2015; Yan et al. 2018; Shu et al. 2021). CGS is listed as critically endangered on the IUCN Red List and China’s Vertebrates Red List (Jiang et al. 2016), and it has also been listed as national Grade II protected wild animal since 1989. Globally, CGS has drawn the world’s conservation concern as one of the top Evolutionarily Distinct and Critically Endangered animals (Isaac et al. 2012). There is an urgent need for population monitoring and genetic risk assessment of CGS.
The traditional labor-intensive methods for surveying CGS populations, including snorkeling, bow-hooking, trapping, and mist-netting (Browne 2011), rely on visual counts of individuals, and they have proven to be unsuitable for finding rare giant salamanders. No wild ones were observed in an 82-day survey conducted in core habitats in the period 2000–2001 (Wang et al. 2004). Fifteen years later, only one juvenile was found in a 68-day survey by spot-light snorkeling and trapping in Sichuan province and Chongqing city (Wang 2015), and only 24 individuals were found in a 4-year range-wide survey (97 sites) (Turvey et al. 2018). Therefore, the development of an efficient survey method is highly desirable.
The use of environmental DNA (eDNA) and metabarcoding has been shown to offer increased sampling resolution for species detection and biodiversity assessment (Sepulveda et al. 2020). Sources of eDNA include sloughed hair and skin, urine, feces, gametes, saliva, mucus, decomposing carcasses, and animal-feeding invertebrate samplers (Harrison et al. 2019; Drinkwater et al. 2021), and could consist of both free molecules (extracellular DNA) and free cells (Turner et al. 2014; Sassoubre et al. 2016; Moushomi et al. 2019; Jo et al. 2019a). Furthermore, eDNA collected from water samples has highly sensitive detection capabilities, is non-invasive to sampled biota, and is not limited to physical environmental conditions (e.g., hydrogeomorphic features or substrate types). It is important to note that eDNA capture can differ between environment types (Collins et al. 2018; Seymour et al. 2018) and within sites (Bista et al. 2017), due to seasonal variation, ecology, or random sample variation. Coupled with high-throughput sequencing (HTS) applications, such as metabarcoding, eDNA-based sampling is rapidly being integrated into the standard ecological monitoring of reclusive, inaccessible, or dangerous taxa when other survey methods are impractical (Jerde et al. 2011; Deiner et al. 2016; Boussarie et al. 2018).
eDNA primers have been developed for surveying closely related species, including the Japanese giant salamander (JGS) Anadrias japonicus and the hellbender Cryptobranchus alleganiensis (Olson et al. 2012; Fukumoto et al. 2015; Takahashi et al. 2018; Wineland et al. 2019), as well as non-native populations of CGS that exist in Japan (Fukumoto et al. 2015). However, an eDNA primer set for detecting all lineages of CGS is still deficient. Here, we developed one and evaluated its efficiency in silico, in the laboratory, and at field sites. Our primer set is the first to allow the identification of all lineages of CGS across its range. This metabarcoding tool will be invaluable for the population monitoring and conservation of the world’s largest, elusive, and endangered amphibian.
Materials and Methods
Primer development and evaluation
To develop primers that would universally amplify all lineages of CGS, we built a large database of mitochondrial sequences that represented the overall genetic background of wild populations. We downloaded 720 nucleotide sequences whose definition contained the words “Andrias davidianus” and “mitochondrial” or “mitochondrion” from the GenBank database of the National Center for Biotechnology Information (NCBI). Most of these sequences, for wild-born or historical specimens, were originally collected to clarify the spatial genetic structure and taxonomy of CGS (Murphy et al. 2000; Wang et al. 2017; Yan et al. 2018; Liang et al. 2019; Turvey et al. 2019). We manually checked the voucher numbers of specimens and filtered out 16 duplicate sequences. The final dataset consisted of 704 sequences, including 29 complete and 17 partial mitogenomes.
To assess mitogenome variation, a complete mitogenomic sequence with the GenBank accession code of NC_004926 (Zhang et al. 2003) was selected as a reference. The other 703 sequences in the dataset were mapped to this reference using bowtie2 in “-very-sensitive-local” mode (Langmead and Salzberg 2012), and the depth option of Samtools v1.9 (Li et al. 2009) was used to assess the sequence coverage at each site. Next, sequences were mapped to the reference using BWA-MEM v0.7.17 (Li 2013) and then called single-nucleotide polymorphism (SNP) density using bcftools v1.9 (Danecek and McCarthy 2017) and VCFtools v0.1.16 (Danecek et al. 2011). Mitogenomic architecture, sequence coverage, and SNP density were plotted using Circos v0.69.9 (Krzywinski et al. 2009).
The mitochondrial Cytochrome b (Cytb) gene, with a medium rate of evolution (Zhang et al. 2003; Mueller 2006), is widely targeted for the development of eDNA-based assays in amphibians (Thomsen et al. 2012; Spear et al. 2015; Evans et al. 2016; Wineland et al. 2019). A suite of primer sets with amplicon lengths of 90–250 base pairs (bp) was developed using the software Primer5 (Lalitha 2000). Primer sets that targeted annealing sites containing SNPs were abandoned.
Non-specific targets of primers were checked using the primer-BLAST option in NCBI and by cross-species amplification of sympatric amphibians (Supplementary Table S1). Additionally, the reliability and universality of primers were tested on 22 DNA samples from the Gutian Mountain National Nature Reserve (GMNNR), Kaihua County, Zhejiang province (Supplementary Table S2).
For each primer set, the efficiency and lowest threshold of amplification were tested by triple polymerase chain reaction (PCR) trials with a concentration of template DNA ranging from 0.1 to 1 × 10⁻¹¹ ng⋅µL−1. The primer set of Ad_Cytb_e1 was advanced for use in the remainder of the study as it provided the most efficient and reliable amplification. The best PCR profile was 25 µL in total, including 10 µL mix (TransGen Biotech Co., Ltd., Beijing); 12 µL ddH2O; 0.5 µL forward and reverse primer, respectively; and 2 µL template DNA. The reaction was pre-PCR for 4 min at 94°C; 35 cycles of denaturation at 95°C for 40 s, annealing at 51.2°C for 60 s, and extension at 72°C for 30 s; and post-PCR at 72°C for 8 min.
Laboratory trial
Prior to the field trial, the eDNA methods were tested on water samples from the Pidu Captive-Breeding Farm of CGS. In total, one hundred 3-year-old individuals with snout–vent lengths of 20–30 cm were raised in each pool (physical dimensions = 1 m × 1 m × 0.9 m; water volume based on fill depth ∼ 400 L). Each pool had a constant input–output flow, resulting in one total water change per 24 h. Two 4.5 L water samples were collected from each pool using polyethylene terephthalate drinking bottles. Such containers, which are cheap and readily available in China, are sterilized following standards for food processing.
Samples from each pool were combined for filtering using a sterile 0.45-μm pore size cellulose acetate and cellulose nitrate mixed membrane and a vacuum pump system (Tianjin Jinteng Experiment Instrument Co., Ltd.) during 6 h of sampling (Maruyama et al. 2014). Filtration occurred in areas where no CGS existed, and we changed gloves between each filtering. The filter membrane was then kept in 95% ethanol in a 2 mL EP tube and stored at −20°C in the laboratory until DNA extraction.
DNA was extracted from each membrane using the TIANamp Genomic DNA Kit (TIANGEN Biotech Co., Ltd., Beijing) following the manufacturer’s instructions. For each water sample, we assayed for the presence of eDNA by scoring 5 PCRs: 3 replicate reactions incorporating the sample being tested, 1 negative control reaction in which we added water in place of the template, and 1 positive control reaction in which we added 0.01 ng of muscle-derived CGS DNA. PCR products were visualized on 1.2% (w/v) BBI agarose gels (Sangon Biotech Co., Ltd., Shanghai). DNA extraction and amplification were conducted in different laboratories where no CGS experiments had been conducted previously (Taberlet et al. 1999).
Field test
The Dujiangyan Release Base (DRB) and the GMNNR, which harbored released captive-bred CGS, were selected for our field test. Seventy salamanders were released in the period 2017–2018 along a 1 km length of stream (stream width 5–8 m) at DRB, and 4,532 salamanders were released in the period 2015–2016 along a 2 km length of stream (stream width 2–10 m) in GMNNR. Salamanders at both sites were monitored monthly by a line-transect survey, radio-telemetry tracking, and trapping. A total of 22 and 9 individuals were captured in September of 2018 and 2019 in GMNNR, respectively (Liu et al. 2021). The density of salamanders was calculated as the number of individuals found per m2 (i.e., stream length × width) (Olson et al. 2012).
Water samples (each is two 4.5 L combined) were collected in September 2019, from DRB (n = 7) and GMNNR (n = 15), every 150 m and 100 m, respectively. The containers were submerged 1–2 inches below the surface of the stream for sampling. The samples were then assayed in the same way as in laboratory trials.
Quality assurance
As contamination is a concern in presence–absence genetic studies, in particular eDNA studies, ultrapure water was filtered in the field and tested along with other filters to allow us to identify any equipment or background contamination. All equipment was sterilized using a 5-min exposure to a 10% bleach solution before sampling. Scissors, tweezers, EP tubes, pipettes, tips, and glass cores of vacuum pumps were sterilized at 121°C for 30 min before use. The work area was cleaned using RNase, DNase, RNA, and DNA Away Reagent (Beyotime Biotechnology, Shanghai).
Each eDNA sample was PCR-amplified in triplicate to account for stochasticity in amplifications of low-quality/quantity DNA. A clear gel band in any replicate indicated a positive amplification, which was purified and then subjected to Sanger sequencing. The likely origin of each amplified sequence was determined by a BLAST search in the NCBI non-redundant database, with the top-hit species (based on e-value) representing its origin.
Next-generation sequencing of a lineage-mixed sample
A mock sample was used to test whether all CGS lineages could be detected simultaneously with HTS. First, the cytb gene of 341 tissue or swab samples, which were either collected in this study or previously (Wang et al. 2013, 2017; Yan et al. 2018), were sequenced following the procedure of Tao et al. (2006). These sequences, together with those retrieved from GenBank, were aligned by ClustalW implemented in Mega v7.0 (Kumar et al. 2016), truncated by Ad_Cytb_e1 primers, and then collapsed to identify haplotypes. Second, seven genomic DNA samples that could represent the haplotypes and mitochondrial lineages of CGS (Yan et al. 2018; Liang et al. 2019) were selected and amplified using primers with sample-specific 6 bp barcodes. Third, 2 µg of PCR products for each sample was mixed as a mock sample and sequenced using paired-end 150 bp reads in a NovaSeq 6000 System. Fourth, the paired-end reads were merged using PEAR software (Zhang et al. 2014) with the parameters of -v 30 -n 236 -m 236 -t 86, filtered using the fastq_quality_filter function (-q 30 -p 90), and split into original samples using the fastx_barcode_splitter.pl function of fastx_toolkit (http://hannonlab.cshl.edu/fastx_toolkit/download.html). Fifth, target or non-target sequences of each haplotype were counted with seqkit software (Shen et al. 2016), and their likely origin was determined using a BLAST search in GenBank.
All specimen sampling and field surveys were carried out following Animal Use Protocols approved by the Animal Ethics and Welfare Committee of Chengdu Institute of Biology (permit code 2016-AR-JJP-02).
Results
Of the 704 mitochondrial sequences that were retrieved from GenBank, 570 were identified as containing a whole or partial Cytb gene. Compared to the other genes, Cytb had the highest sequence coverage and modest SNP density (Supplementary Figure S3), and was chosen as the target for eDNA amplification as its primer-binding sites were conserved across, and largely unique to, CGS (Supplementary Figure S4).
Only 5 primer sets, including 5 forward and 2 reverse primers, passed the initial tests and were retained for downstream analysis (Table 1). The primer set Ad_Cytb_e1 showed the most efficient amplification, with the lowest eDNA concentration for detection of 1.3 × 10⁻⁷ ng⋅µL−1 (Figure 1). It had a degenerate site (A/C) in the forward primer (Supplementary Figure S4).
Table 1.
eDNA primer sets for the Chinese giant salamander
| Primer | Sequence (5′ –3′) | Annealing temperature (°C) | Product length (bp) |
|---|---|---|---|
| Ad_Cytb_e1_f | TCTTCAGCATTTTCATCMGTGG | 51.2 | 224 |
| Ad_Cytb_e1_r | GGAAGGACATAACCAACAAAAGC | ||
| Ad_Cytb_e2_f | GATGTAAACTATGGCTGG | 47.5 | 158 |
| Ad_Cytb_e2_r | ATTACTAAGAATAGGAGAAC | ||
| Ad_Cytb_e3_f | GAGATGTAAACTATGGCT | 47.5 | 160 |
| Ad_Cytb_e2_r | ATTACTAAGAATAGGAGAAC | ||
| Ad_Cytb_e4_f | TGCCGAGATGTAAACTAT | 47.5 | 164 |
| Ad_Cytb_e2_r | ATTACTAAGAATAGGAGAAC | ||
| Ad_Cytb_e5_f | CCGAGATGTAAACTATGG | 47.5 | 162 |
| Ad_Cytb_e2_r | ATTACTAAGAATAGGAGAAC |
Ad_Cytb_e1 showed superior performance and was used for all downstream analyses.
M: indicates A or T.
Figure 1.
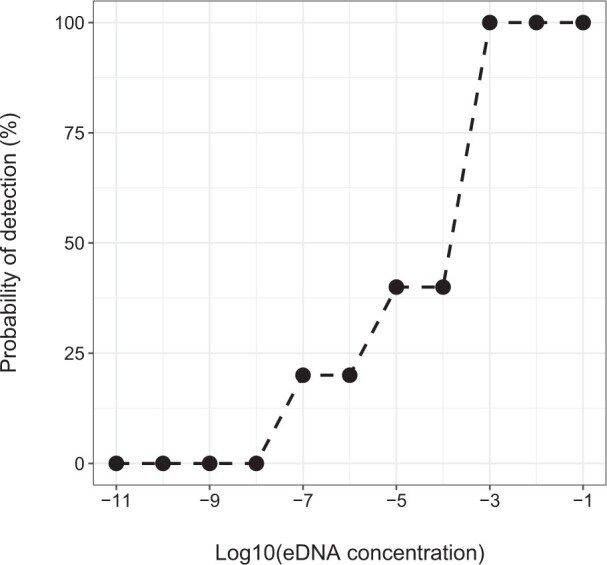
Detection probability of eDNA primer set Ad_Cytb_e1 based on DNA concentration (5 PCR replicates).
Primer-BLAST analysis showed that all GenBank sequences that have 100% identity with Ad_Cytb_e1 were from CGS. Two sequences of JGS (GenBank accession codes: AB445781 and AB445779) were identified with one or two nucleotide mismatches in the forward binding region and could be amplified by Ad_Cytb_e1 (Supplementary Figure S5). The seven sympatric amphibian species were not amplified by Ad_Cytb_e1. The detection probability was 100% for all four ponds in the Pidu Farm (Table 2), but decreased to 85.7% (n = 7) at DRB, and further decreased to 20% (n = 15) in GMNNR.
Table 2.
Aquatic eDNA detection for CGS in a farm and two field sites
| Sampling sites | Water temperature (°C) | pH value | Elevation (m) |
Riverbed or pool bottom | Density of CGS (indiv./m2) | Sampling date | Sampling strategy | Detection probability |
|---|---|---|---|---|---|---|---|---|
| Pidu Farm | 22.0–22.9 | 8.0–8.0 | 540 | Ceramic tile | 100 | 2018.10.17 | 1 sample per pool | 100% (n = 4) |
| Dujiangyan Release Base (DRB) | 17.5–18.3 | 8.5–8.6 | 789–829 | Cobble | 0.014a | 2019.9.18 | Every 150 m | 85.7% (n = 7) |
| Gutian Mountain National Nature Reserve (GMNNR) | 19.0–22.5 | 7.0–8.8 | 362–465 | Cobble, humus | 0.002b | 2019.9.5–10 | Every 100 m | 20% (n = 15) |
Estimated according to releasing records (70 individuals released in 1-km stream length; stream width: 5–8 m).
Estimated according to our survey records (9 individuals found in 2-km stream length; stream width: 2–10 m).
Eleven haplotypes were identified for the amplified fragments of Ad_Cytb_e1 (Supplementary Figure S3). HTS of the amplicon mixture indicated that all the seven haplotypes were detected (Figure 2 and Table 3). Each haplotype was sequenced with 89,744–252,789 paired-end reads, covering a proportion of 8.6–24.2% in total. Target sequences covered 91.49 ± 2.87% (mean ± standard deviation) of reads in each sample (Figure 2), showing that Ad_Cytb_e1 has a high degree of generality in amplifying different lineages of CGS. Non-target sequences had a range of 4.9–13.2% of reads for each sample and 1–27 bp mismatches to the true haplotype (Supplementary Table S6), indicating PCR or sequencing errors.
Figure 2.
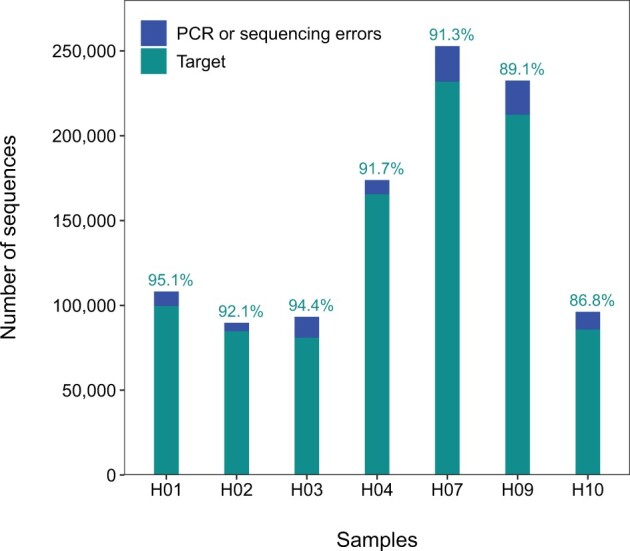
Composition of amplicons detected by HTS. Each of the seven samples has one target haplotype (in cyan color), whereas blue color indicates non-target sequences (i.e., errors introduced during PCR or sequencing). H10 corresponds to the lineage D in Yan et al. (2018) and Andrias sligoi in Turvey et al. (2019).
Table 3.
Haplotypes and corresponding lineages detected in the mock sample using HTS
| Lineagea | Haplotypeb | DNA sample | Collection site | Barcode sequence for forward primer | Barcode sequence for reverse primer | GenBank accession code | Paired- end reads |
|---|---|---|---|---|---|---|---|
| C | H04 | SCDJY4 | Pidu, Sichuan province | ATCACG | ACTGAT | MZ291454 | 173,892 |
| B | H01 | SCDJY8 | Pidu, Sichuan province | CGATGT | ATGAGC | MZ291455 | 108,112 |
| B | H02 | ZJGTS2 | Gutian, Zhejiang province | TTAGGC | ATTCCT | MZ291457 | 89,744 |
| B | H07 | ZJGTS5 | Gutian, Zhejiang province | ACAGTG | CAACTA | MZ291458 | 252,789 |
| U1 | H09 | ZJGTS10 | Gutian, Zhejiang province | GCCAAT | CACCGG | MZ291459 | 232,457 |
| D | H10 | GD19 | Guiding, Guizhou province | CAGATC | CACGAT | MZ291460 | 96,134 |
| B | H03 | SXLY6538 | Lueyang, Shaan'xi province | GGCTAC | CATTTT | MZ291456 | 93,215 |
Lineage is identified as Yan et al. (2018). Lineage D corresponds to Andrias sligoi in Turvey et al. (2019).
Haplotype is identified as Supplementary Figure S4.
Discussion
The identification of DNA sequences derived from environmental samples heavily depends on reliable reference databases (Thomsen and Willerslev 2015). CGS has a wide geographic range and high genetic variability (Wang et al. 2017; Yan et al. 2018; Liang et al. 2019), and one of its mitochondrial lineages was regarded as a separate species, Andrias sligoi (Turvey et al. 2019). Fortunately, a large number of Cytb sequences were deposited in GenBank and collected from a much wider range (Murphy et al. 2000; Yan et al. 2018; Turvey et al. 2019). Therefore, in addition with our own 341 Cytb sequences as a reference, we could develop an eDNA tool to strike the balance between the specificity (targeting CGS solely) and generality (targeting all divergent CGS lineages) of detection.
Our eDNA primer set is an improvement over that of Fukumoto et al. (2015), which targeted the mitochondrial NADH1 gene and was designed to survey the introduced CGS and its hybrids with the indigenous JGS in Japan. The NADH1 primer binding sites matched many, but not all known sequences of CGS. Our eDNA primer set may be able to detect some populations of JGS, as sequences that differ in 1 or 2 bp across the primer-binding sites could be amplified (Supplementary Figure S5). Since JGS has not been documented to exist in China, this will not diminish the utility of our eDNA primer set for the detection of CGS across its native range.
Both abiotic and biotic conditions could influence eDNA persistence and concentration (Barnes and Turner 2016). For example, no correlation was found between eDNA estimates and the abundance or biomass of hellbender, but eDNA concentrations and thus detection probability was highest during the September breeding season (Spear et al. 2015; Takahashi et al. 2018). Water temperature facilitated eDNA degradation and accumulation simultaneously: the higher eDNA decay rates could reflect the activity and abundance of microbes and extra-organism nucleases in the water, and the higher eDNA shedding rates might due to the higher metabolism and physiological activity of organisms (Jo et al. 2019b). In this study, we revealed the presence of higher negative reactions in GMNNR than at DRB. The possibility of lower population densities (Table 2) as well as lower eDNA concentration of CGS in GMNNR should be subjects of future studies.
eDNA-based surveys can lead to underestimating the distribution of a species due to erroneous detection during field work (e.g., water sampling) or during laboratory analysis (e.g., PCR). Filtration with a 0.2-μm pore size was the best strategy for maximizing eDNA and minimizing non-target eDNA (Turner et al. 2014), but this may increase the filtration time and risk of filter clogging. Humic acids or humic substances, co-extracted with DNA in environmental samples, strongly inhibit enzymes, such as Taq Polymerase used in PCR amplification (Matheson et al. 2010; Sidstedt et al. 2015). Quantitative PCR and droplet digital PCR appear to be more sensitive than conventional PCR for single species detection (Wilcox et al. 2013; Doi et al. 2015). In the future, we will continue to optimize this eDNA technique and assess whether improved sensitivity could be achieved using other protocols, for example, by changing water volume and/or pore size, the use of ATL as an eDNA storage buffer, and the use of PCR inhibitor removal kits. Considering the low detection rate of 20% in some sites such as Gutian Mountain, a minimum of five samples in a field site and the adoption of appropriate statistical methods, such as site occupancy models (Schmidt et al. 2013), should increase the likelihood of occupancy detection for CGS across its range.
Translocations were proposed as a way of conserving biodiversity, particularly in the management of threatened and keystone species, with the aims of maintaining biodiversity and ecosystem function under the combined pressures of habitat fragmentation and climate change (Weeks et al., 2011). To protect the world’s largest amphibian and the apex predator in freshwater ecosystem, government-promoted translocations have been conducted across its range since 2002 (Shu et al. 2021). However, the geographically distinct evolutionary lineages were brought into contact, and lineage mixtures have been found both in farms (Yan et al. 2018) and in the wild (Shu et al. 2021). Our eDNA primer successfully detected four of the seven genetically distinct lineages simultaneously (Figure 2), demonstrating that it could be used to identify the presence of mitochondrial lineage admixtures in captive and wild populations of CGS. This will facilitate genetic screening and genetically informed conservation efforts when combined with the metabarcoding tool of multi-copy nuclear eDNA (e.g., ribosome RNA genes) in the future.
Acknowledgements
The author would like to thank Yuzhou Gong, Guocheng Shu, Tian Zhao, Xiaoxiao Shu, Yinmeng Hou, Xiuqin Lin, Puyang Zheng, Wei Luo, Zening Chen, Chunlin Zhao, Mingyang Cheng, Liming Chang, Luyao Xiao, Yuanfei Wang, and Shan Xiong for their help in facilitating experiments. We gratefully acknowledge Zhiqiang Wu, Guangpu Zhang, and Jiongyu Liu for their expertise in facilitating data analysis, and Rachel Lockridge Mueller, Cheng Sun, Paul Ode, and four anonymous reviewers for insightful suggestions for improving the manuscript.
Funding
This work was funded by the National Key Program of Research and Development (2016YFC0503200), the National Natural Science Foundation of China (31570391, 31200411), the Biodiversity Survey and Assessment Project of the Ministry of Ecology and Environment (2019HJ2096001006), the Construction of Basic Conditions Platform of Sichuan Science and Technology Department (2019JDPT0020), the China Biodiversity Observation Networks (Sino BON – Amphibian & Reptile).
Authors’ contributions
This study is P.L.'s MSc thesis work under the supervision of J.W. and F.X. P.L. conducted field survey, laboratory work, and data analysis. J.C. and C.L. contributed to data analysis. J.W., F.X. and J.J. contributed to conceptualization, formal analysis, and writing. All authors have read and approved the manuscript for submission.
Conflict of interest statement
The authors declare that there is no conflict of interest.
Supplementary Material
Supplementary material can be found at https://academic.oup.com/cz.
Data Availability Statement
The raw high-throughput sequence data has been deposited in the Genome Sequence Archive at the National Genomics Data Center (CRA004266) and is publicly accessible at https://bigd.big.ac.cn/gsa.
Supplementary Material
Contributor Information
Jie Wang, CAS Key Laboratory of Mountain Ecological Restoration and Bioresource Utilization & Ecological Restoration Biodiversity Conservation Key Laboratory of Sichuan Province, Chengdu Institute of Biology, Chinese Academy of Sciences, Chengdu 610041, China.
Ping Liu, CAS Key Laboratory of Mountain Ecological Restoration and Bioresource Utilization & Ecological Restoration Biodiversity Conservation Key Laboratory of Sichuan Province, Chengdu Institute of Biology, Chinese Academy of Sciences, Chengdu 610041, China.
Jiang Chang, State Key Laboratory of Environmental Criteria and Risk Assessment, Chinese Research Academy of Environmental Sciences, Beijing 100012, China.
Cheng Li, CAS Key Laboratory of Mountain Ecological Restoration and Bioresource Utilization & Ecological Restoration Biodiversity Conservation Key Laboratory of Sichuan Province, Chengdu Institute of Biology, Chinese Academy of Sciences, Chengdu 610041, China.
Feng Xie, CAS Key Laboratory of Mountain Ecological Restoration and Bioresource Utilization & Ecological Restoration Biodiversity Conservation Key Laboratory of Sichuan Province, Chengdu Institute of Biology, Chinese Academy of Sciences, Chengdu 610041, China.
Jianping Jiang, CAS Key Laboratory of Mountain Ecological Restoration and Bioresource Utilization & Ecological Restoration Biodiversity Conservation Key Laboratory of Sichuan Province, Chengdu Institute of Biology, Chinese Academy of Sciences, Chengdu 610041, China.
References
- Barnes MA, Turner CR, 2016. The ecology of environmental DNA and implications for conservation genetics. Conserv Genet 17:1–17. [Google Scholar]
- Bista I, Carvalho GR, Walsh K, Seymour M, Hajibabaei M. et al., 2017. Annual time-series analysis of aqueous eDNA reveals ecologically relevant dynamics of lake ecosystem biodiversity. Nat Commun 8:14087. [DOI] [PMC free article] [PubMed] [Google Scholar]
- Boussarie G, Bakker J, Wangensteen OS, Mariani S, Bonnin L. et al., 2018. Environmental DNA illuminates the dark diversity of sharks. Sci Adv 4:eaap9661. [DOI] [PMC free article] [PubMed] [Google Scholar]
- Browne R, Li H, Mcginnity D, Okada S, Wang ZH, et al., 2011. Survey techniques for giant salamanders and other aquatic Caudata. Amph Rept Conserv 5(4):1–16. [Google Scholar]
- China Aquatic Wildlife C, 2015. Investigation report on domestication breeding and management utilization of the Chinese giant salamander in China. China Fish 23–26. [Google Scholar]
- Collins RA, Wangensteen OS, O'Gorman EJ, Mariani S, Sims DW. et al., 2018. Persistence of environmental DNA in marine systems. Commun Biol 1:185. [DOI] [PMC free article] [PubMed] [Google Scholar]
- Danecek P, Auton A, Abecasis G, Albers CA, Banks E. et al., 2011. The variant call format and VCFtools. Bioinformatics 27:2156–2158. [DOI] [PMC free article] [PubMed] [Google Scholar]
- Danecek P, McCarthy SA, 2017. BCFtools/csq: haplotype-aware variant consequences. Bioinformatics 33:2037–2039. [DOI] [PMC free article] [PubMed] [Google Scholar]
- Deiner K, Fronhofer EA, Machler E, Walser JC, Altermatt F, 2016. Environmental DNA reveals that rivers are conveyer belts of biodiversity information. Nat Commun 7:12544. [DOI] [PMC free article] [PubMed] [Google Scholar]
- Doi H, Takahara T, Minamoto T, Matsuhashi S, Uchii K. et al., 2015. Droplet digital polymerase chain reaction (PCR) outperforms real-time PCR in the detection of environmental DNA from an invasive fish species. Environ Sci Technol 49:5601–5608. [DOI] [PubMed] [Google Scholar]
- Drinkwater R, Jucker T, Potter JHT, Swinfield T, Coomes DA. et al., 2021. Leech blood-meal invertebrate-derived DNA reveals differences in Bornean mammal diversity across habitats. Mol Ecol 30:3299–3312. [DOI] [PMC free article] [PubMed] [Google Scholar]
- Evans NT, Olds BP, Renshaw MA, Turner CR, Li Y. et al., 2016. Quantification of mesocosm fish and amphibian species diversity via environmental DNA metabarcoding. Mol Ecol Resour 16:29–41. [DOI] [PMC free article] [PubMed] [Google Scholar]
- Fei L, Hu SQ, Ye CY, Huang YZ, 2006. General accounts of Amphibia Gymnophiona and Urodela. Fauna Sinica Amphibia. Vol. 1.Beijing, China: Science Press. [Google Scholar]
- Fukumoto S, Ushimaru A, Minamoto T, 2015. A basin-scale application of environmental DNA assessment for rare endemic species and closely related exotic species in rivers: a case study of giant salamanders in Japan. J Appl Ecol 52:358–365. [Google Scholar]
- Gao KQ, Shubin NH, 2003. Earliest known crown-group salamanders. Nature 422:424–428. [DOI] [PubMed] [Google Scholar]
- Harrison JB, Sunday JM, Rogers SM, 2019. Predicting the fate of eDNA in the environment and implications for studying biodiversity. Proc Biol Sci 286:20191409. [DOI] [PMC free article] [PubMed] [Google Scholar]
- Isaac NJ, Redding DW, Meredith HM, Safi K, 2012. Phylogenetically-informed priorities for amphibian conservation. PLoS ONE 7:e43912. [DOI] [PMC free article] [PubMed] [Google Scholar]
- Jerde CL, Mahon AR, Chadderton WL, Lodge DM, 2011. “Sight-unseen” detection of rare aquatic species using environmental DNA. Conserv Lett 4:150–157. [Google Scholar]
- Jiang ZG, Jiang JP, Wang YZ, Zhang E, Zhang YY. et al., 2016. Red List of China's vertebrates. Biodivers Sci 24:500–551. [Google Scholar]
- Jo T, Arimoto M, Murakami H, Masuda R, Minamoto T, 2019a. Particle size distribution of environmental DNA from the nuclei of marine fish. Environ Sci Technol 53:9947–9956. [DOI] [PubMed] [Google Scholar]
- Jo T, Murakami H, Yamamoto S, Masuda R, Minamoto T, 2019b. Effect of water temperature and fish biomass on environmental DNA shedding, degradation, and size distribution. Ecol Evol 9:1135–1146. [DOI] [PMC free article] [PubMed] [Google Scholar]
- Krzywinski M, Schein J, Birol I, Connors J, Gascoyne R. et al., 2009. Circos: an information aesthetic for comparative genomics. Genome Res 19:1639–1645. [DOI] [PMC free article] [PubMed] [Google Scholar]
- Kumar S, Stecher G, Tamura K, 2016. MEGA7: molecular evolutionary genetics analysis version 7.0 for bigger datasets. Mol Biol Evol 33:1870–1874. [DOI] [PMC free article] [PubMed] [Google Scholar]
- Lalitha S, 2000. Primer premier 5. Biotech Softw Int Rep Comput Softw J Sci 1:270–272. [Google Scholar]
- Langmead B, Salzberg SL, 2012. Fast gapped-read alignment with Bowtie 2. Nat Methods 9: 357–359. [DOI] [PMC free article] [PubMed] [Google Scholar]
- Li H, 2013. Aligning sequence reads, clone sequences and assembly contigs with BWA-MEM. arXiv 1303: 3997v2. [Google Scholar]
- Li H, Handsaker B, Wysoker A, Fennell T, Ruan J. et al., 2009. The sequence alignment/map format and SAMtools. Bioinformatics 25:2078–2079. [DOI] [PMC free article] [PubMed] [Google Scholar]
- Liang ZQ, Chen WT, Wang DQ, Zhang SH, Wang CR. et al., 2019. Phylogeographic patterns and conservation implications of the endangered Chinese giant salamander. Ecol Evol 9:3879–3890. [DOI] [PMC free article] [PubMed] [Google Scholar]
- Liu P, Zhao C, Xiong S, Wang J, Zhao T. et al., 2021. Population monitoring and effect evaluation of the stock enhancement of Chinese giant salamander in Gutian Mountain National Nature Reserve. Chin J Appl Environ Biol 28:823–830. [Google Scholar]
- Maruyama A, Nakamura K, Yamanaka H, Kondoh M, Minamoto T, 2014. The release rate of environmental DNA from juvenile and adult fish. PLoS ONE 9:e114639. [DOI] [PMC free article] [PubMed] [Google Scholar]
- Matheson CD, Gurney C, Esau N, Lehto R, 2010. Assessing PCR inhibition from humic substances. Open Enzyme Inhib J 3:38–45. [Google Scholar]
- Moushomi R, Wilgar G, Carvalho G, Creer S, Seymour M, 2019. Environmental DNA size sorting and degradation experiment indicates the state of Daphnia magna mitochondrial and nuclear eDNA is subcellular. Sci Rep-UK 9:12500. [DOI] [PMC free article] [PubMed] [Google Scholar]
- Mueller RL, 2006. Evolutionary rates, divergence dates, and the performance of mitochondrial genes in Bayesian phylogenetic analysis. Syst Biol 55:289–300. [DOI] [PubMed] [Google Scholar]
- Murphy RW, Fu J, Upton DE, de Lema T, Zhao EM, 2000. Genetic variability among endangered Chinese giant salamanders Andrias davidianus. Mol Ecol 9:1539–1547. [DOI] [PubMed] [Google Scholar]
- Olson ZH, Briggler JT, Williams RN, 2012. An eDNA approach to detect eastern hellbenders Cryptobranchus a. alleganiensis using samples of water. Wildl Res 39:629–636. [Google Scholar]
- Sassoubre LM, Yamahara KM, Gardner LD, Block BA, Boehm AB, 2016. Quantification of environmental DNA (eDNA) shedding and decay rates for three marine fish. Environ Sci Technol 50:10456–10464. [DOI] [PubMed] [Google Scholar]
- Schmidt BR, Kery M, Ursenbacher S, Hyman OJ, Collins JP, 2013. Site occupancy models in the analysis of environmental DNA presence/absence surveys: a case study of an emerging amphibian pathogen. Methods Ecol Evol 4:646–653. [Google Scholar]
- Sepulveda AJ, Nelson NM, Jerde CL, Luikart G, 2020. Are environmental DNA methods ready for aquatic invasive species management? Trends Ecol Evol 35:668–678. [DOI] [PubMed] [Google Scholar]
- Seymour M, Durance I, Cosby BJ, Ransom-Jones E, Deiner K. et al., 2018. Acidity promotes degradation of multi-species environmental DNA in lotic mesocosms. Commun Biol 1:4. [DOI] [PMC free article] [PubMed] [Google Scholar]
- Shen W, Le S, Li Y, Hu F, 2016. SeqKit: a cross-platform and ultrafast toolkit for FASTA/Q File Manipulation. PLoS ONE 11:e0163962. [DOI] [PMC free article] [PubMed] [Google Scholar]
- Shu GC, Liu P, Zhao T, Li C, Hou YM. et al., 2021. Disorded translocation is hastening local extinction of the Chinese giant salamander. Asian Herpetol Res 12:271–279. [Google Scholar]
- Sidstedt M, Jansson L, Nilsson E, Noppa L, Forsman M. et al., 2015. Humic substances cause fluorescence inhibition in real-time polymerase chain reaction. Anal Biochem 487:30–37. [DOI] [PubMed] [Google Scholar]
- Spear SF, Groves JD, Williams LA, Waits LP, 2015. Using environmental DNA methods to improve detectability in a hellbender Cryptobranchus alleganiensis monitoring program. Biol Conserv 183:38–45. [Google Scholar]
- Taberlet P, Waits LP, Luikart G, 1999. Noninvasive genetic sampling: look before you leap. Trends Ecol Evol 14:323–327. [DOI] [PubMed] [Google Scholar]
- Takahashi MK, Meyer MJ, McPhee C, Gaston JR, Venesky MD. et al., 2018. Seasonal and diel signature of eastern hellbender environmental DNA. J Wildl Manage 82:217–225. [Google Scholar]
- Tao FY, Wang XM, Zheng HX, 2006. Analysis of complete cytochrome B sequences and genetic relationship among Chinese giant salamanders Andrias davidianus from different areas. Acta Hydrobiol Sin 30:625–628. [Google Scholar]
- Thomsen PF, Kielgast J, Iversen LL, Wiuf C, Rasmussen M. et al., 2012. Monitoring endangered freshwater biodiversity using environmental DNA. Mol Ecol 21:2565–2573. [DOI] [PubMed] [Google Scholar]
- Thomsen PF, Willerslev E, 2015. Environmental DNA - An emerging tool in conservation for monitoring past and present biodiversity. Biol Conserv 183:4–18. [Google Scholar]
- Turner CR, Barnes MA, Xu CCY, Jones SE, Jerde CL. et al., 2014. Particle size distribution and optimal capture of aqueous macrobial eDNA. Methods Ecol Evol 5:676–684. [Google Scholar]
- Turvey ST, Chen S, Tapley B, Wei G, Xie F. et al., 2018. Imminent extinction in the wild of the world's largest amphibian. Curr Biol 28:R592–R594. [DOI] [PubMed] [Google Scholar]
- Turvey ST, Marr MM, Barnes I, Brace S, Tapley B. et al., 2019. Historical museum collections clarify the evolutionary history of cryptic species radiation in the world's largest amphibians. Ecol Evol 9:10070–10084. [DOI] [PMC free article] [PubMed] [Google Scholar]
- Wang J, 2015. Current status of Japanese giant salamander and the enlightenment on the conservation of Chinese giant salamander. Chin J Appl Environ Biol 21:683–688. [Google Scholar]
- Wang J, Zhang HX, Xie F, Wei G, Jiang JP, 2017. Genetic bottlenecks of the wild Chinese giant salamander in karst caves. Asian Herpetol Res 8:174–183. [Google Scholar]
- Wang J, Zhang J, Li X, Jiang J, 2013. Isolation and characterization of 16 microsatellite loci for the giant salamander Andrias davidianus. Conserv Genet Resour 6:367–368. [Google Scholar]
- Wang XM, Zhang KJ, Wang ZH, Ding YZ, Wu W. et al., 2004. The decline of the Chinese giant salamander Andrias davidianus and implications for its conservation. Oryx 38:197–202. [Google Scholar]
- Weeks AR, Sgro CM, Young AG, Frankham R, Mitchell MJ. et al., 2011. Assessing the benefits and risks of translocations in changing environments: a genetic perspecitve. Evol Appl 4:709–725. [DOI] [PMC free article] [PubMed] [Google Scholar]
- Wilcox TM, McKelvey KS, Young MK, Jane SF, Lowe WH. et al., 2013. Robust detection of rare species using environmental DNA: the importance of primer specificity. PLoS ONE 8:e59520. [DOI] [PMC free article] [PubMed] [Google Scholar]
- Wineland SM, Welch SM, Pauley TK, Apodaca JJ, Olszack M. et al., 2019. Using environmental DNA and occupancy modelling to identify drivers of eastern hellbender Cryptobranchus alleganiensis alleganiensis extirpation. Freshwat Biol 64:208–221. [Google Scholar]
- Yan F, Lu J, Zhang B, Yuan Z, Zhao H. et al., 2018. The Chinese giant salamander exemplifies the hidden extinction of cryptic species. Curr Biol 28:R590–R592. [DOI] [PubMed] [Google Scholar]
- Zhang J, Kobert K, Flouri T, Stamatakis A, 2014. PEAR: a fast and accurate Illumina Paired-End reAd mergeR. Bioinformatics 30:614–620. [DOI] [PMC free article] [PubMed] [Google Scholar]
- Zhang K, Wang XM, Wu W, Wang ZH, Huang S, 2002. Advances in conservation biology of Chinese giant salamander. Biodivers Sci 10:291–297. [Google Scholar]
- Zhang P, Chen YQ, Liu YF, Zhou H, Qu LH, 2003. The complete mitochondrial genome of the Chinese giant salamander Andrias davidianus (Amphibia: Caudata). Gene 311:93–98. [DOI] [PubMed] [Google Scholar]
Associated Data
This section collects any data citations, data availability statements, or supplementary materials included in this article.
Supplementary Materials
Data Availability Statement
The raw high-throughput sequence data has been deposited in the Genome Sequence Archive at the National Genomics Data Center (CRA004266) and is publicly accessible at https://bigd.big.ac.cn/gsa.