

Summary
Reactive oxygen species (ROS) at the right concentration promote cell proliferation in cell culture, stem cells, and model organisms. However, the mystery of how ROS signaling is coordinated with cell cycle progression and integrated into the cell cycle control machinery on the molecular level remains unsolved. Here, we report increasing levels of mitochondrial ROS during the cell cycle in human cell lines that target cyclin-dependent kinase 2 (CDK2). Chemical and metabolic interferences with ROS production decrease T-loop phosphorylation on CDK2 and so impede its full activation and thus its efficient DNA replication. ROS regulate CDK2 activity through the oxidation of a conserved cysteine residue near the T-loop, which prevents the binding of the T-loop phosphatase KAP. Together, our data reveal how mitochondrial metabolism is coupled with DNA replication and cell cycle progression via ROS, thereby demonstrating how KAP activity toward CDKs can be cell cycle regulated.
Keywords: cell cycle, DNA replication, proliferation, reactive oxygen species, cyclin-dependent kinase, CDK2, T-loop phosphorylation, KAP, mitochondria, metabolism
Graphical abstract
Highlights
-
•
Mitochondrial ROS drive cell cycle progression and proliferation
-
•
Cyclin-dependent kinase 2 (CDK2) is increasingly oxidized during the cell cycle
-
•
The oxidation state of a conserved cysteine on CDK2 regulates KAP binding
-
•
CDK2 oxidation promotes T-loop phosphorylation and DNA replication
Reactive oxygen species (ROS) are by-products of mitochondrial respiration. Kirova et al. find that mitochondrial ROS increase during the cell cycle and oxidize cyclin-dependent kinase 2 (CDK2) to regulate its interaction with KAP phosphatase. CDK2 oxidation promotes T-loop phosphorylation and the CDK2 activity needed for DNA replication and proliferation.
Introduction
Reactive oxygen species (ROS) are oxygen-containing molecules with high chemical reactivity to “steal” electrons from molecules (oxidation). Excessive exposure to ROS during oxidative stress or from external sources such as ionizing agents can oxidize proteins, cause DNA mutations, and trigger lipid peroxidation (Schieber and Chandel, 2014). The major sources of intracellular ROS are superoxide anions (O2·−) produced from membrane-associated NADPH oxidases (NOXs) and mitochondria, in response to growth factor (GF) signaling or as by-products of oxidative phosphorylation, respectively (Schieber and Chandel, 2014; Bedard and Krause, 2007; Murphy, 2009). O2·− molecules are subsequently converted to hydrogen peroxide (H2O2), either spontaneously or catalytically by superoxide dismutases (Möller et al., 2019; Wang et al., 2018). H2O2 is more stable, membrane-permeant, and at physiological concentrations can act as a signaling molecule in a variety of biological processes such as GF signaling, proliferation, differentiation, and adaptation to hypoxia (Holmström and Finkel, 2014; Reczek and Chandel, 2017; Shadel and Horvath, 2015). ROS signaling is in part mediated by reversible oxidation of cysteine thiols to sulfenic acids (R-SOH) and intra- or inter-molecular disulfide bonds, which act as reversible posttranslational modifications (PTMs) that can regulate activity, localization, stability, and interactions of proteins (Reddie and Carroll, 2008).
Low levels of ROS, in particular of H2O2, have been shown to promote proliferation of stem cells, differentiated cells, and cancer cells (Armstrong et al., 2010; Gurusamy et al., 2009; Adusumilli et al., 2021; Alfar et al., 2017; Moll et al., 2018; Sigaud et al., 2005; Safford et al., 1994; Irani et al., 1997; Ogrunc et al., 2014). Mechanistically, this proliferative effect is best understood for GF signaling, where NOX-derived H2O2 activates membrane-associated receptor tyrosine kinases while inhibiting counteracting phosphatases (Holmström and Finkel, 2014), so that sustained GF signaling can initiate transcriptional programs to promote the G0/G1 and G1/S transitions (Burhans and Heintz, 2009; Chiu and Dawes, 2012). Mitochondrial ROS can also activate transcriptional programs linked to proliferation (Owusu-Ansah et al., 2008; Weinberg et al., 2010; Tsai et al., 2011; Connor et al., 2005); however, whether or not ROS directly regulate the cell cycle independent of transcriptional signaling remains elusive.
A potential target of mitochondrial ROS could be the central regulatory cell cycle network mediated by cyclin-dependent kinases (CDKs). CDKs are activated by a conserved two-step mechanism: binding of a cell cycle stage-specific cyclin and phosphorylation of a threonine residue (T160 in cyclin-dependent kinase 2 [CDK2]) within the activation segment of the kinase domain (T-loop) (Morgan, 2007). T-loop phosphorylation is carried out by a trimeric CDK-activating kinase (CAK, a complex of CDK7, cyclin H and MAT1) and opposed by CDK-associated phosphatase (KAP) and protein phosphatase 2C-like proteins (Fesquet et al., 1993; Poon et al., 1993; Solomon et al., 1993; Fisher and Morgan, 1994; Mäkelä et al., 1994; Poon and Hunter, 1995; Hannon et al., 1994; Gyuris et al., 1993; Cheng et al., 1999). Whether T-loop phosphorylation is regulated to ensure that the correct CDK becomes fully activated at the right time is still debated, since CAK is considered constitutively active (Fisher, 2005) and KAP activity regulation is unclear. Cell cycle stage and CDK specificity of T-loop phosphorylation, i.e., on CDK2 and CDK1, is in part achieved by preferential binding of CAK to monomeric CDK2 and cyclin-complexed CDK1, respectively (Larochelle et al., 2007; Merrick et al., 2008; Fisher and Morgan, 1994; Desai et al., 1995). Although KAP binds to both monomeric and cyclin-complexed CDKs (Poon and Hunter, 1995; Gyuris et al., 1993; Hannon et al., 1994), it can only dephosphorylate monomeric CDKs, i.e., once the bound cyclin is degraded (Poon and Hunter, 1995). This results in a conceptual problem for CDK2 activation during S phase, when cyclin E is degraded and CDK2 switches from cyclin E to cyclin A, meaning that T160 can be targeted by CAK and KAP at the same time.
Here, we employ retina pigment epithelial cells (RPE-1) as a non-transformed cell cycle model to monitor and interrogate intracellular ROS production along with cell cycle progression and CDK2 activation. We uncover that the levels of mitochondrial ROS increase in a cell cycle-dependent manner that recapitulates the activity of S phase regulator, CDK2. We show that oxidation of a cysteine that is conserved in CDK2 but not in other CDKs ensures T-loop phosphorylation required for efficient DNA replication and S phase progression. Our data reveal a regulatory mechanism for CDK2 activity via KAP that provides feedback from mitochondrial metabolism to cell cycle control and proliferation.
Results
Proliferation and S phase progression require oxidative events
To investigate the interplay between physiological ROS signaling and cell cycle progression, we chose human telomerase reverse transcriptase (hTERT)-immortalized RPE-1 cells as a well-established model cell line with unperturbed cell cycle control (Bodnar et al., 1998). We first assessed whether RPE-1 cells require oxidative events for normal proliferation, as has been reported for other experimental models (Wartenberg et al., 1999; Havens et al., 2006; Murrell et al., 1990; Ohguro et al., 1999; Paul et al., 2014; Alfar et al., 2017). Indeed, treating RPE-1 cells with the antioxidant N-acetyl-L-cysteine (NAC) for 48 h reduced proliferation in a dose-dependent manner (Figure S1A). The decrease in proliferation was not due to induction of apoptosis as monitored by poly ADP-ribose polymerase (PARP) cleavage (Figure S1B). To determine the cell cycle stages sensitive to reducing conditions, we employed RPE-1 cells expressing three endogenous proteins tagged with different fluorescent proteins: (1) proliferating cell nuclear antigen (Ruby-PCNA) to detect replication foci in S phase, (2) cyclin A2-Venus to distinguish cyclin A2-negative G1 cells from cyclin A2-positive S and G2 cells, and (3) histone 3.1-turquoise2 (H3.1-Turq2) to segment nuclei (Zerjatke et al., 2017). By assessing PCNA foci and cyclin A2 expression, we could classify cells as G1, S, or G2 phase based on snapshots (Figure S1C). This analysis revealed that the addition of NAC at all concentrations significantly increased the proportion of cells in S phase. We also observed that low (6 mM) concentrations of NAC reduced the number of cells in G1, whereas higher concentrations (8 and 10 mM) reduced the cells in G2 (Figure S1D). NAC is a general reductant and does not discriminate between different forms of ROS; therefore, we tested a membrane-permeant polyethylene glycol-linked catalase (PEG-CAT) to specifically target H2O2, which is considered to be the second messenger of ROS signaling (Winterbourn, 2008). Here, we combined Ruby-PCNA and H3.1-Turq2 with Fucci-Gem, a well-established anaphase promoting complex/cyclosome (APC/C) activity reporter that accumulates after the G1/S transition when APC/C is inactivated (Sakaue-Sawano et al., 2008). Fucci-Gem marks S and G2 phase cells which can be subsequently separated based on replication foci with Ruby-PCNA (Figure 1A). As with NAC, adding PEG-CAT strongly reduced cell proliferation (Figure 1B) and significantly increased the fraction of S phase at the expense of G1 (Figure 1C). To assess whether ROS directly promote RPE-1 cell proliferation, we increased the intracellular levels of ROS by using a genetically encoded D-amino acid oxidase (DAO) from Rhodosporidium toruloides, which converts medium-supplied D-alanine to a keto-acid, ammonia, and H2O2 (Lee and Chu, 1996; Figure 1D). The increase of H2O2 in response to D- but not L-alanine can be directly monitored by imaging of the ratio-metric H2O2 sensor HyPer2 fused to the N terminus of DAO (Figure 1E; Matlashov et al., 2014). DAO was further linked to a nuclear export sequence (NES, HyPer2-DAO-NES) to recapitulate mitochondrial ROS released through the outer mitochondrial membrane in the form of H2O2 (Shadel and Horvath, 2015). Indeed, the lowest concentration of D-alanine we applied (0.5 mM) significantly increased proliferation, whereas higher concentrations (2.5 or 5 mM) or addition of PEG-CAT had adverse effects (Figure 1F). Of note, the pro-proliferative effect of D-alanine at low concentrations and anti-proliferative effect at higher concentrations highlight the dual role of H2O2, which is dependent on dose and the antioxidant capacity of the cells (Gough and Cotter, 2011). These results suggest that oxidative events, mediated by H2O2, are required for normal proliferation of RPE-1 cells.
Figure 1.

Proliferation and S phase progression require oxidative events in RPE-1 cells
(A) Single-cell analyses using cell cycle markers to classify cell cycle stages. Fucci-Gem-negative cells are in G1, Fucci-Gem-positive cells are in S or G2, and PCNA foci identify S phase as depicted in the overlay. Scale bars, 10 μm.
(B) Proliferation of RPE-1 cells in the presence of PEG-catalase (PEG-CAT). Boxplots indicate the median log2-fold increase of cells for 48 h of PEG-CAT treatment. Significance according to one-way ANOVA with Dunnett’s multiple comparisons test (n = 3, N = 9).
(C) Stacked bars show the mean ± SD cell cycle distribution of cells from (B), as classified in (A). Significance according to one-way ANOVA with Holm-Sidak’s multiple comparisons test: ∗∗(500 mU PEG-CAT(G1), p = 0.0011), ∗∗∗(500 mU PEG-CAT(S), p = 0.0032), ∗∗∗(1,000 mU PEG-CAT(G1), p = 0.0001), ∗∗(1,000 mU PEG-CAT(S), p = 0.0012), (n = 3, N = 9).
(D) D-amino acid oxidase (DAO)-mediated H2O2 production (PDB:1COI without ligands).
(E) Ratio imaging of RPE-1 cells stably expressing cytoplasmic HyPer2-DAO-NES 1 h after the addition of 10 mM D- or L-alanine. Scale bars, 10 μm.
(F) Proliferation of RPE-1 cells in response to HyPer2-DAO-NES-produced H2O2. Boxplots indicate the median log2-fold change in proliferation after 48 h of treatment. Significance according to one-way ANOVA with Dunnett’s multiple comparisons test (N = 5, data are representative of 3 independent experiments).
ROS levels increase during the cell cycle
We further investigated how physiological ROS production is correlated with cell cycle progression. We employed the ROS probe CellRox Deep Red to determine the overall ROS content in living cells that express Ruby-PCNA and cyclin A2-Venus to define the cell cycle phases. Compared with G1, cells in S and G2 phases showed increased labeling of CellRox Deep Red (Figure 2A). In agreement, flow cytometry analysis revealed significant increases in cellular ROS from G1 to S and S to G2/M phases indicative of ROS fluctuations during the cell cycle (Figure 2B). Notably, the ∼25% increase of ROS from G1 to S phase is of the same magnitude as pro-proliferative ROS production by HyPer2-DAO-NES following 0.5 mM D-alanine treatment (∼20%, Figure S1E). These measurements were performed at atmospheric oxygen concentration (21%), which might affect the redox status of cells that experience lower oxygen concentration in their in vivo tissue context. Thus, we repeated our measurements with RPE-1 cells grown at the oxygen concentration reported for the retinal epithelium (6.3%). These data were consistent and showed a steeper increase of ROS from G1 to S phase (Figure 2C). Measuring ROS in primary human foreskin fibroblasts (BJ) grown at their reported in vivo oxygen concentration (4%) gave a similar result (Figure 2D; Balin et al., 2002).
Figure 2.

Mitochondrial ROS increase in S and G2 phase
(A) ROS detection in RPE-1 cells with CellRox Deep Red. Cell cycle classification based on cyclin A2-Venus and Ruby-PCNA (see also Figure S1B) . Scale bars, 25 μm.
(B and C) Flow cytometry analysis of RPE-1 cells stained with CellRox Deep Red grown at the indicated %O2. Bars represent the mean ± SD intensity normalized to G1 levels. Significance according to one-sample t test (G1 versus S) and two-tailed paired t test (S versus G2) (B, n = 3, N = 3; C, n = 3, N = 9).
(D) Equivalent analysis as in (C) with primary BJ fibroblasts grown at 4% O2. Significance according to one-sample t test (G1 versus S) and two-tailed paired t test (S versus G2) (n = 4, N = 5).
(E) Co-labeling of RPE-1 cells with CellRox Deep Red, MitoSox Red, and MitoTracker Green. Overlay indicates CellRox (yellow) and MitoTracker (cyan) co-localization. Scale bars, 25 μm.
(F) Flow cytometry analysis of RPE-1 cells stained with MitoSox Red. Bars represent the mean ± SD intensity normalized to G1 levels. Significance according to one-sample t test (G1 versus S) and a two-tailed paired t test (S versus G2) (n = 4, N = 4).
(G) Flow cytometry analysis of RPE-1 cells co-labeled with CellRox Deep Red and MitoTracker. Bars represent the mean ± SD CellRox/MitoTracker ratio. Significance according to paired one-way ANOVA with Holm-Sidak’s multiple comparisons test (n = 3, N = 3).
(H) Flow cytometry quantification of cell volume and mitochondria based on forward scatter and MitoTracker Green. Data indicate the mean log2-fold increase ± SD normalized to G1 phase. Significance according to multiple t tests with Holm-Sidak’s multiple comparisons test (n = 3, N = 3).
Notably, CellRox Deep Red labeling of RPE-1 cells appeared to be reminiscent of mitochondrial networks. Labeling of cells with CellRox Deep Red and the mitochondrial marker MitoTracker Green displayed overlapping signals (Figure 2E), suggesting that the cell cycle-correlated ROS dynamics we detected likely recapitulate changes in mitochondrial ROS. Indeed, detection of mitochondrial ROS with MitoSox Red dye mirrored the localization and cell cycle dynamics of overall ROS we observed (Figures 2E and 2F). An increase of mitochondrial ROS in S and G2/M could reflect mitochondrial activity, i.e., due to metabolic switch from glycolysis to oxidative phosphorylation or increased mitochondria mass relative to cell volume. To test these possibilities, we performed flow cytometry analysis of cells stained for mitochondrial ROS with MitoSox Red and the overall mitochondrial content with membrane potential-independent dye MitoTracker Green. We observed an equal ratio of MitoSox Red to MitoTracker Green throughout the cell cycle, which implies that the increase of mitochondrial ROS is correlated to an increase in mitochondria (Figure 2G). Like others before (Havens et al., 2006), we observed that mitochondrial content increased faster than cell volume (Figure 2H), providing a possible explanation for the elevated concentrations of cellular ROS in S and G2 or M phases. Taken together, our data reveal that cellular ROS levels fluctuate during the cell cycle in both normoxic and physiological oxygen conditions, in a manner that correlates with mitochondrial ROS dynamics. Our data also suggest that the increase in cellular ROS largely results from a relative increase in mitochondria in S and G2/M compared with G1 phase.
Mitochondrial ROS drive progression through S phase
Mitochondrial ROS are produced as a by-product of oxidative phosphorylation. Thus, reducing the influx of metabolites into the tricarboxylic acid (TCA) cycle should decrease the amount of O2·− released from the electron transport chain (ETC) and limit the concentration of mitochondrial-derived H2O2 in the cytoplasm. We employed endoribonuclease-prepared siRNAs (esi-RNAs) to downregulate PDHB, a subunit of the mitochondrial pyruvate dehydrogenase (PDH) complex that converts pyruvate to acetyl-CoA and acts as a gatekeeper between glycolysis in the cytosol and oxidative phosphorylation in mitochondria (Figure 3A). Depleting PDHB protein levels below 25% (Figures 3B and 3C) was sufficient to significantly reduce cellular H2O2 detected by HyPer7, a ratio-metric H2O2 sensor with improved sensitivity (Pak et al., 2020; Figure 3D). Importantly, reducing ROS production via PDHB depletion did not affect the ADP/ATP ratio indicating that cells were able to maintain ATP levels likely by glycolytic flux (Figure 3E).
Figure 3.

Mitochondrial ROS drive progression through S phase
(A) Illustration of mitochondrial metabolite, and ROS flux and the PDH complex as the gatekeeper between glycolysis and TCA cycle.
(B) Western blot analysis of cells treated for 48 h with control (esi-CTRL) or esiRNA targeting the β-subunit of the PDH complex (esi-PDHB).
(C) Quantification of PDHB levels in (B) normalized to esi-CTRL. Bars indicate the mean ± SD. Significance according to two-tailed one-sample t test (n = 3, N = 3).
(D) Analysis of H2O2 levels after PDHB depletion in RPE-1 cells stably expressing HyPer7. Boxplots indicate the median HyPer7 ratio. Significance according to two-tailed unpaired t test (n = 3, esi-CTRL N = 80, esi-PDHB N = 82).
(E) ATP quantification in response to PDHB depletion. Boxplots indicate the median ADP/ATP ratio. Significance according to two-tailed unpaired t test (n = 3, N = 12 esi-CTRL, N = 11, esi-PDHB).
(F) Proliferation of PDHB-depleted cells. Boxplots indicate the median log2-fold change in proliferation. Significance according to two-tailed unpaired t test (n = 3, N = 9).
(G) Single-cell time-lapse analysis. Boxplots indicate the median duration of cell cycle phases. Significance according to Kruskal-Wallis’ test and Dunnett’s correction for multiple comparisons. (n = 3, N is indicated in the graph).
(H) Quantification of cells in S/G2 phase based on Fucci-Gem after treatment with esi-CTRL or esi-PDHB. Boxplots indicate the median fraction of Fucci-Gem-positive cells. Significance according to two-tailed unpaired t test (n = 3, N = 9).
(I) Quantification of cyclin A2-Venus expression after treatment with esi-CTRL or esi-PDHB. Boxplots indicate the median cyclin A2-Venus intensity. Significance according to two-tailed unpaired t test (n = 3, N = 9).
(J–M) (J) Western blot analysis of cell cycle markers after PDHB depletion, and (K–M) graphs showing quantification of the data normalized to esi-CTRL. Bars represent the mean ± SD. Significance according to two-tailed one-sample t test (n = 3, N = 5 [p21], N = 3 [cyclin B1, geminin]).
PDHB-depleted cells proliferated slower (Figure 3F) but did not induce apoptosis based on PARP cleavage (Figure S1F). In support of our results from treatment with NAC and PEG-CAT (Figures 1 and S1) from single-cell time-lapse microscopy, PDHB-depleted cells took significantly longer to progress through S phase (Figure 3G). We noticed that PDHB depletion in this experimental setup caused a more prolonged and heterogeneous duration of G1 phase. Unchanged ATP levels and decreased levels of p21, however, indicated that longer G1 phases were not caused by activation of a metabolic checkpoint that arrested cells at the G1/S transition (Jones et al., 2005; Mitra et al., 2009). Since we use PCNA foci to identify S phase and PDHB depletion reduced the number of PCNA foci (Figure 4), our analysis likely under-estimates the duration of S phase in favor of G1 phase (Zerjatke et al., 2017). We also assessed the cell cycle distribution of PDHB-depleted cells by western blotting for established cell cycle markers and by single-cell analyses for the S phase markers cyclin A2 and Fucci-Gem. Western blot analysis (Figure 3J) showed that the levels of G1 and G2 phase markers p21 and cyclin B1 were lower in PDHB-depleted cells (Figures 3K and 3L), whereas the S phase protein geminin accumulated (Figure 3M). In agreement with a delay in S phase but not G1 phase, PDHB depletion increased the proportion of Fucci-Gem-positive cells (Figure 3H) as well as cyclin A2-Venus intensity (Figure 3I), which are two markers that only accumulate after the G1/S transition. Our findings indicate that decreasing metabolic flux by interfering with the PDH complex reduces H2O2 to result in slower cell proliferation. The increased time required to progress through S phase and the accumulation of S, but not of G1 or G2 phase markers, supports a major cell cycle-associated role of mitochondrial ROS in S phase.
Figure 4.

Mitochondrial ROS promote DNA replication
(A) Time-lapse images from the beginning (t = 0) to the end of S phase, highlighting PCNA foci formation in control (esi-CTRL) and PDHB-depleted cells (esi-PDHB) between 24 and 72 h after treatment. Scale bars, 20 μm.
(B) Western blot analysis of esi orsi-RNA treated cells after 48 h. Note, targeting a PDH complex subunit results in partial co-depletion of the other.
(C) Quantification of PCNA foci in S phase in cells treated with esi/si-PDHB for 48 h. Boxplots indicate the median number of detectable foci. Significance according to two-tailed unpaired t test (n = 3, N = 9).
(D) Cells as treated in (A) were labeled with EdU and analyzed by single-cell imaging. Boxplots indicate the median fraction of EdU-positive cells. Significance according to two-tailed unpaired t test (n = 3, N = 18).
(E) EdU incorporation as in (D) but with RPE-1 cells treated for 48 h with MitoTEMPO. Boxplots indicate the median fraction of EdU-positive cells. Significance according to two-tailed unpaired t test (n = 4, N = 15: CTRL, 1 mM, n = 2, N = 9: 0.75 mM).
Mitochondrial ROS promote DNA replication
Since reducing mitochondrial ROS levels via PDHB depletion slowed S phase, we monitored the intensity and number of PCNA foci during time-lapse imaging as a surrogate to assess the fidelity of DNA replication. Replication foci in control cells showed the stereotypical spatiotemporal pattern described for replication factories (Leonhardt et al., 2000): multiple small foci in early S phase, concentration of foci in mid S phase, and formation of large clusters at the nuclear periphery in late S phase (Figure 4A; Video S1). In contrast, PCNA foci in PDHB-depleted cells were barely detectable until the very end of S phase at the same magnification used (Figure 4A; Video S2). To exclude potential off-target effects of esi-PDHB treatment, we targeted another subunit of the PDH complex, PDHA (Figure 4B). Quantifying the number of PCNA foci in S phase cells confirmed that depleting either PDHA or PDHB decreased the number of detectable PCNA foci in S phase (Figure 4C). To strengthen the link between mitochondrial ROS and DNA replication, we also assessed 5-ethynyl-2’-deoxyuridine (EdU) incorporation in PDHB-depleted cells or cells treated for 48 h with the mitochondrial antioxidant MitoTEMPO. Indeed, both treatments significantly reduced the fraction of EdU-positive cells compared with the control (Figures 4D and 4E). Together, these data show that interfering with the TCA cycle and treatment with mitochondrial antioxidants affect DNA replication during S phase. Since interfering with the PDH complex reduced cellular H2O2 and hindered DNA replication, our findings support that mitochondrial ROS promote DNA replication.
Single-cell time-lapse imaging in RPE-1 mRuby-PCNA cells showing replication foci formation every 7 minutes after at least 24 hours of esi-CTRL treatment. For better visualization of the nucleus, the segmentation mask is shown. Scale bar = 20 μm.
Single-cell time-lapse imaging in RPE-1 mRuby-PCNA cells showing replication foci formation every 7 minutes after at least 24 hours of esi-PDHB treatment. For better visualization of the nucleus, the segmentation mask is shown. Scale bar = 20 μm.
CDK2 activity and T-loop phosphorylation are sensitive to mitochondrial ROS
CDK2 not only mediates the initiation of DNA replication but also regulates the spatiotemporal pattern of replication in the nucleus (Sansam et al., 2015). Since we observed changes in PCNA foci formation and dynamics in response to PDH complex perturbation (Figure 4), we investigated whether mitochondrial ROS promote CDK2 activity in S phase. To assess CDK2 activity in living cells, we created an RPE-1 cell line with stable expression of a CDK2 activity sensor which is nuclear upon low CKD2 activity and becomes progressively more cytoplasmic as CDK2 activity increases (Spencer et al., 2013; Figure 5A). Depleting PDHB for 48 h strongly increased the number of cells with nuclear expression of the CDK2 sensor indicative of low CDK2 activity (CDK2low) from 34% to 61% (Figures 5B and 5C). It is important to note that the CDK2low cells are unlikely to be quiescent or arrested before the restriction point (Spencer et al., 2013) because the same treatment resulted in the accumulation of multiple cell cycle markers expressed downstream of the G1/S transition, such as cyclin A2 and geminin (Figure 3).
Figure 5.

CDK2 activity and T-loop phosphorylation is sensitive to mitochondrial ROS
(A) Schematic showing CDK2-activity-dependent localization of the CDK2 sensor.
(B) CDK2 sensor localization in RPE-1 cells 48 h after esi-CTRL and esi-PDHB transfection. Note that the contrast of each image was adjusted separately to prevent the saturation of nuclear CDK2 sensor in esi-PDHB treatment. Scale bars, 50 μm.
(C) Scatter plots show scaled intensities of cytoplasmic and nuclear CDK2 sensor in single cells, as treated in (B). The percentage of CDK2Low and CDK2High is indicated (n = 2, N = 6,000).
(D and E) (D) Western blot analysis of T160 phosphorylation from cells treated with esi-PDHB, and (E) quantification of the data. Bars indicate the mean ± SD. Significance according to two-tailed one-sample t test ( n = 4, N = 4).
(F) Scatter plots show scaled intensities of cytoplasmic and nuclear CDK2 sensor in single cells after 6 h of glutamine (Gln) starvation at 21% O2 (n = 3, N = 6,000).
(G and H) (G) Western blot analysis detecting T160 phosphorylation in cells treated with glutamine starvation (−Gln) and (H) quantification of the data. Bars indicate the mean ± SD. Significance according to two-tailed one-sample t test (n = 3, N = 3).
(I) Equivalent analysis as (F) but with RPE-1 cells grown at 6.3% O2 (n = 3, N = 6,000).
(J) Western blot analysis and (K) quantification of T160 phosphorylation from cells grown at 6.3% O2 as in (G) and (H). Bars indicate the mean ± SD. Significance according to two-tailed one-sample t test (n = 3, N = 3).
Next, we addressed how mitochondrial metabolism and ROS production affect CDK2 activity on the molecular level. Full activity of CDK2 requires binding of E or A-type cyclins and phosphorylation of T160 within its T-loop. Because PDHB-depleted cells can enter S phase as indicated by an increase of Fucci-Gem-positive cells (Figure 3H) and express cyclin A2 (Figure 3I), we investigated whether T160 phosphorylation was impacted. Indeed, quantitative western blot analysis of lysates from control and PDHB-depleted cells with a phosphorylation-specific T160 antibody (CDK2 pT160) showed a ∼50% reduction in T-loop phosphorylation (Figures 5D and 5E). Importantly, this difference was not due to an enrichment of PDHB-depleted cells in G1 phase since repeating the experiment in cells synchronized at the beginning of S phase with thymidine gave a comparable result (Figures S2A and S2B). To confirm these findings, we also starved cells of glutamine (Gln) for 6 h to reduce mitochondrial ROS production (Oh et al., 2020). As with depleting PDHB, 6 h of Gln starvation strongly increased the number of CDK2low cells in both normoxic (21% O2) and physiological (6.3% O2) oxygen conditions (Figures 5F and 5I) and reduced T160 phosphorylation (Figure 5, Figure 5G, 5H, 5J, and 5K). Importantly, 6 h of Gln starvation did not synchronize cells in G1 phase, where pT160 is intrinsically lower (Figure S2C). Finally, addition of 8 and 10 mM NAC for 5 h to S phase cells also reduced T160 phosphorylation, although to a lesser extent (Figures S2D and S2E). Exposure of cells to different concentrations of NAC for 48 h, similar to proliferation experiments in Figure S1, decreased pT160 by up to 83% (Figure S2G) and resulted in accumulation of the CDK2 sensor in nuclei indicative of reduced CDK2 activity (Figure S2F). Importantly, the fraction of cyclin A2-positive cells increased upon NAC treatment in agreement with a delay in S phase but not in G1 (Figure S2H). Collectively, our data show that reducing conditions achieved by metabolic perturbation of oxidative phosphorylation or a chemical reductant decreased T-loop phosphorylation of CDK2, and thus, the degree of CDK2 activity is coupled to mitochondrial metabolism by ROS.
Genetically enabled ROS production increases T-loop phosphorylation
Thus far, our experiments in reducing conditions demonstrate indirectly that ROS are involved in regulating CDK2 activity via T160 phosphorylation. For more direct evidence, we tested if the loss of T160 phosphorylation after PDHB depletion can be rescued by DAO-mediated H2O2 production (Figure 1). As CDK2-cyclin E/A complexes are predominately nuclear, we created an RPE-1 cell line that stably expresses DAO fused to a nuclear localization sequence (NLS, HyPer2-DAO-NLS) that can rapidly generate ROS in response to D- but not to L-alanine (Figures 6A and 6B). Based on the gradual increase in the HyPer2 ratio (Figure 6B), we induced H2O2 for 1 and 2 h and evaluated the consequences on T160 phosphorylation in PDHB-depleted cells. 1 h of stimulating H2O2 production from nuclear DAO was sufficient to increase T160 phosphorylation significantly (Figures 6C and 6D). Because H2O2 produced from mitochondria needs first to pass the nuclear membrane to reach CDK2-cyclin E/A complexes, we repeated the experiment with cytoplasmic HyPer2-DAO-NES (Figure 1E). Cytoplasmic H2O2 production also rescued T160 phosphorylation (Figures 6E and 6F), indicating that mitochondrial ROS can target CDK2 which is predominantly nuclear. These data show that genetically enabled H2O2 production promotes T-loop phosphorylation on CDK2. The observation that cytoplasmic production of H2O2 can target nucleoplasmic CDK2 further supports that mitochondrial ROS can regulate CDK2 activity by acting as a signaling molecule.
Figure 6.

Genetically enabled ROS production increases T-loop phosphorylation
(A and B) (A) Ratio imaging of RPE-1 cells stably expressing nuclear HyPer2-DAO-NLS during 2 h of treatment with 10 mM D- or L-alanine (D-ala, L-ala), and (B) single-cell analysis of nuclear ROS production normalized to the ratio at t = 0. Scale bars, 10 μm.
(C and D) (C) Western blot analysis showing increased T160 phosphorylation in PDHB-depleted cells after D-ala-driven ROS production by HyPer2-DAO-NLS, and (D) quantification of T160 phosphorylation levels. Bars represent the mean ± SD normalized to t = 0. Significance according to two-tailed one-sample t test (n = 3, N = 3).
(E and F) (E) Western blot analysis with cytoplasmic ROS production by HyPer2-DAO-NES, and (F) quantification data. Bars represent the mean ± SD normalized to t = 0. Significance according to two-tailed one-sample t test (n = 4, N = 4).
Preventing C177 oxidation increases KAP binding to CDK2
Our finding that ROS stimulate CDK2 T-loop phosphorylation led us to hypothesize that either CDK2 itself or the enzymes that regulate T160 phosphorylation (CAK and KAP) are targeted by ROS. To evaluate these possibilities, we took advantage of the membrane-permeant, chemoselective probe BTD to label sulfenic acids in living cells (Gupta and Carroll, 2016). After labeling RPE-1 cells with BTD for 30 min, we performed click chemistry and a streptavidin pull-down to purify sulfenic acid-modified proteins (Figures 7A and S3A). In support of CDK2 oxidation, we detected CDK2 and known sulfenic acid-modified protein glyceraldehyde 3-phosphate dehydrogenase (GAPDH) in our pull-downs, but not highly abundant ribosomal protein RPL26 which does not contain any cysteine residues (Figure 7B). This is in agreement with several mass spectrometry studies using BTD or alternative probes in H2O2-treated cell extracts or unperturbed cells identifying CDK2 oxidation to sulfenic acid on C177 (Yang et al., 2015; Gupta et al., 2017; Xiao et al., 2020; Shi et al., 2021). C177 is positioned in an unstructured loop near T160 (Figure S3B), conserved in vertebrates (Figure S3C) and only found in CDK2 and not in other related human CDKs (Figure 7C). Next, we assessed whether CDK2 oxidation increases from G1 to S and G2 phase as predicted with an increase in ROS levels during the cell cycle. We expressed CDK2 with a C-terminal hemagglutinin (HA) tag in RPE-1 cells and released them from serum starvation for 8, 18, and 22 h to be synchronized to G1, S, and G2, respectively (Figures S3D and S3E). After labeling with BTD for 30 min, we lysed the cells under reducing conditions and conjugated the fluorescent dye Az800 to BTD by click chemistry (Figure S3F). Detection of Az800 on CDK2-HA immuno-precipitates revealed that cysteine oxidation on CDK2 to sulfenic acid increased from G1 phase to S and G2 phase in a manner that reflected the increase of ROS during the cell cycle we observed (compare Figure 2 and Figure 7D). To investigate the relationship between C177 oxidation and T160 phosphorylation, we mutated C177 to cysteine-mimetic serine (C177S) or alanine (C177A) and expressed these mutant constructs tagged with StrepII into RPE-1 cells synchronized to the beginning of S phase. StrepII pull-downs showed that T160 phosphorylation on the C177S (Figures 7E and 7F) and C177A (Figures S3G and S3H) mutants were markedly reduced, whereas binding of cyclin A2 (Figures 7G and S3I) and cyclin E1 (Figures S3J and S3K) was not significantly impacted.
Figure 7.

Preventing C177 oxidation increases KAP binding to CDK2
(A) Schematic of sulfenic acid (SOH) labeling in living cells by BTD and subsequent purification.
(B) Western blot analysis (n = 3) of StrepII pull-downs from control (DMSO) and BTD-treated RPE-1 cells. Detection of biotin is shown in Figure S3A.
(C) Clustal Omega alignment of T-loop and C177 of human CDKs.
(D) SDS-PAGE gel scan and quantification of BTD-labeled CDK2-HA purified from cells synchronized to G1, S, and G2 phases. Significance according to two-tailed one-sample t test. Full scans at lower intensities are shown in Figure S3F (n = 3, N = 3).
(E–G) (E) Western blot analysis of StrepII pull-downs from S-phase-synchronized RPE-1 cells expressing CDK2-WT-StrepII (WT), CDK2-C177S-StrepII (C177S), or CDK6-StrepII as a control, and quantification of pT160 (F) and cyclin A2 binding (G). Bars represent the mean ± SD. Significance according to two-tailed one-sample t test (pT160: n = 6, N = 6; cyclin A2: n = 4, N = 4).
(H and I) (H) Interaction between recombinant GST-KAP and CDK2-StrepII purified from S phase cells and (I) quantification of the data. Silver staining of a StrepII-pulldown is shown in Figure S3H. Bars represent the mean ± SD. Significance according to two-tailed unpaired one-sample ttest (KAP: n = 4 N = 4).
(J and K) Western blots showing the binding of (J) endogenous KAP to CDK2-StrepII from S phase cells with or without DTT (n = 3), and (K) WT and C177S CDK2-HA from lysates prepared without DTT (n = 3). Arrow indicates KAP signal.
(L) Proliferation of RPE-1 CDK2as cells expressing ectopic CDK2 WT or C177S in the presence of 3MB-PP1 or 6-BAP control (n = 3). 3MB-PP1 inactivates endogenous CDK2as but not ectopic CDK2. Significance according to two-way ANOVA with Dunnett’s multiple comparisons test; p values comparing 3MB-PP1-treated WT and C177S cells are shown (N = 12).
(M) Competitive growth analysis of CDK2 WT and C177S cells in the presence of 3MB-PP1. Boxplots indicate the median ratio of WT/C177S cells normalized to the mean on day 0. Significance according to Kruskal-Wallis’ test with Dunnett’s correction for multiple comparisons (n = 3, N = 18).
(N) EdU incorporation of CDK2 WT and C177S cells in the presence of 3MB-PP1 after G1 phase synchronization by palbociclib (n = 3). Boxplots indicate the median fraction of EdU-positive cells. Significance according to one-way ANOVA with Sidak’s correction for multiple comparisons (N = 6).
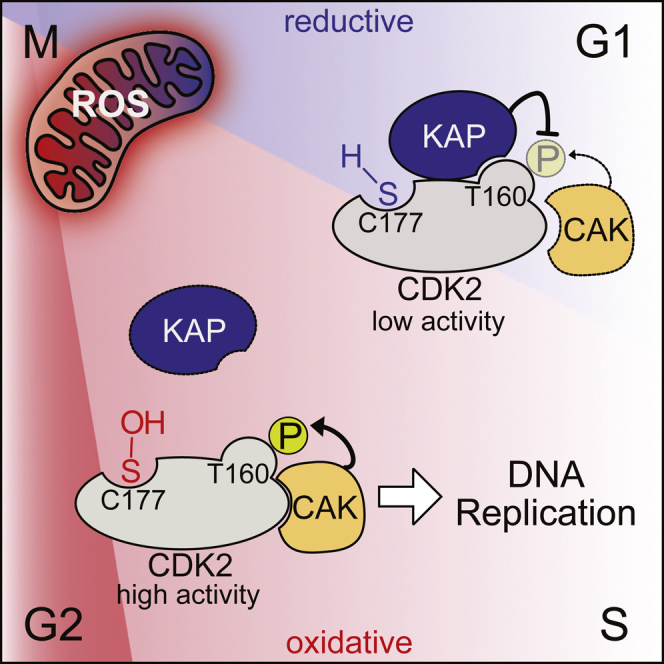
(O) Model of ROS-regulated CDK2-KAP interaction during G1 and S phase, where C177 is reduced (blue) during G1 phase to allow KAP recruitment and dephosphorylation of T160. Oxidation of C177 (red) by increasing mitochondrial ROS in S phase prevents KAP binding and shifts the balance toward CAK binding. Thus, high CDK2 activity can be maintained in the presence of KAP.
One possibility is that C177 oxidation regulates the binding of CAK or KAP to CDK2 and, therefore, impacts the phosphorylation status of T160. To test this, we compared the binding of recombinant CAK and KAP with CDK2-StrepII WT and C177S purified from cells synchronized to S phase when CDK2 should be oxidized (Figure S4A). For CAK binding assays, we first dephosphorylated CDK2-StrepII WT and C177S immobilized on beads with λ-phosphatase (Figure S4B) before adding recombinant CAK in the presence or absence of the reducing agent dithiothreitol (DTT) (Figure S4C). Here, we did not observe significant changes in CAK binding to CDK2 by western blotting for CDK7 (Figure S4D). In contrast, when we assessed the binding of recombinant KAP to phosphorylated CDK2, we found that KAP binding was increased 2-fold for the C177S mutant compared with the WT in the absence of DTT (Figures 7H and 7I). In the presence of DTT, KAP binding selectively increased for CDK2 WT but not for the C177S mutant (Figure 7I). Finally, we tested whether endogenous KAP binds to CDK2 in a redox-dependent manner. We performed CDK2 pull-downs from lysates of S phase-synchronized cells treated with or without DTT for 10 min. Indeed, endogenous KAP was only detected in CDK2 pull-downs under reducing conditions and not without DTT in the extract preparation (Figure 7J). In contrast, HA-tagged CDK2 C177S but not WT was able to pull-down endogenous KAP in the absence of DTT, suggesting that mutation of C177S is sufficient to render the CDK2-KAP interaction insensitive to oxidation (Figure 7K).
If CDK2 oxidation on C177 is important for full CDK2 activation and S phase progression then cells expressing C177S in the absence of endogenous CDK2 activity should be impaired in proliferation and DNA replication. Since C177 is vital to proliferation, we were hesitant to introduce a C177S mutation directly to the endogenous CDK2 gene. Instead, we created pools of 5 independent stable cell lines expressing untagged CDK2 WT or C177S in RPE-1 cells harboring two alleles of Shokat analog sensitive CDK2 (CDK2as) (Merrick et al., 2011). This allowed us to rapidly inactivate endogenous CDK2 and assess how mutant C177S CDK2 can promote proliferation and DNA replication compared with WT CDK2. Indeed, addition of inhibitory Shokat ATP analog 3MB-PP1 but not of non-inhibitory 6-benzylaminopurine (6-BAP) decreased the proliferation of parent CDK2as cells (Figure 7L), as previously reported (Merrick et al., 2011). Cells expressing CDK2 WT were only mildly affected by 3MB-PP1 since ectopic CDK2 is not analog sensitive. In contrast, expression of C177S slowed proliferation similar to 3MB-PP1-treated parent CDK2as cells, regardless of whether 3MB-PP1 was added. This suggests that the C177S mutant has dominant-negative properties, consistent with known CDK T-loop mutants (van den Heuvel and Harlow, 1993). Moreover, CDK2 WT cells proliferated faster than C177S expressing cells (Figure 7M), which was not due to less expression of ectopic CDK2 since C177S was expressed more than WT (Figures S4F and S4G). Finally, we assessed the ability of C177S to promote DNA replication. To account for potential differences in cell cycle distribution between WT and C177S cells, we synchronized the cells to G1 phase by treating them with CDK4/6 inhibitor palbociclib for 24 h (Trotter and Hagan, 2020). We released cells in the presence of EdU and evaluated EdU incorporation 4 and 6 h later for early and mid S phase, respectively (Figure S4E; Trotter and Hagan, 2020). In agreement with our conclusion that C177 oxidation promotes CDK2 activity and DNA replication, there were fewer EdU-positive cells for the C177S mutant compared with WT (Figure 7N). Collectively, these data demonstrate that oxidation of C177 located near the T-loop is important to maintain complete T160 phosphorylation and optimal CDK2 activity. Mutation of C177 or reducing CDK2 oxidation increased KAP binding, which supports that ROS promote S phase progression and DNA replication by preventing T160 phosphatase recruitment.
Discussion
To proliferate, cells must coordinate cell growth driven by metabolism and cell cycle progression to ensure that DNA and other essential cellular components are duplicated before cell division. Bidirectional cross-talk between cell cycle and metabolic regulation are emerging topics of active research, especially because aberrations in either system are hallmarks of numerous diseases including cancer. In the present study, we uncover that mitochondrial ROS levels continuously increase from G1 to S and G2 phases and oxidize CDK2. Oxidation occurs at a conserved cysteine residue close to the T-loop of CDK2 and prevents the binding of KAP. As a consequence, T-loop phosphorylation can be sustained despite high KAP expression during early S phase (Gyuris et al., 1993), guaranteeing complete CDK2 activation and S phase progression. Thus, we identify a simple and elegant mechanism by which cell cycle-dependent production of mitochondrial ROS promote DNA replication to coordinate cell cycle progression with the metabolic state of the cell.
The concept that the redox environment of cells is coordinated with cell cycle progression dates back to 1931 when Rapkine (Rapkine, 1931) postulated a thiol cycle in dividing urchin eggs. Since then, redox fluctuations similar to the ROS dynamics we report have been inferred by several studies indirectly by reducing agents such as NAC (Menon et al., 2007; Kim et al., 2001; Kyaw et al., 2004; Havens et al., 2006) or directly by the ROS-sensitive fluorescent probe dichlorodihydrofluorescein diacetate DCFH-DA (Kim et al., 2001; Kyaw et al., 2004; Havens et al., 2006; Menon and Goswami, 2007; Ivanova et al., 2021). ROS measurements with DCFH-DA are inherently prone to artifacts and have several limitations (Kalyanaraman et al., 2012; Bonini et al., 2006). Therefore, the source and dynamics of ROS levels during the cell cycle in proliferating cells have remained controversial. In our study, we used non-transformed RPE-1 cells and the ROS probe CellRox Deep Red, which labels the hydroxyl radical, O2·− and H2O2 in order of sensitivity. We find that CellRox Deep Red predominately labels mitochondrial structures in living cells, which is consistent with O2·− production in mitochondria. Our data suggest that the cell cycle-dependent increase of cellular ROS likely recapitulates the relative increase in mitochondrial content rather than increased respiration (Figure 2). We cannot, however, exclude that bursts of mitochondrial activity undetectable by our analyses could also contribute to ROS production, such as during the G1/S transition (Mitra et al., 2009).
Previous studies have suggested that mitochondria in Drosophila and human cells are needed to provide the energy and buildup of cyclin E required to enter S phase (Mandal et al., 2005; Mitra et al., 2009; Robbins and Morrill, 1969). Our work identifies that mitochondrial ROS are a key driver of S phase by ensuring full CDK2 activity necessary for DNA replication (Figures 1, 3, and 4). We find no evidence that restricting the metabolic influx of acetyl-CoA into the TCA cycle decreases ATP levels and activates a metabolic checkpoint that restricts entry into S phase in a p53- and p21-dependent manner (Figure 3; Jones et al., 2005; Mitra et al., 2009). Furthermore, mitochondrial ATP production appears to be dispensable for human cells with access to sufficient glucose (Sullivan et al., 2015). Towards the end of G1 phase, mitochondria form a transient hyperfused network that drives cells into S phase, by an undefined mechanism that possibly involves p53 and boosting the levels of cyclin E (Mitra et al., 2009). Our data indicate that a limiting function of ROS is downstream of this process because cells with decreased levels of mitochondrial ROS display elevated levels of the S and G2 phase markers geminin and cyclin A2 (Figure 3). Thus, mitochondria seem to employ two sequential and distinct mechanisms to regulate S phase via CDK2 activity: energy-driven expression of cyclin E to initiate S phase and ROS-sustained T-loop phosphorylation to drive DNA replication.
30 years after the discovery of T-loop phosphorylation (Gould et al., 1991), a congruent model explaining how CAK and KAP activities are coordinated to avoid unnecessary cycles of phosphorylation and de-phosphorylation is lacking. In higher organisms, CDK2 and CDK1 are the only regulatory CDKs that sequentially bind to different cyclins during the cell cycle and thus can become a target of KAP as monomers, i.e. during the degradation of cyclin E in early S phase and of cyclin A during prometaphase. However, in contrast to CDK2, CAK and KAP never compete for CDK1 because CDK1 is only phosphorylated by CAK once the cyclin is bound, and in this state, the T-loop is inaccessible to KAP (Poon and Hunter, 1995; Song et al., 2001). For CDK2, however, the T-loop becomes accessible to KAP once CDK2 switches from cyclin E to cyclin A at the beginning of S phase, and yet T160 phosphorylation remains constant until the end of mitosis Figure S3D. Our finding that the interaction between CDK2 and KAP is regulated by oxidation of C177 (Figure 7) addresses this critical issue and explains why T160 phosphorylation is sensitive to mitochondrial ROS production (Figure 5). Regulation of CDK2 activity by this unique oxidative mechanism could potentially be exploited to develop CDK2-specific inhibitors that do not target closely related kinases, i.e., by a cysteine-reactive probe that prevents C177 oxidation but still allows for KAP binding.
We propose a model by which the increase in mitochondrial ROS in S phase prevents KAP binding to CDK2 to ensure that T-loop phosphorylation of CDK2 can be sustained at times of high KAP expression (Gyuris et al., 1993; Figure 7O). An exception to this rule would include CDK2 in Drosophila which has no C177, but here, CDK2 does not switch between cyclins because cyclin A only interacts with CDK1 in this organism (Harper and Elledge, 1998). A cysteine in the position of C177 is also absent in unicellular organisms and plants, where the function of CDK2 is carried out by CDK1.
The structure of KAP in association with CDK2 pT160 presents no clear evidence of how C177 oxidation could hinder KAP binding (Song et al., 2001). However, only residues 25–198 of KAP are resolved and truncation of residues 1–34 completely abolishes its interaction with CDK2 (Yeh et al., 2003). Hence, it is conceivable that the N terminus of KAP directly binds to CDK2 in a C177 oxidation-sensitive manner. Alternatively, we are currently investigating whether another interactor binds to CDK2 in more oxidizing conditions and thereby prevents the recruitment of KAP.
Limitations of the study
Although proteomics identified C177 as the only oxidized cysteine of CDK2 (Yang et al., 2015; Gupta et al., 2017; Xiao et al., 2020; Shi et al., 2021), we cannot exclude that the other two cysteines of CDK2 can be oxidized as well. The crystal structure of CDK2, however, indicates that only C177 is solvent exposed (Brown et al., 1999). KAP itself contains several redox-sensitive cysteines (Xiao et al., 2020), and cysteine 140 which is crucial for KAP activity is readily oxidized in vitro (Song et al., 2001). Thus, the increase of ROS during S and G2 phase might also negatively regulate KAP activity or its interaction with CDK2 to feedback to CDK2 activity. Our data imply that the levels of ROS and CDK2 oxidation are reduced once cells enter the next cycle. Whether this is a consequence of diminished ETC activity in mitosis/early G1 phase or an active process that might involve the antioxidant system or CDK2 turnover are intriguing questions to be addressed in the future.
STAR★Methods
Key resources table
| REAGENT or RESOURCE | SOURCE | IDENTIFIER |
|---|---|---|
| Antibodies | ||
| CDK2 | BD Bioscience | Cat# 610146; RRID: AB_397547 |
| CDK2 pT160 | Cell Signaling Technology | Cat# 2561; RRID: AB_2078685 |
| CDK4 | Cell Signaling Technology | Cat# 12790; RRID: AB_2631166 |
| CDK7 | Cell Signaling Technology | Cat# 2916; RRID: AB_2077142 |
| CSE1 | Abcam | Cat# ab54674; RRID: AB_940806 |
| CSE1 | Abcam | Cat# ab96755; RRID: AB_10865417 |
| Cyclin A2 | Santa Cruz | Cat# sc-596; RRID: AB_631330 |
| Cyclin B1 | BD Pharmingen | Cat# 554177; RRID: AB_395288 |
| Cyclin E1 | Bethyl | Cat# A301-566A; RRID: AB_1039994 |
| eIF4G | Cell Signaling Technology | Cat# 2469; RRID: AB_2096028 |
| GAPDH | Cell Signaling Technology | Cat# 2118; RRID: AB_561053 |
| Geminin | Cell Signaling Technology | Cat# 5165; RRID: AB_10623289 |
| KAP (CDKN3) | Abcam | Cat# ab175393 |
| Mouse anti-HA Tag (YPYDVPDYA) | Custom-made | N/A |
| p21 | Cell Signaling Technology | Cat# 2947; RRID: AB_823586 |
| PARP | Cell Signaling Technology | Cat# 9542; RRID: AB_2160739 |
| PDHA | GeneTex | Cat# GTX104015; RRID: AB_1951155 |
| PDHB | GeneTex | Cat# GTX119625; RRID: AB_11163683 |
| RPL26 | Bethyl | Cat# A300-686A; RRID: AB_530289 |
| Streptavidin | Abcam | Cat# ab76949; RRID: AB_1524455 |
| α-tubulin | Sigma Aldrich | Cat# T5168; RRID: AB_477579 |
| β-actin | Sigma Aldrich | Cat# A5441; RRID: AB_476744 |
| IRDye 680RD Donkey anti-Rabbit IgG (H+L) | LI-COR Biosciences | Cat# 926-68073; RRID: AB_10954442 |
| IRDye 800CW Donkey anti-Rabbit IgG (H + L) | LI-COR Biosciences | Cat# 926-32213; RRID: AB_621848 |
| IRDye 800CW Donkey anti-Mouse IgG (H + L) | LI-COR Biosciences | Cat# 926-32212; RRID: AB_621847 |
| IRDye 680RD Donkey anti-Rabbit IgG (H + L) | LI-COR Biosciences | Cat# 926-68073; RRID: AB_10954442 |
| Anti-rabbit IgG, HRP-linked Antibody | Cell Signaling Technology | Cat# 7074; RRID: AB_2099233 |
| Anti-mouse IgG, HRP-linked Antibody | Cell Signaling Technology | Cat# 7076; RRID: AB_330924 |
| Anti-mouse IgG, HRP-linked Antibody | Cell Signaling Technology | Cat# 7076S; RRID: AB_330924 |
| Virus strains | ||
| AAV Helper-free System | Stratagene | Cat# 240071 |
| Chemicals, peptides, and recombinant proteins | ||
| 6-Benzylaminopurine (6-BAP) | Sigma Aldrich | Cat# B3408 |
| AF647-Picolyl-azide | Jena Biosciences | Cat# CLK-1300 |
| Amphotericin B | Sigma Aldrich | Cat# A2942 |
| AZDye 800 Picolyl Azide (Az800) | Click Chemistry Tools | Cat# 1563-5 |
| Benzonase | Sigma Aldrich | Cat# E1014 |
| Biotin | Sigma Aldrich | Cat# B4639 |
| BSA (Fraction V) | Roth | Cat# 8076.4 |
| BTD | Kindly provided by Kate Carroll, Scripps, UF, USA and André Nadler, MPI-CBG Dresden, Germany | https://doi.org/10.1021/jacs.7b01791 |
| CellRox Deep Red | Invitrogen | Cat# C10422 |
| cOmplete™, EDTA-free Protease Inhibitor Cocktail | Merck | Cat# 4693132001 |
| Copper(II) sulfate | Sigma Aldrich | Cat# C1297 |
| D-alanine | Sigma Aldrich | Cat# A7377 |
| DMSO | Sigma Aldrich | Cat# D2650 |
| Dry milk powder | Roth | Cat# T145.3 |
| DTT | Sigma Aldrich | Cat# D0632 |
| Formaldehyde | Thermo Scientific | Cat# 28908 |
| Gelantine | VWR | Cat# 1040700500 |
| Glutamax | Gibco | Cat# 35050038 |
| Glycerol | VWR | Cat# 24386.298 |
| Hoechst 33342 | Sigma Aldrich | Cat# 14533 |
| Iodoacetamide (IAA) | Sigma Aldrich | Cat# A3221 |
| IRDye 800CW Streptavidin | LI-COR Biosciences | Cat# 926-32230 |
| L-alanine | Sigma Aldrich | Cat# A7469 |
| Lambda Protein Phosphatase | New England Biolabs | Cat# PO753 |
| MES running buffer (Bolt) | Invitrogen | Cat# B0002 |
| MitoSOX | Invitrogen | Cat# M36008 |
| MitoTEMPO | Sigma Aldrich | Cat# SML0737 |
| MitoTracker Green | Invitrogen | Cat# M7514 |
| MOPS SDS running buffer (Bolt) | Invitrogen | Cat# B0001 |
| N-acetyl-L-cysteine | Sigma Aldrich | Cat# A7250 |
| Neomycin (G418) | Sigma Aldrich | Cat# G8168 |
| NuPage LDS sample buffer | Invitrogen | Cat# NP0007 |
| OPTIMEM | Gibco | Cat# 31985047 |
| Palbociclib | Sigma Aldrich | Cat# PZ0383 |
| Paraformaldehyde (PFA) | Merck | Cat# 1.040005 |
| PEG-Catalase | Sigma Aldrich | Cat# C4963 |
| Penicillin-streptomycin | Sigma Aldrich | Cat# P0781 |
| PhosSTOP | Merck | Cat# 4906837001 |
| Picolyl-azide PEG4-biotin | Jena Biosciences | Cat# CLK-1167 |
| PP1 Analog III (3MB-PP1) | Merck | Cat# 529582 |
| Puromycin | Sigma Aldrich | Cat# P8833 |
| Recombinant CAK | ThermoFisher Scientific | Cat# PV3868 |
| Recombinant KAP | Sigma Aldrich | Cat# SRP5175 |
| RNAiMAX | ThermoFisher Scientific | Cat# 13778150 |
| SIR-DNA | Spirochrome | Cat# SC007 |
| Sodium Azide | Sigma Aldrich | Cat# S2002 |
| Sodium bicarbonate | Gibco | Cat# 25080094 |
| Sodium L-ascorbate | Sigma Aldrich | Cat# A7631 |
| Soy protein isolate | Amazon/Vitasyg | ASIN# B01FK8PROK |
| TCEP | Sigma Aldrich | Cat# C4706 |
| Thymidine | Sigma Aldrich | Cat# T9250 |
| Tris-[(1-benzyl-1H-1,2,3-triazol-4-yl)-methyl]-amin (TBTA) | Sigma Aldrich | Cat# 678937 |
| Triton X-100 | Sigma Aldrich | Cat# T8787 |
| Trypsin-EDTA solution 10x | Sigma Aldrich | Cat# 59418C |
| Tween 20 | VWR | Cat# M147 |
| Critical commercial assays | ||
| ADP/ATP ratio assay kit | Sigma Aldrich | Cat# MAK135-1KT |
| Click-iT Plus EdU Alexa Fluor 488 Imaging Kit | ThermoFisher Scientific | Cat# C10637 |
| Luminata Forte Western HRP Substrate | Millipore | Cat# WBLUF0500 |
| ProteoSilver stain kit | Sigma Aldrich | Cat# PROTSIL1 |
| Super Signal West Femto Maximum Sensitivity Substrate | ThermoFisher Scientific | Cat# 34095 |
| Experimental models: Cell lines | ||
| RPE-1 | ATCC | RRID: CVCL_4388 |
| RPE-1 FRT/TR | Kindly provided by Jon Pines, ICR London, UK | RRID: CVCL_VP32 |
| BJ fibroblasts | ATCC | RRID: CVCL_3653 |
| AAV-293 | Stratagene | RRID: CVCL_6871 |
| RPE-1 mRuby-PCNA, Histone3.1-mTurquoise2, CylinA2-mVenus | Our lab has developed | https://doi.org/10.1016/j.celrep.2017.05.022 |
| RPE-1 FRT/TR mRuby-PCNA | Our lab has developed | https://doi.org/10.1016/j.celrep.2017.05.022 |
| RPE-1 CDK2-as | Kindly provided by Robert Fisher, Icahn School of Medicine, New York, USA | https://doi.org/10.1016/j.molcel.2011.03.031 |
| RPE-1 FRT/TR mRuby-PCNA, Histone3.1-iRFP | this study | Table S1: #5 |
| RPE-1 FRT/TR mRuby-PCNA Histone3.1-iRFP, mAG-hGeminin (1-110) | this study | Table S1: #6 |
| RPE-1 FRT/TR mRuby-PCNA, Histone3.1-mTurquoise2 | this study | Table S1: #7 |
| RPE-1 FRT/TR mRuby-PCNA, Histone3.1-mTurquoise2, Cdk2 sensor (DHB-Venus) | this study | Table S1: #8 |
| RPE-1 FRT/TR CDK2 sensor (DHB-mCherry) | this study | Table S1: #9 |
| RPE-1 FRT/TR Clover-hGeminin(1-110), Histone3.1-mTurquoise2, CDK2 sensor (DHB-mCherry) | this study | Table S1: #10 |
| RPE-1 FRT/TR mRuby-PCNA + Histone 3.1-iRFP + Hyper2-DAO-NES | this study | Table S1: #11 |
| RPE-1 FRT/TR Hyper2-DAO-NLS | this study | Table S1: #12 |
| RPE-1 FRT/TR CDK2 sensor (DHB-mCherry), NLS-DAO-HyPer2 | this study | Table S1: #13 |
| RPE-1 FRT/TR Hyper2-DAO-NES | this study | Table S1: #14 |
| RPE-1 FRT/TR CDK2 sensor (DHB-mCherry), NES-DAO-HyPer2 | this study | Table S1: #15 |
| RPE-1 FRT/TR mKO2-hCdt1(30-120), Clover-hGeminin(1-110) | this study | Table S1: #16 |
| RPE-1 FRT/TR Hyper7 + mRuby-PCNA + Histone 3.1-iRFP | this study | Table S1: #17 |
| RPE-1 CDK2-as + CDK2 WT + eGFP (pool of 5 independent clones) | this study | Table S1: #19 |
| RPE-1 CDK2-as + CDK2 C177S + mRuby (pool of 5 independent clones) | this study | Table S1: #20 |
| RPE-1 FRT/TR CDK2-HA (WT) | this study | Table S1: #21 |
| RPE-1 FRT/TR CDK2-HA (C177S) | this study | Table S1: #22 |
| Oligonucleotides | ||
| esi-PDHB | Eupheria | HU-04685-1 |
| esi-CTRL (5’-TGTCCCTTAAACACT CACTGGTCACGAGCGATACAATT CGCATACGGAGATAGGAGAATC GTCATACGTCGATACAGGTGCA TAAAACGGCCTTCCAAGATTCGT CGATCTAATATTTTCGGGGGACG ATTAATATAAATGGGTCTTCTACA AGTCTATTGATCATAGTTCTTAAC GTAGGGACGTTCGTTACATGAAA TAAGACTTAGTTACCACACTTCAA TATTCATTTTGCCCGACCTGTC GCCAG-3’) |
Eupheria | custom design |
| si-PDHA (5’-AGGUUGUGCUAA AGGGAAA-3’) |
Eurofins | custom design |
| si-CTRL (5’-UGGUUUACAUGU CGACUAA-3’) |
Eurofins | custom design |
| Oligonucleotides used for PCR and cloning | IDT, Sigma Aldrich | See Table S2 |
| Recombinant DNA | ||
| pAAV-Histone3.1-iRFP | this study | Table S2: #1 |
| pcDNA3-mAG-Geminin (1/110) | N/A | https://doi.org/10.1016/j.cell.2007.12.033 |
| pAAV-H3.1-mTurquoise2 | Our lab has developed | https://doi.org/10.1016/j.celrep.2017.05.022 |
| SCII-CDK2 sensor (Venus) | Kindly provided by Sabrina Spencer, University of Colorado, USA | https://doi.org/10.1016/j.cell.2013.08.062 |
| pIRESNeomycin3-Cdk2-sensor (Venus) | this study | Table S2: #5 |
| CAGGS-NLS-Flag-Cas9-IRES-Puromycin | Kindly provided by Francis Stewart, TU Dresden, Germany | https://doi.org/10.1038/srep25529 |
| pIRES-EGFP | Clontech | 6029-1 |
| pIRESNeo3 | Clontech | 6988-1 |
| pIRESNeomycin3-CAGGS promoter | this study | Table S2: #8 |
| CSII-CDK2 sensor (DHB-mCherry) | Kindly provided by Sabrina Spencer, University of Colorado, USA | https://doi.org/10.1016/j.cell.2013.08.062 |
| pIRESNeomycin3-CDK2 sensor (DHB-mCherry) | this study | Table S2: #10 |
| pIRES-Puro3 | Clontech | 6986-1 |
| pRIRESPuromycin3-CDK2 sensor (DHB-mCherry) | this study | Table S2: #12 |
| pLL3.7m-Clover-Geminin(1-110)-IRES-mKO2-Cdt(30-120) | Addgene | RRID:Addgene_83841 |
| pC1-HyPer-3 | Addgene | RRID:Addgene_42131 |
| pC1-Clover-Geminin(1-110)-IRES-mKO2-Cdt(30-120) | this study | Table S2: #15 |
| pC1-Clover-Geminin(1-110)-IRES-Histone3.1-Turquoise2 | this study | Table S2: #16 |
| pAAV-Hyper2-DAO-NLS | Kindly provided Vsevolod Belousov, IBCh RAS, Russia | https://doi.org/10.1089/ars.2013.5618 |
| pCS2-HyPer7 | Kindly provided Vsevolod Belousov, IBCh RAS, Russia | https://doi.org/10.1016/j.cmet.2020.02.003 |
| pIRESNeomycin3-CDK2-StrepII-WT | this study | Table S2: #19 |
| pIRESNeomycin3-CDK2-StrepII-C177S | this study | Table S2: #20 |
| pIRESNeomycin3-CDK2-StrepII-C177A | this study | Table S2: #21 |
| pIRESNeomycin3-Cdk6-StrepII-WT | this study | Table S2: #22 |
| pAAV-Hyper2-DAO-NES | Kindly provided Vsevolod Belousov, IBCh RAS, Russia | https://doi.org/10.1089/ars.2013.5618 |
| pMito-iRFP713 | Addgene | RRID:Addgene_45465 |
| pIRES2-CDK2(WT)-IRES2-eGFP | this study | Table S2: #25 |
| pIRES2-CDK2(C177S)-IRES2-mRuby | this study | Table S2: #26 |
| pDNA5 FRT/TO CDK2(WT)-HA | this study | Table S2: #27 |
| pIRESNeomycin3_CDK2(C177S)-HA | this study | Table S2: #28 |
| pIRESNeomycin3_CDK2(WT)-HA | this study | Table S2: #29 |
| pIRESNeomycin3-CDK2(C177S)-HA | this study | Table S2: #30 |
| Software and algorithms | ||
| Affinity Designer | Serif (Europe) Ltd | N/A |
| Fiji | N/A | https://doi.org/10.1038/nmeth.2019 |
| FlowJo | Becton, Dickinson and Company | N/A |
| Mathematica 12.1 | Wolfram Research Inc. | N/A |
| MetaXpress 5 and 6 | Molecular Devices | N/A |
| Papers2 | Mekentosj B.V. | N/A |
| Prism 6-9 | Graph Pad | N/A |
| TraCurate | N/A | https://doi.org/10.1016/j.softx.2021.100656 |
| Other | ||
| Auto-fluorescence-reduced imaging DMEM | Gibco | https://doi.org/10.1007/978-1-60327-993-2_7 |
| DMEM | Gibco | 41966052 |
| DMEM/F12 | Sigma Aldrich | D6421 |
| Dynabeads Protein G | Invitrogen | 10004D |
| Fetal Bovine Serum | Gibco | 10500064 |
| Fetal Bovine Serum, dialyzed | Gibco | 26400044 |
| Immobilon-FL PVDF | Millipore | IPFL00010 |
| Leibovitz’s L-15 Medium, no phenol red | Life Technologies | 21083027 |
| Minimum Essential Medium Eagle (MEM) | Sigma Aldrich | M2279 |
| Magnetic streptavidin beads | Pierce | 88816 |
| MagStrep “type3” XT beads | IBA | 2-4090-002 |
Resource availability
Lead contact
Further information and requests should be directed to and will be fulfilled by the corresponding author: Dr. Jörg Mansfeld (jorg.mansfeld@icr.ac.uk)
Materials availability
Generated plasmids and cells are available from the lead contact upon request or have been deposited on Addgene.
Experimental model and subject details
Cell lines and cell culture
All cell lines were cultured according to standard mammalian tissue culture protocol at 37 °C in 5% CO2, assessed for authenticity by imaging, and tested for mycoplasma contamination. For hypoxia experiments, cells were adapted to 6.3% (RPE-1) and 4% O2 (BJ) in Whitley H35 hypoxystation (Don Whitley Scientific) for 3-4 days before the experiment. Prior to imaging or flow cytometry analyses, cells were fixed at the indicated concentrations of O2 in 3.7% PFA/PBS for 15 minutes. hTERT RPE-1 (Gender: female, RRID:CVCL_4388), hTERT RPE-1 FRT/TR (Gender: female, RRID:CVCL_VP32), hTERT-RPE-1 CDK2as (Gender: female; Merrick et al., 2011) and the thereof derived cell lines listed in the key resources table and Table S2 were grown in DMEM/F12 supplemented with 10% (v/v) FBS, 1% (v/v) penicillin-streptomycin, 1% (v/v) Glutamax, 0.5 μg/mL Amphotericin B and 0.26% sodium bicarbonate. AAV-293 (Gender: female, RRID:CVCL_6871) cells were grown in DMEM supplemented with 10% (v/v) FBS, 1% (v/v) penicillin-streptomycin, 1% (v/v) Glutamax, 0.5 μg/mL Amphotericin B. BJ fibroblasts (Gender: male, RRID:CVCL_3653) were grown in MEM supplemented with 10% FBS, 1% (v/v) penicillin-streptomycin and 1% (v/v) Glutamax. For BJ fibroblasts, the surface of cell culture plates was coated with 1% gelatin prior to seeding. Related to Figures 1, 2, 3, 4, 5, 6, 7, and S1–S3.
Plasmids and cell line generation
All plasmids and cell lines used in this study including vector backbones, PCR primers, templates, restriction sites, parent cell lines, inserts, methodology, and sources are listed in Tables S1 and S2. Gene knock-in of mRuby-PCNA and Histone 3.1-iRFP were created by rAAV-mediated gene targeting according to Zerjatke et al. (2017) and Collin et al. (2013). Stable cell lines were created by electroporation of plasmids using a Neon Transfection System (Thermo Fisher) according to the manufacturer’s instructions. After 14-21 days, single positive clones were picked after selection with 400 μg/mL neomycin or 0.5 μg/mL puromycin. RPE-1 cell lines ectopically expressing HyPer2-DAO-NES or HyPer2-DAO-NLS were generated by viral transduction using an AAV gene targeting system (Stratagene) according to the manufacturer’s instructions, and single HyPer2-fluorescent clones were selected by cell sorting on a BD FACSAria III (BD Biosciences). All cell lines used in this study including parental cell lines, plasmids, methods of creation, and references are described in Table S1. For transient transfection, 8 μg of CDK2-StrepII WT or C177S plasmid were electroporated per 106 cells, followed by extract preparation 48 hours later. Related to Figures 1, 3, 5, 6, 7, and S3.
Method details
Cell treatments
To synchronize RPE-1 cells at the beginning of S phase, 2.5 or 10 mM thymidine was added to the growth medium for 24 hours. To synchronize cells in G1 phase, 150 nM Palbociclib was supplied to media for 24 hours. For glutamine starvation experiments, cells were washed once with PBS, incubated for 6 hours in DMEM/F12 without glutamine and then supplemented with 10% (v/v) dialyzed FBS, 1% (v/v) penicillin-streptomycin, 0.5 μg/mL Amphotericin B, and 0.26% sodium bicarbonate. Stock solutions (500 mM) of N-acetyl-L-cysteine (NAC) in 7.5% sodium bicarbonate were always prepared freshly, adjusted with NaOH to pH 7.4-7.5, and added to cell culture media at the indicated concentrations and time. PEG-Catalase was dissolved in 50% glycerol/H2O and added to the cells at the indicated amounts. Stock solutions (1 M) of D- and L-alanine in H2O were stored at -20 °C and diluted to the indicated final concentration in growth media 24 hours after cell seeding for proliferation experiments (Figure 1) or 48 hours after esi-RNA transfection (Figure 5). MitoTEMPO was dissolved in DMSO and added at the indicated concentrations. Endogenous CDK2 in RPE-1 CDK2as cells was inhibited by adding 10 μM 3MB-PP1 for the duration of the experiment. To ensure normal CDK-cyclin pairing (Merrick et al., 2011) 0.5 μM 6-benzylaminopurine (6-BAP) was added during cultivation and experiments as indicated. As a positive control for apoptosis (Figure S1) 50 μM sodium azide was added to RPE-1 cells for 24 hours. Related to Figures 1, 4, 5, 6, 7, and S1–S3.
RNA interference
esi-RNA or si-RNA oligonucleotides were delivered using RNAiMAX by reverse transfection according to the manufacturer's instructions. Briefly, transfections contained 16.5 ng esi-RNA per 96 well, 49.5 ng esi-RNA per μ-Slide 8 well, 1 μg esi-RNA per 6 well, or 50 nM of si-RNA mixed with 0.2 μL, 0.6 μL, and 2 μL of RNAiMAX in OPTIMEM, respectively. RNAi-treated cells were analyzed 48 hours after transfection with the exception of long-term time-lapse imaging (Figures 3G and 4A), which was started already after 24 hours. Sequences for esi-and siRNAs are listed in the key resources table. Related to Figures 3, 4, 5, 6, S1, and S2.
Proliferation experiments and EdU detection
To determine initial and final number of cells for proliferation experiments, complete 96 wells were imaged 5 hours after seeding (for esi/si-RNA experiments) or just prior to compound application and at the end of the experiment. Cell numbers were determined by detection and segmentation of nuclei using fluorescently tagged histone 3.1 or staining of DNA with 200 nM SIR-DNA (Spirochrome). For cell growth competition, RPE-1 CDK2as cells stably expressing CDK2 WT and GFP from the same RNA (CDK2 WT_IRES2_eGFP) or CDK2 C177S and mRuby (CDK2 C177S_IRES2_mRuby) were seeded into the same 6 well in the presence of 10 μM 3MB-PP1. Cell numbers of WT and C177S cells were determined by splitting ∼1,000 – 15,000 cells from a 6 well into a 96 well plate, followed by incubation with 200 nM SIR-DNA and imaging 1 hour after seeding, when attachment of cells was complete. WT (GFP positive) and C177S (mRuby positive) cells were identified by single-cell analysis based on nuclear segmentation and GFP/mRuby detection using the segmentation and filter modules of MetaXpress Custom Module Editor (Molecular Devices). The ratio of WT/C177S cells on day 0 was set to 1 and the procedure was repeated on days 3 and 6. DNA replication was assessed by adding 10 μM EdU to cells for 45 minutes (Figures 4D and 4E) or the duration of the experiment (Figure 7N). Afterward, cells were fixed in 4% PFA/PBS for 15 minutes at RT, washed twice in 3% BSA/PBS and extracted for 20 minutes in 0.5% Triton X-100/PBS, followed by two 5 minutes washes in 3% BSA/PBS. Subsequently, EdU was labeled with Alexa 488 using a Click-iT Plus Edu Alexa Fluor 488 Imaging Kit according to the manufacturer’s instructions (Figures 4D and 4E) or by the following protocol: a click mixture of PBS containing 4 mM CuSO4, 5 mM AF647-Picolyl-azide and 10 mM sodium ascorbate was added to cells for 1 hour at RT in the dark (Figure 7N); after removal of the click mixture, cells were washed once in 3% BSA/PBS and PBS followed by staining of DNA with 2 μM Hoechst 33342 for 30 minutes, two washes with PBS, and image analysis. Related to Figures 4 and 7.
Lysate, extracts and interaction studies
To obtain total cell lysates, RPE-1 cells were washed once in PBS followed by the addition of 1x NuPAGE LDS Sample buffer containing 100 mM DTT. For extracts, cells were trypsinized with 2x Trypsin-EDTA, washed once in PBS, resuspended in extraction buffer P (30 mM Tris pH 7.5, 0.25% NP-40, 2.5 mM MgCl2, 175 mM NaCl, 10% glycerol, 1 mM DTT, cOmplete protease inhibitors (Merck), phosSTOP phosphatase inhibitors (Merck), incubated for 20 minutes on ice and centrifuged at 13,000g for 15 minutes at 4°C. Cleared extracts were mixed 3:1 (v/v) with 3x NuPAGE LDS/DTT Sample buffer and boiled at 95°C for 5 minutes. For StrepII pull-downs RPE-1 cells were lysed with extraction buffer S (50 mM Tris pH 8, 150 mM NaCl, 2.5 mM MgCl2, 5% glycerol, 1% Triton X-100), cOmplete protease inhibitors and incubated for 20 minutes on ice. Extracts were cleared (13,000g, 15 minutes, 4 °C) and added to MagStrep "type3" XT beads equilibrated with extraction buffer and incubated for 30 minutes on a rotating wheel at 4 °C. To assess binding of endogenous KAP to CDK2-StrepII-WT, living cells were incubated with 5 mM DTT at 37 °C for 10 minutes prior to extraction in buffer S (-/+ 20 mM DTT). For analyses of CDK2 T160 phosphorylation, cyclin A2 binding, cyclin E1 binding and endogenous KAP, binding beads were washed 3x in extraction buffer S and precipitates were eluted in NuPAGE LDS/DTT sample buffer at 95 °C for 5 minutes. For binding assays with recombinant GST-KAP or CAK, CDK2-WT-StrepII and CDK2-C177S-StrepII immobilized on MagStrep "type3" XT beads were washed 1x in extraction buffer S -/+ 10 mM DTT. For CAK binding assays CDK2 was dephosphorylated by washing beads once in λ -phosphatase buffer with 1 mM MnCl2 and incubated with 400 units of λ phosphatase for 30 minutes at 4 °C. Subsequently, CDK2 WT or C177S beads were incubated with or without 10 mM DTT in extraction buffer S including 0.1 μg/μL bovine serum albumin (BSA) for 30 minutes at 4 °C. KAP binding assays were performed for 30 minutes on a rotating wheel at 4 °C with 60 ng KAP supplied to binding buffer K (50 mM Tris pH 6.8, 150 mM NaCl, 0.1 μg/μL BSA) -/+ 1 mM DTT. CAK binding assays were performed for 1 hour on a rotating wheel at 4 °C with 125 ng of CAK diluted in binding buffer C (8 mM MOPS/NaOH pH 7, 0.2 mM EDTA, 150 mM NaCl) -/+ 1 mM DTT. After binding, beads were washed twice with extraction buffer S and eluted with NuPAGE LDS/DTT sample buffer for 5 min at 95 °C. For binding of endogenous KAP to CDK2-WT-StrepII, living cells were incubated with 5 mM DTT at 37 °C for 10 minutes before extract preparation in buffer S -/+ 20 mM DTT. Staining of CDK2-StrepII pull-downs was performed using a ProteoSilver staining kit according to the manufacturer’s instructions. Related to Figures 3, 4, 5, 6, 7, and S1–S3.
BTD labeling
RPE-1 cells were grown to 80-90% confluency in 15 cm dishes (Greiner Bio-One), washed once in PBS and labeled for sulfenic acids with 1 mM of the sulfenic acid-reactive probe BTD (Gupta et al., 2017). BTD stocks were dissolved in DMSO and added to the growth medium for 30 minutes at 37 °C (0.5% final concentration DMSO). Subsequently, cells were washed twice with PBS and fixed in PBS/1% formaldehyde (FA) supplemented with 10 mM iodoacetamide (IAA) for 15 minutes. After further alkylation in PBS/10 mM IAA for 15 minutes, cells were reduced with 40 mM DTT/PBS for 30 minutes, washed once with PBS, permeabilized with 90% methanol at -20°C for 15 minutes, washed once with PBS and treated with 15 μg/mL benzonase per 15 cm dish for 15 minutes. After an additional wash in PBS, cells were blocked with PBS/5% BSA for 1 hour, washed once in PBS, and incubated with 0.5 nmol picolyl-azide PEG4-biotin in 7.5 mL PBS per dish. Clicking of biotin-azide to the alkene group of BTD was catalyzed by adding a 2x concentrated click mix to reach a final concentration of 1 mM CuSO4, 0.1 mM Tris-[(1-benzyl-1H-1,2,3-triazol-4-yl)-methyl]-amin (TBTA) and 1 mM sodium ascorbate. After 1 hour clicking at RT, cells were washed once with PBS, thrice in PBS/0.1% Tween 20/10 mM EDTA for 10 minutes, once with PBS and scraped in 1 mL of PBS containing 2% SDS/5 mM DTT. Samples were then boiled at 95 °C for 45 minutes to reverse the FA crosslink, cleared for 15 minutes at 13,000g, the supernatants diluted 6 times in PBS and incubated with PBS-equilibrated magnetic streptavidin beads on a wheel overnight at 4 °C. Unbound material was removed, and beads were washed 4x in 4 M urea/0.5% SDS/25 mM HEPES, 4x in PBS/0.5% SDS and then transferred to a clean microfuge tube. After two more PBS washes, bound proteins were eluted by NuPAGE LDS sample buffer supplemented with 2.5 mM biotin/100 mM DTT at 95 °C for 15 minutes (Figures 7B and S2J). To investigate the cell cycle-dependent oxidation of CDK2, RPE-1 cells expressing CDK2-HA WT were grown to 50% confluency and serum-starved for 24 hours. According to Figure S2I, cells were labeled at 8, 18 and 22 hours representing G1, S and G2 phases for 30 minutes at 37 °C in media containing 1% FBS to minimize quenching of the BTD probe by FBS. Subsequently, cells were washed twice with PBS and lysed in 50 mM Tris pH 8, 400 mM NaCl, 5% glycerol, 1% SDS, supplemented with fresh 10 mM TCEP and cOmplete protease inhibitors for 15 minutes at RT. Lysates were alkylated with IAA (40 mM) for 15 minutes at RT in the dark and stored at -80 °C until all time points were collected. Lysates were sonicated to shear DNA, cleared at 13,000 x g, and then a click reaction to conjugate BTD to Az800 (AZDye 800 Picolyl Azide) was performed as described above. Afterwards, proteins were precipitated by chloroform/methanol to remove click reagents and protein pellets were resuspended in 20 mM Tris pH 8, 0.5 M Urea and 0.5% SDS. Lysates were sonicated and diluted 1:7 with Buffer A containing 20 mM Tris pH 8, 120 mM NaCl and 1% Triton and incubated with protein G Dynabeads coupled to HA antibodies for 1 hour at 4 °C. Beads were then washed once with Buffer A supplemented with 120 mM NaCl and thrice with Buffer A supplemented with 400 mM NaCl. CDK2-HA was eluted by boiling beads for 10 minutes at 65 °C in NuPage LDS sample buffer, followed by transfer to a new tube, addition of 100 mM DTT and analysis by SDS-PAGE (Figures 7D and S3B). Related to Figures 7, S2, and S3.
SDS-PAGE and Western blot analyses
Proteins were separated by SDS-PAGE using Bis-Tris 4–12% Bolt gradient gels in MES or MOPS buffers in a Mini Gel Tank (Thermo Fisher). Western blot analyses were performed using a wet transfer Criterion Blotter (BioRad) in MOPS/20% ethanol transfer buffer using Immobilon-FL PVDF membranes. Membranes were blocked for 1 hour at RT in 5% dry milk or 5% soy protein isolate (for CDK2 pT160 detection) prepared in PBS/0.2% Tween 20. Primary antibodies were added overnight at 4 °C, followed by 3x washing in PBS/0.02% Tween 20 and incubation with secondary antibodies for 1 hour at RT. For quantitative detection, fluorescently-labeled secondary antibodies were used with a near-infrared scanning system (Odyssey, Li-COR). Alternatively, detection was performed with horseradish peroxidase (HRP)-conjugated antibodies and Luminata Forte Western HRP Substrate or Super Signal West Femto Maximum Sensitivity Substrate on an ImageQuant LAS4000 system (Amersham Biosciences). Related to Figures 3, 4, 5, 6, 7, and S1–S3.
ROS labeling
For flow cytometry analyses by the LSR Fortessa FACS (BD Bioscience) analyzer, 106 asynchronous cells were labeled for 30 minutes with 5 μg/mL Hoechst 33342, trypsinized, washed in PBS and transferred to CO2-independent L15 medium supplemented with 10% FBS and 1% (v/v) penicillin-streptomycin, 1% (v/v) Glutamax, 0.5 μg/mL Amphotericin B and 0.26% sodium bicarbonate. Then, 5 μg/mL Hoechst 33342 and 5 μM CellRox Deep Red and/or MitoSox Red were added for 30 minutes or 100 nM MitoTracker Green for 10 minutes. ROS labeling of adherent cells was performed in living RPE-1 cells expressing endogenously tagged histone 3.1-Turquoise2, Ruby-PCNA, cyclinA2-Venus using the reagents, concentrations and labeling times indicated above, followed by a brief wash in PBS to remove the excess of the free dye and incubating cells in imaging DMEM (described below). The relative increase of cell volume versus mitochondria during the cell cycle was determined by forward scatter and MitoTracker Green, respectively, and normalized to the G1 population. Related to Figures 2 and S1.
ADP/ATP ratio
The ADP/ATP ratio was determined using an ADP/ATP ratio assay kit 48 hours after PDHB depletion in a 96 well plate. Measurements were performed according to the manufacturer’s instructions on a Glomax Luminometer (Promega). Related to Figure 3.
Microscopy
Automated microscopy was performed on an ImageXpress Micro XLS wide-field screening microscope (Molecular Devices) equipped with 10x, 0.5 NA and 20x, 0.7 NA Plan Apo air objectives (Nikon) and laser-based autofocus. Excitation and detection were done by a Spectra X light engine (Lumencor) and sCMOS (Andor) camera with the indicated filters: DAPI (Ex: 377/50; Dic: 344-404 / 415-570; Em:447/60); CFP (Ex: 438/24; Dic: 426-450/467-600; Em: 483/32); GFP (Ex: 472/30; Dic: 442-488 / 502-730; Em: 520/35), YFP (Ex: 513/17; Dic: 488-512 / 528-625; Em: 542/27), TexasRed (Ex: 575/25 Dic: 530-585 / 601-800; Em: 624/40) and Cy5 (Ex: 628/40; Dic: 594-651 / 669-726; Em: 692/40). During experiments, cells were maintained in a stage incubator at 37 °C in a humidified atmosphere of 5% CO2. All cells were grown in black 96 well clear-bottom plates (μclear, Greiner Bio-One). For long-term time-lapse microscopy and ROS imaging, the growth media was exchanged to an auto-fluorescence-reduced imaging DMEM (Schmitz and Gerlich, 2009) supplemented with 10% (v/v) FBS, 1% (v/v) penicillin-streptomycin, 1% Glutamax, 0.5 μg/mL Amphotericin B and 0.26% sodium bicarbonate. Long-term time-lapse microscopy was performed by taking images using a 10x objective at 7 minutes intervals for 48 hours. To determine the initial and final number of cells for proliferation experiments, the complete 96 well was imaged 5 hours after seeding (for esi/si-RNA experiments) or just prior to compound application and at the end of the experiment. Microscopy of cells stained with ROS-sensitive dyes was performed by acquiring maximum image projection using a 20x objective. For ratio imaging of HyPer2-DAO-NLS and HyPer2-DAO-NES cells with ImageXpress Micro XLS, the following filter sets were used: Ex: (438/24) with Em: (542/27), and Ex: (513/17) with Em: (542/27). For CDK2 sensor imaging of cells grown under physiological %O2, cells were fixed in 3.7% PFA/PBS before exposure to atmospheric O2. For ratio imaging to assess differences in ROS content between esi-CTRL and esi-PDHB treatments in HyPer 7-expressing cells, a Delta Vision Core wide-field deconvolution fluorescence microscope equipped with a CoolSNAP HQ2/HQ2-ICX285 camera (Applied Precision Inc.) and a UPlanSApo 40X/NA 0.95 lens (Olympus) was used. Cells were imaged using the following filters: Ex: (381-401) with Em: (500-523) and Ex: (464-492) with Em: (500-523). Related to Figures 1, 2, 3, 4, 5, 6, 7, S1, and S2.
Quantification and statistical analysis
Image analysis
Image analyses of single time points were performed in MetaXpress 5 and 6 (Molecular Devices) using customized image analysis pipelines. Briefly, images were flat-field and background corrected using a tophat filter and nuclei were segmented based on DNA or Ruby-PCNA labeling to create masks for fluorescence extraction. To determine the initial and final number of cells in proliferation experiments, the complete 96 well was imaged 5 hours after seeding (for esi/si-RNA experiments) or prior to compound application and again at the end of the experiment. Detection of PCNA replication foci was performed using the nuclear speckle plugin from the MetaXpress Custom Module Editor. Fucci analysis was performed by segmenting all nuclei based on SIR-DNA staining and by merging the nuclear intensities of Gem(1-110) and Cdt(30-120) to a common segmentation mask. Gem(1-110)- and Cdt(30-120)-positive cells were assigned by minimum threshold filtering and the cell cycle distribution was indicated as a fraction of the sum of Gem(1-110)- or Cdt(30-120)-positive cells (Figure S2C). Time-lapse analysis of single cells was performed as previously described (Zerjatke et al., 2017). Briefly, all images were background corrected using flat-field correction, and nuclei were segmented based on histone 3.1 labeling using intensity thresholding and subsequent watershed filtering. Time-lapse single-cell tracking was performed with a nearest-neighbor approach and subsequent manual track curation using TraCurate (Wagner et al., 2021). Cell cycle phases were classified according to PCNA mean intensity and distribution as described in Zerjatke et al. (2017). Nuclear CDK2 levels were quantified as mean intensities based on the histone segmentation masks. Cytoplasmic CDK2 levels were quantified as the mean intensities in two cap regions adjacent to the poles of each cell nuclei. Image analysis and quantification were performed with Mathematica 12.1 (Wolfram Research Inc.). Thresholds for CDK2Low/CDK2High cells were determined by histogram analysis of ratios of nuclear and cytoplasmic CDK2 to identify the CDK2Low peak (Spencer et al., 2013). Ratio image analyses were performed in Fiji (Schindelin et al., 2012) using the Ratio Plus plugin as previously described (Kardash et al., 2011). Ratio image analyses of HyPer7 images were performed using a semi-automated Fiji macro. Briefly, the images were background corrected (rolling ball = 50), smoothened and a mask was defined based on the HyPer7 Ex: (464-492)/Em: (500-523) image and binarized. Then, images from both excitations were multiplied with the mask to remove background, converted to 32 bit, and the ratio image was calculated by dividing the HyPer 7 signal from (Ex: 464-492)/(Em: 500-523) by (Ex: 381-401)/Em: (500-523). Flow cytometry analyses were performed in FlowJo (Becton, Dickinson and Company). Forward scatter values were used as a relative proxy for cell size. Related to Figures 1, 3, 4, 5, 6, 7, S1, and S2.
Statistical methods
Data normalization was performed in Microsoft Excel (Microsoft), and statistical analysis and graph presentation were performed in Prism 6-9 (GraphPad) using the statistical tests indicated in the figure legends. All data are representative of at least three independent repeats unless otherwise stated. The notation n refers to the number of independently performed experiments, and the notation N refers to the number of data points used for statistical analyses and data presentation. A p-value lower than 0.05 was considered statistically significant and individual p-values are indicated in each figure or figure legend. Bar charts indicate the mean ± SD and show all data points for N<10. Box plots show the median and 25th-75th percentiles, and whiskers represent the 5th-95th percentiles. For quantitative Western blot analyses by near-infrared fluorescence detection (Li-COR), band intensities were divided by the intensity of the loading control or total CDK2 levels (for pT160) to correct for sample loading. Time-lapse data of single-cell ratio imaging were smoothened with the 4 neighbors on each side and a 6th order polynomial using Prism 6. For flow cytometry analyses, the intensities of individual cell cycle phases were normalized by the sum of intensities of all cell cycle phases to correct for differences in overall staining intensities between experiments. No randomization or blinding was performed in this study. Related to Figures 1, 2, 3, 4, 5, 6, 7, and S1–S3.
Acknowledgments
We thank K. Carroll and A. Nadler for providing BTD, V. Belousov for HyPer7 and HyPer2-DAO constructs, S. Spencer for CDK2 sensor, R. Fisher for RPE-1 CDK2as cells and experimental suggestions, T.D. Vu and M. Cuenca for help with single-cell tracking and ratio analysis, A. Radzisheuskaya for advice on cell competition, J. Pines for critical reading of the manuscript, and members of the Mansfeld laboratory for technical help and discussions. J.M. receives funding from the European Research Council under the European Union’s Horizon 2020 research and innovation program (ERC starters grant: 680042) and is supported by the Institute of Cancer Research (ICR) London. D.G.K., K.J., and J.V. are members of the Dresden Biomedicine and Bioengineering PhD program. J.K.L. receives funding from the ICR/RM CRUK RadNet Centre of Excellence (grant: A28724). We acknowledge support from the Light Microscopy and Flow Cytometry Facilities of the Center for Molecular and Cellular Bioengineering (TU Dresden) and the Chelsea Light Microscopy Facility (ICR).
Author contributions
Conceptualization, J.M. and D.G.K.; methodology, D.G.K., K.J., J.V., T.Z., I.G., and J.M.; investigation, D.G.K., K.J., J.V., J.K.L., and J.M.; writing—original draft, D.G.K., K.J., and J.M.; writing—revised manuscript, K.J., J.K.L., and J.M.; funding acquisition, I.G. and J.M.; supervision, I.G. and J.M.
Declaration of interests
The authors declare no competing interests.
Published: July 7, 2022
Footnotes
Supplemental information can be found online at https://doi.org/10.1016/j.devcel.2022.06.008.
Supplemental information
Data and code availability
-
•
This paper does not contain standardized datatypes. All other datatypes will be shared by the lead contact upon request.
-
•
This paper does not report original code.
-
•
Any additional information required to reanalyze the data reported in this paper is available from the lead contact upon request.
References
- Adusumilli V.S., Walker T.L., Overall R.W., Klatt G.M., Zeidan S.A., Zocher S., Kirova D.G., Ntitsias K., Fischer T.J., Sykes A.M., et al. ROS Dynamics Delineate functional states of hippocampal neural stem cells and link to their activity-dependent exit from quiescence. Cell Stem Cell. 2021;28:300–314.e6. doi: 10.1016/j.stem.2020.10.019. [DOI] [PMC free article] [PubMed] [Google Scholar]
- Ahmed Alfar E., Kirova D., Konantz J., Birke S., Mansfeld J., Ninov N. Distinct levels of reactive oxygen species coordinate metabolic activity with beta-cell mass plasticity. Sci. Rep. 2017;7:3994. doi: 10.1038/s41598-017-03873-9. [DOI] [PMC free article] [PubMed] [Google Scholar]
- Armstrong L., Tilgner K., Saretzki G., Atkinson S.P., Stojkovic M., Moreno R., Przyborski S., Lako M. Human induced pluripotent stem cell lines show stress defense mechanisms and mitochondrial regulation similar to those of human embryonic stem cells. Stem Cells Dayt. Ohio. 2010;28:661–673. doi: 10.1002/stem.307. [DOI] [PubMed] [Google Scholar]
- Balin A.K., Pratt L., Allen R.G. Effects of ambient oxygen concentration on the growth and antioxidant defenses of of human cell cultures established from fetal and postnatal skin. Free Radic. Biol. Med. 2002;32:257–267. doi: 10.1016/s0891-5849(01)00807-3. [DOI] [PubMed] [Google Scholar]
- Bedard K., Krause K.H. The NOX family of ROS-generating NADPH oxidases: physiology and pathophysiology. Physiol. Rev. 2007;87:245–313. doi: 10.1152/physrev.00044.2005. [DOI] [PubMed] [Google Scholar]
- Bodnar A.G., Ouellette M., Frolkis M., Holt S.E., Chiu C.P., Morin G.B., Harley C.B., Shay J.W., Lichtsteiner S., Wright W.E. Extension of life-span by introduction of telomerase into normal human cells. Science. 1998;279:349–352. doi: 10.1126/science.279.5349.349. [DOI] [PubMed] [Google Scholar]
- Bonini M.G., Rota C., Tomasi A., Mason R.P. The oxidation of 2’,7’-dichlorofluorescin to reactive oxygen species: a self-fulfilling prophesy? Free Radic. Biol. Med. 2006;40:968–975. doi: 10.1016/j.freeradbiomed.2005.10.042. [DOI] [PubMed] [Google Scholar]
- Brown N.R., Noble M.E., Lawrie A.M., Morris M.C., Tunnah P., Divita G., Johnson L.N., Endicott J.A. Effects of phosphorylation of threonine 160 on cyclin-dependent kinase 2 structure and activity. J. Biol. Chem. 1999;274:8746–8756. doi: 10.1074/jbc.274.13.8746. [DOI] [PubMed] [Google Scholar]
- Burhans W.C., Heintz N.H. The cell cycle is a redox cycle: linking phase-specific targets to cell fate. Free Radic. Biol. Med. 2009;47:1282–1293. doi: 10.1016/j.freeradbiomed.2009.05.026. [DOI] [PubMed] [Google Scholar]
- Cheng A., Ross K.E., Kaldis P., Solomon M.J. Dephosphorylation of cyclin-dependent kinases by type 2C protein phosphatases. Genes Dev. 1999;13:2946–2957. doi: 10.1101/gad.13.22.2946. [DOI] [PMC free article] [PubMed] [Google Scholar]
- Chiu J., Dawes I.W. Redox control of cell proliferation. Trends Cell Biol. 2012;22:592–601. doi: 10.1016/j.tcb.2012.08.002. [DOI] [PubMed] [Google Scholar]
- Collin P., Nashchekina O., Walker R., Pines J. The spindle assembly checkpoint works like a rheostat rather than a toggle switch. Nat. Cell Biol. 2013;15:1378–1385. doi: 10.1038/ncb2855. [DOI] [PMC free article] [PubMed] [Google Scholar]
- Connor K.M., Subbaram S., Regan K.J., Nelson K.K., Mazurkiewicz J.E., Bartholomew P.J., Aplin A.E., Tai Y.T., Aguirre-Ghiso J., Flores S.C., et al. Mitochondrial H2O2 regulates the angiogenic phenotype via PTEN oxidation. J. Biol. Chem. 2005;280:16916–16924. doi: 10.1074/jbc.M410690200. [DOI] [PubMed] [Google Scholar]
- Desai D., Wessling H.C., Fisher R.P., Morgan D.O. Effects of phosphorylation by CAK on cyclin binding by CDC2 and CDK2. Mol. Cell. Biol. 1995;15:345–350. doi: 10.1128/mcb.15.1.345. [DOI] [PMC free article] [PubMed] [Google Scholar]
- Fesquet D., Labbé J.C., Derancourt J., Capony J.P., Galas S., Girard F., Lorca T., Shuttleworth J., Dorée M., Cavadore J.C. The MO15 gene encodes the catalytic subunit of a protein kinase that activates cdc2 and other cyclin-dependent kinases (CDKs) through phosphorylation of Thr161 and its homologues. EMBO J. 1993;12:3111–3121. doi: 10.1002/j.1460-2075.1993.tb05980.x. [DOI] [PMC free article] [PubMed] [Google Scholar]
- Fisher R.P. Secrets of a double agent: CDK7 in cell-cycle control and transcription. J. Cell Sci. 2005;118:5171–5180. doi: 10.1242/jcs.02718. [DOI] [PubMed] [Google Scholar]
- Fisher R.P., Morgan D.O. A novel cyclin associates with MO15/CDK7 to form the CDK-activating kinase. Cell. 1994;78:713–724. doi: 10.1016/0092-8674(94)90535-5. [DOI] [PubMed] [Google Scholar]
- Gough D.R., Cotter T.G. Hydrogen peroxide: a Jekyll and Hyde signalling molecule. Cell Death Dis. 2011;2:e213. doi: 10.1038/cddis.2011.96. [DOI] [PMC free article] [PubMed] [Google Scholar]
- Gould K.L., Moreno S., Owen D.J., Sazer S., Nurse P. Phosphorylation at Thr167 is required for Schizosaccharomyces pombe p34cdc2 function. EMBO J. 1991;10:3297–3309. doi: 10.1002/j.1460-2075.1991.tb04894.x. [DOI] [PMC free article] [PubMed] [Google Scholar]
- Gupta V., Carroll K.S. Profiling the reactivity of cyclic C-nucleophiles towards electrophilic sulfur in cysteine sulfenic acid. Chem. Sci. 2016;7:400–415. doi: 10.1039/c5sc02569a. [DOI] [PMC free article] [PubMed] [Google Scholar]
- Gupta V., Yang J., Liebler D.C., Carroll K.S. Diverse Redoxome reactivity profiles of carbon nucleophiles. J. Am. Chem. Soc. 2017;139:5588–5595. doi: 10.1021/jacs.7b01791. [DOI] [PMC free article] [PubMed] [Google Scholar]
- Gurusamy N., Mukherjee S., Lekli I., Bearzi C., Bardelli S., Das D.K. Inhibition of ref-1 stimulates the production of reactive oxygen species and induces differentiation in adult cardiac stem cells. Antioxid. Redox Signal. 2009;11:589–600. doi: 10.1089/ars.2008.2195. [DOI] [PMC free article] [PubMed] [Google Scholar]
- Gyuris J., Golemis E., Chertkov H., Brent R. Cdi1, a human G1 and S phase protein phosphatase that associates with Cdk2. Cell. 1993;75:791–803. doi: 10.1016/0092-8674(93)90498-f. [DOI] [PubMed] [Google Scholar]
- Hannon G.J., Casso D., Beach D. KAP: a dual specificity phosphatase that interacts with cyclin-dependent kinases. Proc. Natl. Acad. Sci. USA. 1994;91:1731–1735. doi: 10.1073/pnas.91.5.1731. [DOI] [PMC free article] [PubMed] [Google Scholar]
- Harper J.W., Elledge S.J. The role of Cdk7 in CAK function, a retro-retrospective. Genes Dev. 1998;12:285–289. doi: 10.1101/gad.12.3.285. [DOI] [PubMed] [Google Scholar]
- Havens C.G., Ho A., Yoshioka N., Dowdy S.F. Regulation of late G1/S phase transition and APC Cdh1 by reactive oxygen species. Mol. Cell. Biol. 2006;26:4701–4711. doi: 10.1128/MCB.00303-06. [DOI] [PMC free article] [PubMed] [Google Scholar]
- Holmström K.M., Finkel T. Cellular mechanisms and physiological consequences of redox-dependent signalling. Nat. Rev. Mol. Cell Biol. 2014;15:411–421. doi: 10.1038/nrm3801. [DOI] [PubMed] [Google Scholar]
- Irani K., Xia Y., Zweier J.L., Sollott S.J., Der C.J., Fearon E.R., Sundaresan M., Finkel T., Goldschmidt-Clermont P.J. Mitogenic signaling mediated by oxidants in Ras-transformed fibroblasts. Science. 1997;275:1649–1652. doi: 10.1126/science.275.5306.1649. [DOI] [PubMed] [Google Scholar]
- Ivanova J.S., Pugovkina N.A., Neganova I.E., Kozhukharova I.V., Nikolsky N.N., Lyublinskaya O.G. Cell cycle-coupled changes in the level of reactive oxygen species support the proliferation of human pluripotent stem cells. Stem Cells Dayt. Ohio. 2021;39:1671–1687. doi: 10.1002/stem.3450. [DOI] [PubMed] [Google Scholar]
- Jones R.G., Plas D.R., Kubek S., Buzzai M., Mu J., Xu Y., Birnbaum M.J., Thompson C.B. AMP-activated protein kinase induces a p53-dependent metabolic checkpoint. Mol. Cell. 2005;18:283–293. doi: 10.1016/j.molcel.2005.03.027. [DOI] [PubMed] [Google Scholar]
- Kalyanaraman B., Darley-Usmar V., Davies K.J., Dennery P.A., Forman H.J., Grisham M.B., Mann G.E., Moore K., Roberts L.J., Ischiropoulos H. Measuring reactive oxygen and nitrogen species with fluorescent probes: challenges and limitations. Free Radic. Biol. Med. 2012;52:1–6. doi: 10.1016/j.freeradbiomed.2011.09.030. [DOI] [PMC free article] [PubMed] [Google Scholar]
- Kardash E., Bandemer J., Raz E. Imaging protein activity in live embryos using fluorescence resonance energy transfer biosensors. Nat. Protoc. 2011;6:1835–1846. doi: 10.1038/nprot.2011.395. [DOI] [PubMed] [Google Scholar]
- Kim K.Y., Rhim T., Choi I., Kim S.S. N-acetylcysteine induces cell cycle arrest in hepatic stellate cells through its reducing activity. J. Biol. Chem. 2001;276:40591–40598. doi: 10.1074/jbc.M100975200. [DOI] [PubMed] [Google Scholar]
- Kyaw M., Yoshizumi M., Tsuchiya K., Izawa Y., Kanematsu Y., Fujita Y., Ali N., Ishizawa K., Yamauchi A., Tamaki T. Antioxidant effects of stereoisomers of N-acetylcysteine (NAC), L-NAC and D-NAC, on angiotensin II-stimulated MAP kinase activation and vascular smooth muscle cell proliferation. J. Pharmacol. Sci. 2004;95:483–486. doi: 10.1254/jphs.sc0040061. [DOI] [PubMed] [Google Scholar]
- Larochelle S., Merrick K.A., Terret M.E., Wohlbold L., Barboza N.M., Zhang C., Shokat K.M., Jallepalli P.V., Fisher R.P. Requirements for Cdk7 in the assembly of Cdk1/cyclin B and activation of Cdk2 revealed by chemical genetics in human cells. Mol. Cell. 2007;25:839–850. doi: 10.1016/j.molcel.2007.02.003. [DOI] [PMC free article] [PubMed] [Google Scholar]
- Lee Y.-H., Chu W.-S. D-amino acid oxidase activity form Rhodosporiduim toruloides. Lett. Appl. Microbiol. 1996;23:283–286. [Google Scholar]
- Leonhardt H., Rahn H.P., Weinzierl P., Sporbert A., Cremer T., Zink D., Cardoso M.C. Dynamics of DNA replication factories in living cells. J. Cell Biol. 2000;149:271–280. doi: 10.1083/jcb.149.2.271. [DOI] [PMC free article] [PubMed] [Google Scholar]
- Mäkelä T.P., Tassan J.P., Nigg E.A., Frutiger S., Hughes G.J., Weinberg R.A. A cyclin associated with the CDK-activating kinase MO15. Nature. 1994;371:254–257. doi: 10.1038/371254a0. [DOI] [PubMed] [Google Scholar]
- Mandal S., Guptan P., Owusu-Ansah E., Banerjee U. Mitochondrial regulation of cell cycle progression during development as revealed by the tenured mutation in Drosophila. Dev. Cell. 2005;9:843–854. doi: 10.1016/j.devcel.2005.11.006. [DOI] [PubMed] [Google Scholar]
- Matlashov M.E., Belousov V.V., Enikolopov G. How much H(2)O(2) is produced by recombinant D-amino acid oxidase in mammalian cells? Antioxid. Redox Signal. 2014;20:1039–1044. doi: 10.1089/ars.2013.5618. [DOI] [PMC free article] [PubMed] [Google Scholar]
- Menon S.G., Goswami P.C. A redox cycle within the cell cycle: ring in the old with the new. Oncogene. 2007;26:1101–1109. doi: 10.1038/sj.onc.1209895. [DOI] [PubMed] [Google Scholar]
- Menon S.G., Sarsour E.H., Kalen A.L., Venkataraman S., Hitchler M.J., Domann F.E., Oberley L.W., Goswami P.C. Superoxide signaling mediates N-acetyl-L-cysteine-induced G1 arrest: regulatory role of cyclin D1 and manganese superoxide dismutase. Cancer Res. 2007;67:6392–6399. doi: 10.1158/0008-5472.CAN-07-0225. [DOI] [PubMed] [Google Scholar]
- Merrick K.A., Larochelle S., Zhang C., Allen J.J., Shokat K.M., Fisher R.P. Distinct activation pathways confer cyclin-binding specificity on Cdk1 and Cdk2 in human cells. Mol. Cell. 2008;32:662–672. doi: 10.1016/j.molcel.2008.10.022. [DOI] [PMC free article] [PubMed] [Google Scholar]
- Merrick K.A., Wohlbold L., Zhang C., Allen J.J., Horiuchi D., Huskey N.E., Goga A., Shokat K.M., Fisher R.P. Switching Cdk2 on or off with small molecules to reveal requirements in human cell proliferation. Mol. Cell. 2011;42:624–636. doi: 10.1016/j.molcel.2011.03.031. [DOI] [PMC free article] [PubMed] [Google Scholar]
- Mitra K., Wunder C., Roysam B., Lin G., Lippincott-Schwartz J. A hyperfused mitochondrial state achieved at G1-S regulates cyclin E buildup and entry into S phase. Proc. Natl. Acad. Sci. USA. 2009;106:11960–11965. doi: 10.1073/pnas.0904875106. [DOI] [PMC free article] [PubMed] [Google Scholar]
- Moll F., Walter M., Rezende F., Helfinger V., Vasconez E., De Oliveira T., Greten F.R., Olesch C., Weigert A., Radeke H.H., et al. NoxO1 controls proliferation of colon epithelial cells. Front. Immunol. 2018;9:973. doi: 10.3389/fimmu.2018.00973. [DOI] [PMC free article] [PubMed] [Google Scholar]
- Möller M.N., Cuevasanta E., Orrico F., Lopez A.C., Thomson L., Denicola A. Diffusion and transport of reactive species Across cell membranes. Adv. Exp. Med. Biol. 2019;1127:3–19. doi: 10.1007/978-3-030-11488-6_1. [DOI] [PubMed] [Google Scholar]
- Morgan D.O. New Science Press; 2007. The Cell Cycle: Principles of Control. [Google Scholar]
- Murphy M.P. How mitochondria produce reactive oxygen species. Biochem. J. 2009;417:1–13. doi: 10.1042/BJ20081386. [DOI] [PMC free article] [PubMed] [Google Scholar]
- Murrell G.A., Francis M.J., Bromley L. Modulation of fibroblast proliferation by oxygen free radicals. Biochem. J. 1990;265:659–665. doi: 10.1042/bj2650659. [DOI] [PMC free article] [PubMed] [Google Scholar]
- Ogrunc M., Di Micco R., Liontos M., Bombardelli L., Mione M., Fumagalli M., Gorgoulis V.G., d’Adda di Fagagna F. Oncogene-induced reactive oxygen species fuel hyperproliferation and DNA damage response activation. Cell Death Differ. 2014;21:998–1012. doi: 10.1038/cdd.2014.16. [DOI] [PMC free article] [PubMed] [Google Scholar]
- Oh E., Mark K.G., Mocciaro A., Watson E.R., Prabu J.R., Cha D.D., Kampmann M., Gamarra N., Zhou C.Y., Rape M. Gene expression and cell identity controlled by anaphase-promoting complex. Nature. 2020;579:136–140. doi: 10.1038/s41586-020-2034-1. [DOI] [PMC free article] [PubMed] [Google Scholar]
- Ohguro N., Fukuda M., Sasabe T., Tano Y. Concentration dependent effects of hydrogen peroxide on lens epithelial cells. Br. J. Ophthalmol. 1999;83:1064–1068. doi: 10.1136/bjo.83.9.1064. [DOI] [PMC free article] [PubMed] [Google Scholar]
- Owusu-Ansah E., Yavari A., Mandal S., Banerjee U. Distinct mitochondrial retrograde signals control the G1-S cell cycle checkpoint. Nat. Genet. 2008;40:356–361. doi: 10.1038/ng.2007.50. [DOI] [PubMed] [Google Scholar]
- Pak V.V., Ezeriņa D., Lyublinskaya O.G., Pedre B., Tyurin-Kuzmin P.A., Mishina N.M., Thauvin M., Young D., Wahni K., Martínez Gache S.A., et al. Ultrasensitive genetically encoded indicator for hydrogen peroxide identifies roles for the oxidant in cell migration and mitochondrial function. Cell Metab. 2020;31:642–653.e6. doi: 10.1016/j.cmet.2020.02.003. [DOI] [PMC free article] [PubMed] [Google Scholar]
- Paul M.K., Bisht B., Darmawan D.O., Chiou R., Ha V.L., Wallace W.D., Chon A.T., Hegab A.E., Grogan T., Elashoff D.A., et al. Dynamic changes in intracellular ROS levels regulate airway basal stem cell homeostasis through Nrf2-dependent Notch signaling. Cell Stem Cell. 2014;15:199–214. doi: 10.1016/j.stem.2014.05.009. [DOI] [PMC free article] [PubMed] [Google Scholar]
- Poon R.Y., Hunter T. Dephosphorylation of Cdk2 Thr160 by the cyclin-dependent kinase-interacting phosphatase KAP in the absence of cyclin. Science. 1995;270:90–93. doi: 10.1126/science.270.5233.90. [DOI] [PubMed] [Google Scholar]
- Poon R.Y., Yamashita K., Adamczewski J.P., Hunt T., Shuttleworth J. The cdc2-related protein p40MO15 is the catalytic subunit of a protein kinase that can activate p33cdk2 and p34cdc2. EMBO J. 1993;12:3123–3132. doi: 10.1002/j.1460-2075.1993.tb05981.x. [DOI] [PMC free article] [PubMed] [Google Scholar]
- Rapkine L. A thiol cycle in dividing urchin eggs. Ann. Physicochim. Biol. 1931;7:382–386. [Google Scholar]
- Reczek C.R., Chandel N.S. The two faces of reactive oxygen species in cancer. Annu. Rev. Cancer Biol. 2017;1:79–98. [Google Scholar]
- Reddie K.G., Carroll K.S. Expanding the functional diversity of proteins through cysteine oxidation. Curr. Opin. Chem. Biol. 2008;12:746–754. doi: 10.1016/j.cbpa.2008.07.028. [DOI] [PubMed] [Google Scholar]
- Robbins E., Morrill G.A. Oxygen uptake during the HeLa cell life cycle and its correlation with macromolecular synthesis. J. Cell Biol. 1969;43:629–633. doi: 10.1083/jcb.43.3.629. [DOI] [PMC free article] [PubMed] [Google Scholar]
- Safford S.E., Oberley T.D., Urano M., St Clair D.K. Suppression of fibrosarcoma metastasis by elevated expression of manganese superoxide dismutase. Cancer Res. 1994;54:4261–4265. [PubMed] [Google Scholar]
- Sakaue-Sawano A., Kurokawa H., Morimura T., Hanyu A., Hama H., Osawa H., Kashiwagi S., Fukami K., Miyata T., Miyoshi H., et al. Visualizing spatiotemporal dynamics of multicellular cell-cycle progression. Cell. 2008;132:487–498. doi: 10.1016/j.cell.2007.12.033. [DOI] [PubMed] [Google Scholar]
- Sansam C.G., Goins D., Siefert J.C., Clowdus E.A., Sansam C.L. Cyclin-dependent kinase regulates the length of S phase through TICRR/TRESLIN phosphorylation. Genes Dev. 2015;29:555–566. doi: 10.1101/gad.246827.114. [DOI] [PMC free article] [PubMed] [Google Scholar]
- Schieber M., Chandel N.S. ROS function in redox signaling and oxidative stress. Curr. Biol. 2014;24:R453–R462. doi: 10.1016/j.cub.2014.03.034. [DOI] [PMC free article] [PubMed] [Google Scholar]
- Schindelin J., Arganda-Carreras I., Frise E., Kaynig V., Longair M., Pietzsch T., Preibisch S., Rueden C., Saalfeld S., Schmid B., et al. Fiji: an open-source platform for biological-image analysis. Nat. Methods. 2012;9:676–682. doi: 10.1038/nmeth.2019. [DOI] [PMC free article] [PubMed] [Google Scholar]
- Schmitz M.H.A., Gerlich D.W. Automated live microscopy to study mitotic gene function in fluorescent reporter cell lines. Methods Mol. Biol. 2009;545:113–134. doi: 10.1007/978-1-60327-993-2_7. [DOI] [PubMed] [Google Scholar]
- Shadel G.S., Horvath T.L. Mitochondrial ROS signaling in organismal homeostasis. Cell. 2015;163:560–569. doi: 10.1016/j.cell.2015.10.001. [DOI] [PMC free article] [PubMed] [Google Scholar]
- Shi Y., Fu L., Yang J., Carroll K.S. Wittig reagents for chemoselective sulfenic acid ligation enables global site stoichiometry analysis and redox-controlled mitochondrial targeting. Nat. Chem. 2021;13:1140–1150. doi: 10.1038/s41557-021-00767-2. [DOI] [PMC free article] [PubMed] [Google Scholar]
- Sigaud S., Evelson P., González-Flecha B. H2O2-induced proliferation of primary alveolar epithelial cells is mediated by MAP kinases. Antioxid. Redox Signal. 2005;7:6–13. doi: 10.1089/ars.2005.7.6. [DOI] [PubMed] [Google Scholar]
- Solomon M.J., Harper J.W., Shuttleworth J. CAK, the p34cdc2 activating kinase, contains a protein identical or closely related to p40MO15. EMBO J. 1993;12:3133–3142. doi: 10.1002/j.1460-2075.1993.tb05982.x. [DOI] [PMC free article] [PubMed] [Google Scholar]
- Song H., Hanlon N., Brown N.R., Noble M.E., Johnson L.N., Barford D. Phosphoprotein-protein interactions revealed by the crystal structure of kinase-associated phosphatase in complex with phosphoCDK2. Mol. Cell. 2001;7:615–626. doi: 10.1016/s1097-2765(01)00208-8. [DOI] [PubMed] [Google Scholar]
- Spencer S.L., Cappell S.D., Tsai F.C., Overton K.W., Wang C.L., Meyer T. The proliferation-quiescence decision is controlled by a bifurcation in CDK2 activity at mitotic exit. Cell. 2013;155:369–383. doi: 10.1016/j.cell.2013.08.062. [DOI] [PMC free article] [PubMed] [Google Scholar]
- Sullivan L.B., Gui D.Y., Hosios A.M., Bush L.N., Freinkman E., Vander Heiden M.G. Supporting aspartate biosynthesis is an essential function of respiration in proliferating cells. Cell. 2015;162:552–563. doi: 10.1016/j.cell.2015.07.017. [DOI] [PMC free article] [PubMed] [Google Scholar]
- Trotter E.W., Hagan I.M. Release from cell cycle arrest with Cdk4/6 inhibitors generates highly synchronized cell cycle progression in human cell culture. Open Biol. 2020;10:200200. doi: 10.1098/rsob.200200. [DOI] [PMC free article] [PubMed] [Google Scholar]
- Tsai C.C., Chen Y.J., Yew T.L., Chen L.L., Wang J.Y., Chiu C.H., Hung S.C. Hypoxia inhibits senescence and maintains mesenchymal stem cell properties through down-regulation of E2A-p21 by HIF-TWIST. Blood. 2011;117:459–469. doi: 10.1182/blood-2010-05-287508. [DOI] [PubMed] [Google Scholar]
- van den Heuvel S., Harlow E. Distinct roles for cyclin-dependent kinases in cell cycle control. Science. 1993;262:2050–2054. doi: 10.1126/science.8266103. [DOI] [PubMed] [Google Scholar]
- Wagner S., Thierbach K., Zerjatke T., Glauche I., Roeder I., Scherf N. TraCurate: efficiently curating cell tracks. SoftwareX. 2021;13:100656. [Google Scholar]
- Wang Y., Branicky R., Noë A., Hekimi S. Superoxide dismutases: dual roles in controlling ROS damage and regulating ROS signaling. J. Cell Biol. 2018;217:1915–1928. doi: 10.1083/jcb.201708007. [DOI] [PMC free article] [PubMed] [Google Scholar]
- Wartenberg M., Diedershagen H., Hescheler J., Sauer H. Growth stimulation versus induction of cell quiescence by hydrogen peroxide in prostate tumor spheroids is encoded by the duration of the Ca(2+) response. J. Biol. Chem. 1999;274:27759–27767. doi: 10.1074/jbc.274.39.27759. [DOI] [PubMed] [Google Scholar]
- Weinberg F., Hamanaka R., Wheaton W.W., Weinberg S., Joseph J., Lopez M., Kalyanaraman B., Mutlu G.M., Budinger G.R., Chandel N.S. Mitochondrial metabolism and ROS generation are essential for Kras-mediated tumorigenicity. Proc. Natl. Acad. Sci. USA. 2010;107:8788–8793. doi: 10.1073/pnas.1003428107. [DOI] [PMC free article] [PubMed] [Google Scholar]
- Winterbourn C.C. Reconciling the chemistry and biology of reactive oxygen species. Nat. Chem. Biol. 2008;4:278–286. doi: 10.1038/nchembio.85. [DOI] [PubMed] [Google Scholar]
- Xiao H., Jedrychowski M.P., Schweppe D.K., Huttlin E.L., Yu Q., Heppner D.E., Li J., Long J., Mills E.L., Szpyt J., et al. A quantitative tissue-specific landscape of protein redox regulation during. Aging Cell. 2020;180:968–983.e24. doi: 10.1016/j.cell.2020.02.012. [DOI] [PMC free article] [PubMed] [Google Scholar]
- Yang J., Gupta V., Tallman K.A., Porter N.A., Carroll K.S., Liebler D.C. Global, in situ, site-specific analysis of protein S-sulfenylation. Nat. Protoc. 2015;10:1022–1037. doi: 10.1038/nprot.2015.062. [DOI] [PMC free article] [PubMed] [Google Scholar]
- Yeh C.T., Lu S.C., Chao C.H., Chao M.L. Abolishment of the interaction between cyclin-dependent kinase 2 and Cdk-associated protein phosphatase by a truncated KAP mutant. Biochem. Biophys. Res. Commun. 2003;305:311–314. doi: 10.1016/s0006-291x(03)00757-5. [DOI] [PubMed] [Google Scholar]
- Zerjatke T., Gak I.A., Kirova D., Fuhrmann M., Daniel K., Gonciarz M., Müller D., Glauche I., Mansfeld J. Quantitative cell cycle analysis based on an endogenous all-in-one reporter for cell tracking and classification. Cell Rep. 2017;19:1953–1966. doi: 10.1016/j.celrep.2017.05.022. [DOI] [PMC free article] [PubMed] [Google Scholar]
Associated Data
This section collects any data citations, data availability statements, or supplementary materials included in this article.
Supplementary Materials
Single-cell time-lapse imaging in RPE-1 mRuby-PCNA cells showing replication foci formation every 7 minutes after at least 24 hours of esi-CTRL treatment. For better visualization of the nucleus, the segmentation mask is shown. Scale bar = 20 μm.
Single-cell time-lapse imaging in RPE-1 mRuby-PCNA cells showing replication foci formation every 7 minutes after at least 24 hours of esi-PDHB treatment. For better visualization of the nucleus, the segmentation mask is shown. Scale bar = 20 μm.
Data Availability Statement
-
•
This paper does not contain standardized datatypes. All other datatypes will be shared by the lead contact upon request.
-
•
This paper does not report original code.
-
•
Any additional information required to reanalyze the data reported in this paper is available from the lead contact upon request.